
6.4. Quantitative Acidity
6.4.1. pKa
In general chemistry most discussions of acidity focus exclusively on pKa values rather than on qualitative analysis. As such, an in-depth discussion of pKa is not necessary for introductory organic chemistry.
pKa is a logarithmic scale with its value derived from the experimentally measured amounts of acid and conjugate base in solution at equilibrium. It is important to remember that the logarithmic nature can make the differences seem smaller than they are. Consider two acids, one with a pKa of 6 and the other with a pKa of 3. The acid with a pKa of 3 is not two or three times as acidic as the one with a pKa of 6, it is 106-3 = 103 = 1,000 times more acidic. As a result, generally small changes in acidity are not intuitively represented in pKa values.
The lower the value of pKa, the stronger the acid. It is thus easy to compare any set of acids at a glance by comparing their pKa values and determining which is lower. An important caveat to this is that compounds that are very acidic (usually with pKa values below 0) or that are not acidic (usually with pKa values above 15) cannot have their pKa values measured directly in the same way. As a result, there is often a moderate degree of variability in pKa values for these acids as different sources measure and correct their values in different ways. When comparing pKa values in these ranges it is important to assume the values are approximate rather than exact.
6.4.2. pKa Tables
Exact pKa values for many compounds have been measured. However, since there are infinitely many possible acids, it is impossible to expect exact values for every possible molecule. Instead, ranges/values for common compounds and functional groups (and variations of those functional groups) are normally tabulated and used as approximate values. Since different sources measure and correct very high and very low pKa values differently, it is expected that different tables will have slightly different values for some of their entries. Two types of pKa tables are common. One organizes related compounds to compare the effects of structural changes (Figure 6.5). This style is more useful when used to see how pKa changes as a result of increased induction, delocalization, hybridization, etc. but may be time consuming to use if a compound with a specific pKa is sought.
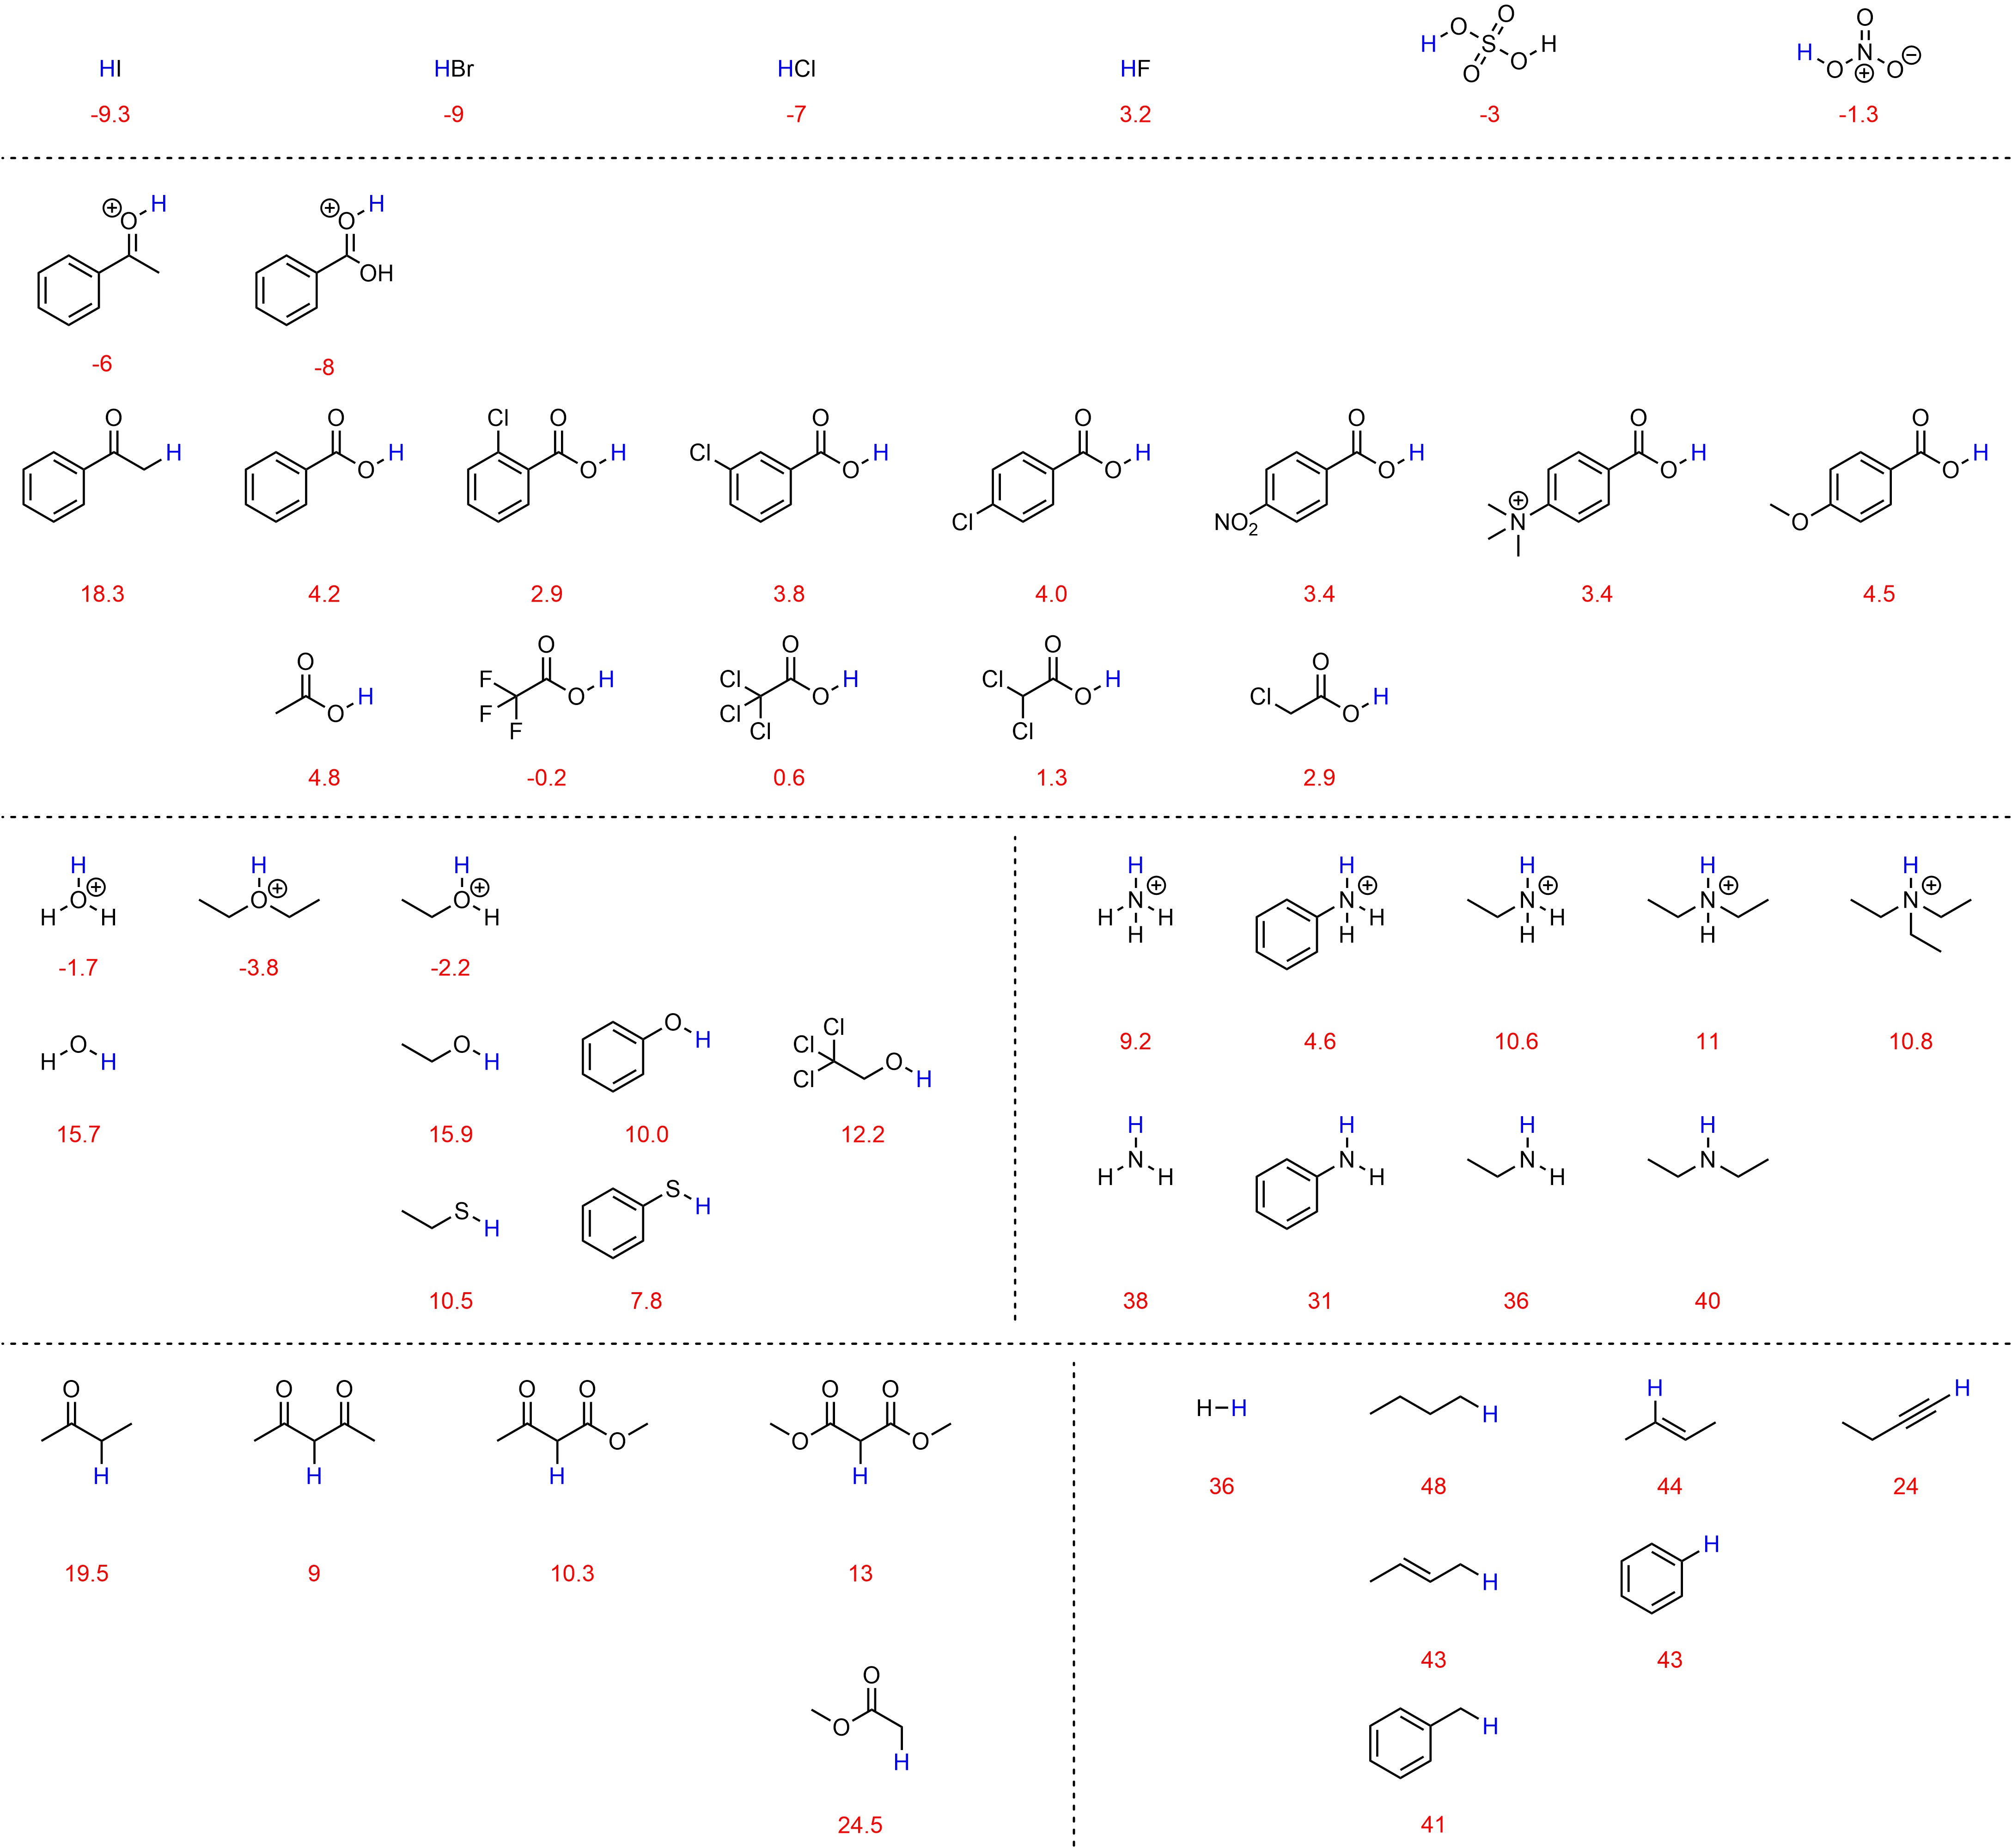
Figure 6.5 – Select pKa Values of Common Compounds.
The other common type of table lists pKa values for a set of compounds, normally sorted by the values themselves (Table 6.1). This style is more common. These tables are more useful for quickly seeing how different two acidities are but may obscure relationships if similar compounds are not close together in the table. A large array of pKa tables such as this are available freely online, often with many more examples. At an introductory level it is acceptable to use these sources, but it is important not to become confused when seeing unfamiliar functional groups or concepts.
Table 6.1 – Approximate pKa Values of Select Compounds.

a) Values obtained at 25 °C in water. Values below 0 or above ~15 are corrected values from measurements in other solvents except where noted. b) Values obtained in THF and are not corrected.
6.4.2.1. Using pKa Tables to Compare Acids
The values in pKa tables may be compared directly to determine which acid is stronger (or weaker). The acid with the lower pKa value is stronger. Acids whose pKa value falls below 0 or above ~15 should be compared only if the difference in values is reasonably large, as there is variability depending on how the values were corrected. For example, acetic acid (pKa = 4.8) is definitely less acidic than benzoic acid (pKa = 4.2), but it is less definitive whether the protons attached to the sp3 (pKa ≈ 43) or sp2 (pKa ≈ 44) carbons in but-2-ene are more acidic.
Since structure directly dictates reactivity, functional groups behave VERY similarly (often identically) in each molecule they are part of. As a result, tables may also be used qualitatively. For example, if the pKa of the alcohol of ethanol is known from the table above (pKa = 15.9) then the pKa of the alcohol of octanol is probably approximately the same value. When used in this way it is important to remember the effects that nearby structural features such as electronegative atoms or delocalization (resonance) may have on the pKa value.
6.4.2.2. Using pKa Tables to Compare Bases
The stronger the acid, the weaker the conjugate base. The weaker the acid, the stronger the conjugate base. It is possible to use pKa values to compare the relative strengths of bases using this relationship. For example, ethoxide (CH3CH2O–) and thioethoxide (CH3CH2S–) can be compared using the values from either of the tables above (Scheme 6.12).
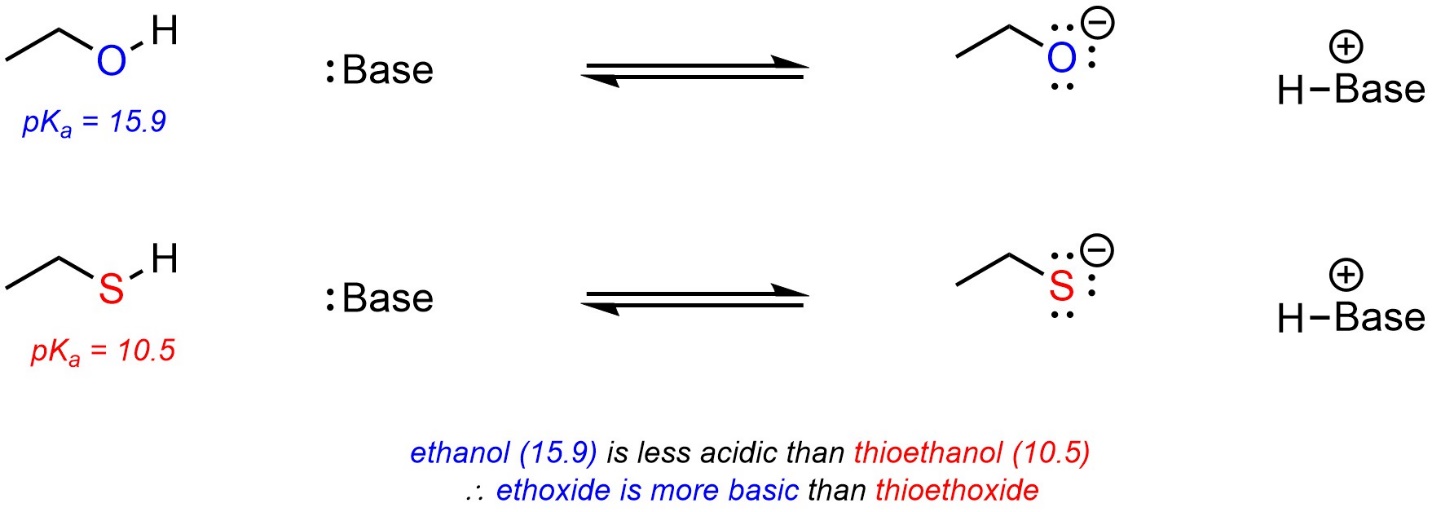
Scheme 6.12 – Example of Comparison of Basicity Using pKa Values.
6.4.2.3. Using pKa Tables to Predict Equilibria
When acid-base reactions occur they generate a new pair of compounds which are also an acid and a base (the conjugate acid and the conjugate base). Recall that most acid-base reactions are in equilibrium (reversible). If the pKa values for the two acids are known, which side of the reaction equation is favoured at equilibrium can be determined (Scheme 6.13). This can be useful for checking the validity of proposed steps during a reaction mechanism. For example, one may propose the deprotonation of ethylamine (pKa = 36) by ethoxide (ethanol pKa = 15.9). Given the ~20 unit difference in pKa, this step is likely not possible; at equilibrium only one molecule of amine in every 100,000,000,000,000,000,000 (1020) will be deprotonated.
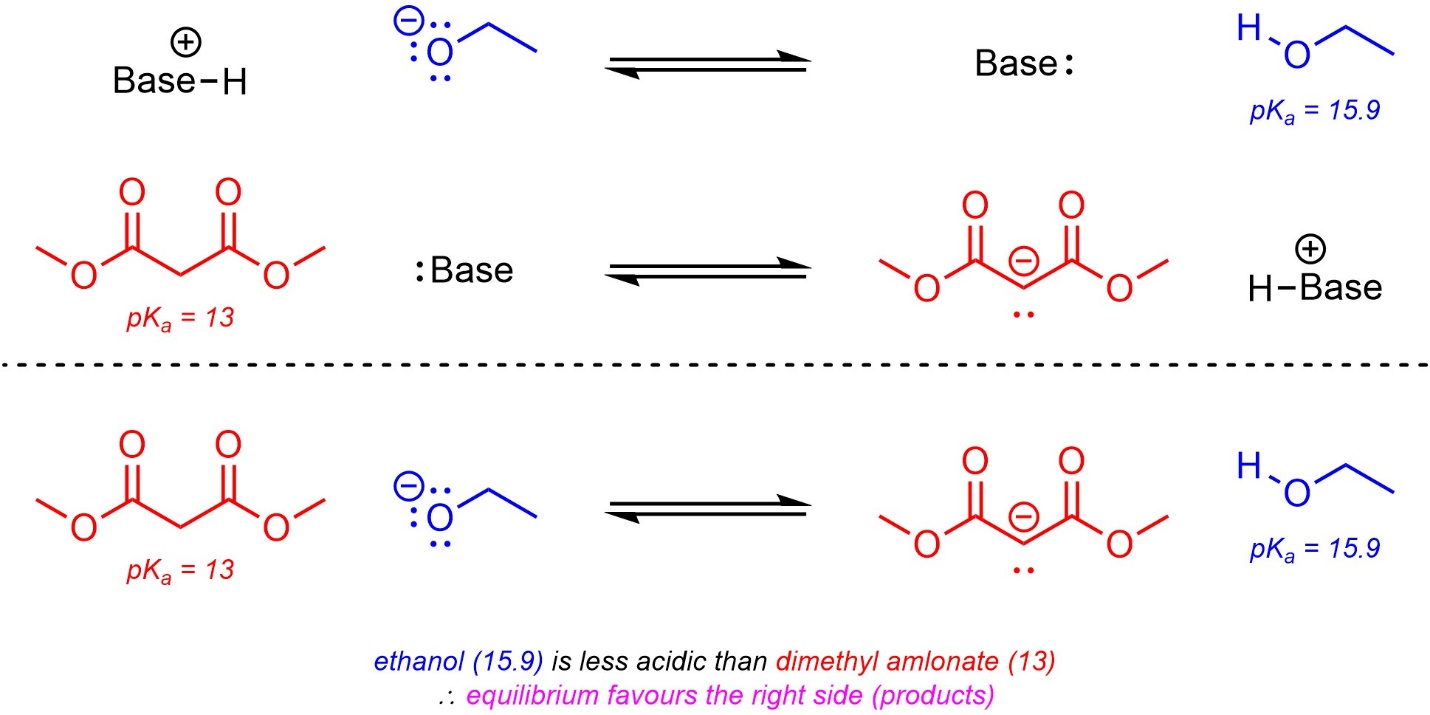
Scheme 6.13 – Example of Predicting Equilibria Using pKa Values.
6.4.2.4. How to do the Same Things Qualitatively
Qualitative comparisons of acidity (see Section 6.3) require analysis of a series of factors governing acidity. The same factors may be used to compare basicity: first compare acidity, then whichever acid is stronger has a less basic conjugate base.
It is also possible to compare (most) equilibria qualitatively using the same approach (Scheme 6.14).
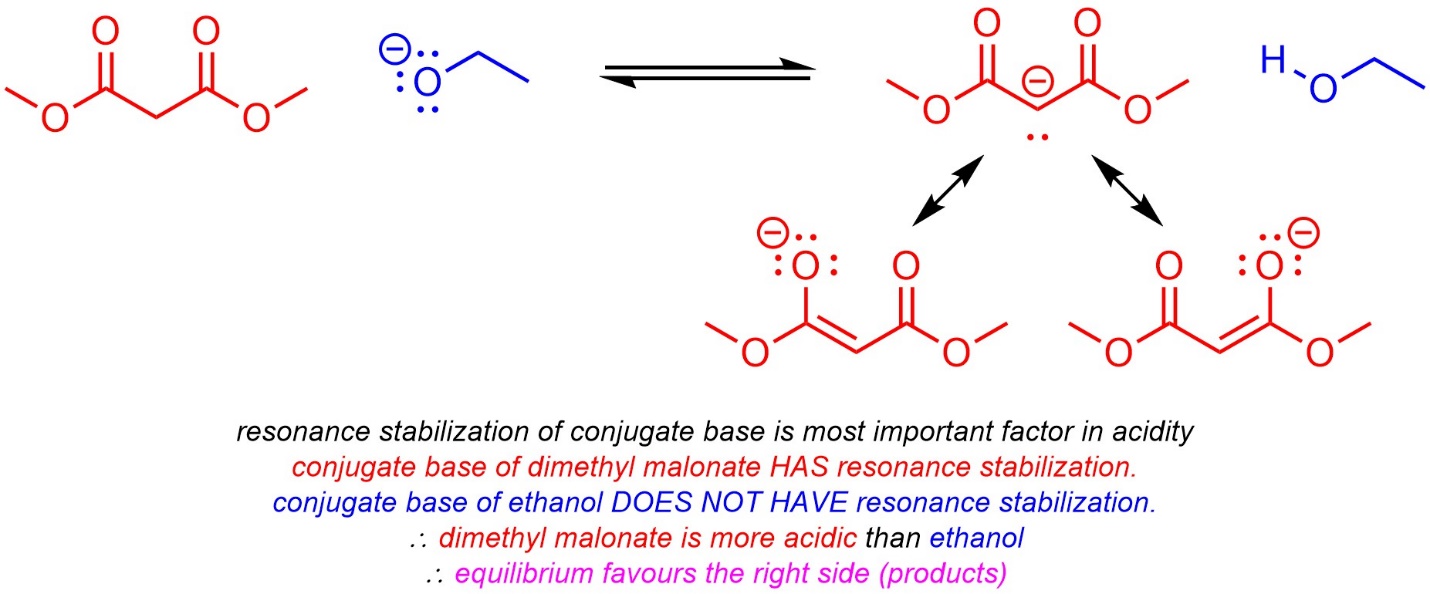
Scheme 6.14 – Example of Predicting Equilibria Qualitatively.
6.4.3. pKa and pH
In solutions where water is the solvent the pH can be measured. This is a value for how acidic the solution itself is. It is possible to use the value of pH and the pKa of an acidic compound in the solution to determine the protonation state of the compound (i.e. whether it will primarily exist as the protonated acid or as the deprotonated conjugate base).
If the pKa is lower than the pH, then the acid is more acidic than the solution. As a result, it will favour being deprotonated (exist primarily as the conjugate base). If the pH is lower than the pKa, then the solution is more acidic than the acid. As a result, it will favour being protonated (exist primarily as the acid).
The pKa values can be used directly to determine what pH ranges are appropriate to have the compound exist in a specific form. For example, to form a solution of primarily deprotonated benzoic acid (pKa = 4.2) the solution must have its pH be higher than 4.2.
Alternatively, if the pH of a solution is known the protonation state can be determined. Fundamentally, this is the same as predicting which side of a “reaction” is favoured at equilibrium (Scheme 6.15).
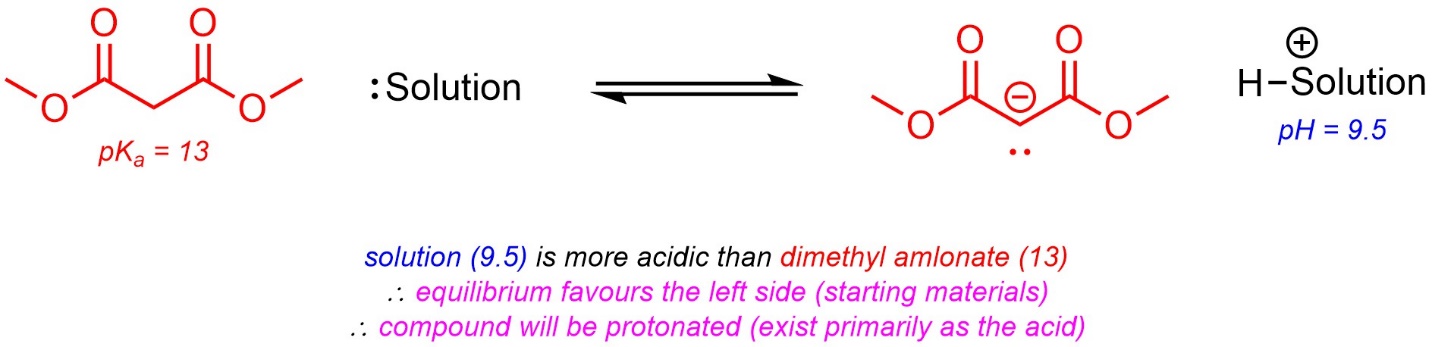
Scheme 6.15 – Example of Predicting Protonation State Using pKa and pH.
