
6. Percentiles and Quartiles
The concept of percentile[1] applies to either a data set (sample, as represented by a histogram — a discrete distribution) or to a continuous distribution (which represents a population) as shown in Figure 6.1.
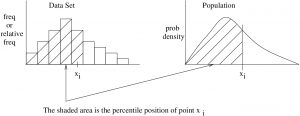
The percentile position of the data point  , denoted here by
  , is the percentage of the area under the curve up to the point
  . Notation warning : Do not confuse percentile and probability, we use
  to denote both!! (They are related though.)
To determine the percentile position for from a normal distribution of values, convert to  via the
  -transformation, determine the area under the standard normal curve up to and multiply by 100. We have, therefore, already seen how to compute given or how to compute for a given percentile . See Case 5 in Section 5.3 and remember how to use the Standard Normal Distribution Table forward and backwards.
- This percentile stuff is all about cumulative frequency or (thinking about probabilities) cumulative relative frequencies. The corresponding probability functions are called Cumulative Distribution Functions or CDFs. You will encounter CDFs in SPSS; they are mentioned later in this chapter. ↵
