
16. Non-parametric Tests
16.2 Median Sign Test
The median sign test is a test of a null hypothesis about the median, MD, of a population based on the binomial distribution. To use the test, every subject is assigned a score of  ,
,  or
or  depending on whether their data point value is greater than, the same as or less than the
  median.
Since the test is based on the binomial distribution, there are two cases we need to consider. One for small samples and one for large samples where the  approximation to the binomial distribution can be used.
Case 1 : small samples ( ). Here the test statistic is
![\[ X_{\mbox{test}} = \min [(\mbox{no. of $+$}), (\mbox{no. of $-$})] \]](https://openpress.usask.ca/app/uploads/quicklatex/quicklatex.com-88484b57d7803d991af2048971ce038b_l3.png "Rendered by QuickLaTeX.com")
and the critical statistic,  comes from the Sign Test Critical Values Table for a given
  , 1 or 2 tailed test and a value for
  where
where
![\[ n_{s} = (\mbox{no. of $+$}) + (\mbox{no. of $-$}) \]](https://openpress.usask.ca/app/uploads/quicklatex/quicklatex.com-41c82885ef38fd32d6d4a23ace7604f0_l3.png "Rendered by QuickLaTeX.com")
Reject if  .
.
Case 2 : large samples ( ). With
  as defined for case 1, the test statistic is
![\[ z_{\mbox{test}} = \frac{(X_{\mbox{test}} + 0.5) - (n/2)}{(\sqrt{n}/2)} \]](https://openpress.usask.ca/app/uploads/quicklatex/quicklatex.com-48b82dd77d895284d99c0943f2911ed0_l3.png "Rendered by QuickLaTeX.com")
where
![\[ n = (\mbox{no. of $+$}) + (\mbox{no. of $0$}) + (\mbox{no. of $-$}) \neq n_{s} \]](https://openpress.usask.ca/app/uploads/quicklatex/quicklatex.com-ce323e2367bd5621ac1c42a821ae35ab_l3.png "Rendered by QuickLaTeX.com")
the critical statistic is  obtained in the usually way using either the Standard Normal Distribution Table or (recommended) the t Distribution Table. Reject if
  is in the critical region.
There are 3 sets of hypotheses about the null hypothesis median,  :
:
| Two-tailed | Left-tailed | Right-tailed |
 |
 |
 |
 |
 |
 |
Example 16.3 (Small sample size, case 1.).
Given the following snow cone sales data :
18 43 40 16 22
30 29 32 37 36
39 34 39 45 28
36 40 34 39 52
test the conjecture that the median snow cone sales is 40.
Solution.
0. Data reduction.
Reduce the data to , and signs relative to  :
:
so (no. of ) = 3, (no. of ) = 15 and  .
.
1. Hypothesis.

2. Critical statistic.
Using the Sign Test Critical Values Table with  and
and  for a two-tailed test find
![\[ X_{\mbox{crit}} = 4 \]](https://openpress.usask.ca/app/uploads/quicklatex/quicklatex.com-1978d3b8783441ac8b9797afde2a63ab_l3.png "Rendered by QuickLaTeX.com")
3. Test statistic.
![\begin{eqnarray*} X_{\mbox{test}} & = & \min [(\mbox{no. of $+$}), (\mbox{no. of $-$})] \\ & = & \min [3,15] = 3 \end{eqnarray*}](https://openpress.usask.ca/app/uploads/quicklatex/quicklatex.com-488422a1820df545cbcd85315f0fafe8_l3.png "Rendered by QuickLaTeX.com")
4. Decision.
![\[(X_{\mbox{test}} = 3) < (X_{\mbox{crit}} = 4)\]](https://openpress.usask.ca/app/uploads/quicklatex/quicklatex.com-3ecd45856e0bc1642051f6a296010509_l3.png "Rendered by QuickLaTeX.com")
so reject .
5. Interpretation.
There is enough evidence to reject the claim that the median number of snow cone sales is 40.
▢
Example 16.4 : (Large sample size, case 2.)
We wish to test the claim that the median lifetime of manufactured rubber washers is greater than or equal to 8 years. We are given the following data from a sample of 50 washers :
- 21 washers in our sample last more than 8 years
- 29 washers in our sample last less than 8 years
- (none last exactly 8 years).
Solution.
0. Data reduction.
Label the washer that last longer than 8 years with a and the others with a . So (no. of ) = 21 and (no. of ) = 29.
1. Hypothesis
: MD  8 (claim)
 : MD
: MD  8
8
2. Critical statistic.
Using the t Distribution Table, last  line, for a one-tailed test we find
![\[ z_{\mbox{crit}} = -1.645 \]](https://openpress.usask.ca/app/uploads/quicklatex/quicklatex.com-fd4ea327a5732b51e8cf9d51d0231f68_l3.png "Rendered by QuickLaTeX.com")
3. Test statistic.
![\begin{eqnarray*} X_{\mbox{test}} & = & \min [(\mbox{no. of $+$}), (\mbox{no. of $-$})] \\ & = & \min [21,29] = 21 \end{eqnarray*}](https://openpress.usask.ca/app/uploads/quicklatex/quicklatex.com-bd6ff235529a6fbbf6b68197f07e172f_l3.png "Rendered by QuickLaTeX.com")
so

4. Decision.
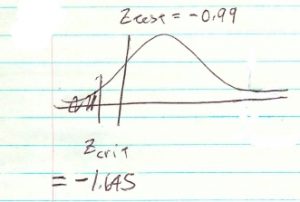
Do not reject .
5. Interpretation.
There is not enough evidence, at , to say that washers last less that 8 years.
▢
