
6. Percentiles and Quartiles
6.3 Box Plots
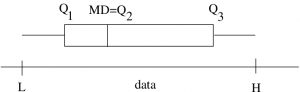
A box plot is a plot that shows  ,
,  and MD (=
  ) along with H and L (=
  and
and  ) as shown in Figure 6.3. It especially emphasizes the IQR.
Example 6.5 : Construct a box plot for the data shown in Figure 6.4. Again, someone has done the first, tedious, step of ordering the data for us.
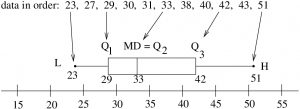
▢
Box plots can also be drawn vertically. SPSS draws box plots vertically; this is especially useful for comparing datasets.
