
10. Comparing Two Population Means
10.8 Paired t-Test
Here two measurements  and
and  are taken from every subject. We could say that we measure a vector
 ![\vec{x} = [x_{1}\; x_{2}]^{T}](https://openpress.usask.ca/app/uploads/quicklatex/quicklatex.com-ead2813c4a53b3d1a43aad370cfa2780_l3.png "Rendered by QuickLaTeX.com") as the independent variable for every subject instead of just a number as the independent variable[1]. This is a within subject design. Within subject designs tend to be more statistically powerful than independent or between subjects designs that have two completely different bunches of people for each variable. The extra power comes because we take the difference
as the independent variable for every subject instead of just a number as the independent variable[1]. This is a within subject design. Within subject designs tend to be more statistically powerful than independent or between subjects designs that have two completely different bunches of people for each variable. The extra power comes because we take the difference  for every subject. So any overall differences, or variances, in or due to individuals has been removed from the data.
The paired  -test is a univariate test. The difference between univariate and multivariate statistics is the the independent variables are numbers for univariate statistics and vectors for multivariate statistics. For the paired -test, the vector is converted to a number by taking a difference. To convert vector data to difference data, make a table :
|
|
 |
| 1 | 2 | -1 |
| 2 | 3 | -1 |
| 3 | 5 | -2 |
| 1 | -2 | 3 |
Note here that the differences in individuals are gone after we take differences  .
.
The data from the column are what you will work with. Compute  and
and  the mean and sample standard deviation of these data. With the procedure becomes a single sample -test of against zero. Specifically we can test :
| Two-tailed | Left-tailed | Right-tailed |
 |
 |
 |
 |
 |
 |
The test statistic is
![\[ t_{\rm test} = \frac{\overline{D}}{\left( s_{D}/\sqrt{n} \right)} \]](https://openpress.usask.ca/app/uploads/quicklatex/quicklatex.com-5d6b01695ae66d8dac50b3ad2974218c_l3.png "Rendered by QuickLaTeX.com")
with  (for finding
  ).
).
Example 10.7 : A Physical Education director claims that a vitamin will increase a weight lifter’s strength. Eight athletes are selected and tested on how much they can bench press. They are each tested once before taking the vitamin and again after taking the vitamin for two weeks. We want to test the director’s claim at 
The data are :
| Athlete | Before( ) ) |
After( ) ) |
 |
| 1 | 210 | 219 | -9 |
| 2 | 230 | 236 | -6 |
| 3 | 182 | 179 | 3 |
| 4 | 205 | 204 | 1 |
| 5 | 262 | 270 | -8 |
| 6 | 253 | 250 | 3 |
| 7 | 219 | 222 | -3 |
| 8 | 216 | 216 | 0 |
Here we have listed the differences which is actually part of step 0 of the solution. The and columns are what you enter into SPSS as your independent variables. With SPSS you never see the differences.
Solution :
0. Data reduction.
Compute  ,
,  by entering the difference data into your calculator.
1. Hypothesis.
![\[H_0: \mu_D\geq0 \]](https://openpress.usask.ca/app/uploads/quicklatex/quicklatex.com-f5c85adf22039200e1cbe54b5cdc0ec0_l3.png "Rendered by QuickLaTeX.com")
![\[H_1:\mu_D<0\]](https://openpress.usask.ca/app/uploads/quicklatex/quicklatex.com-e58e112aa90c09ab415a53b040327f55_l3.png "Rendered by QuickLaTeX.com")
Note that a negative difference, based on  (always consistently give population 1 priority if you want to stay out of trouble without thinking), indicates an increase in strength. It is important to interpret positive or negative differences correctly by thinking about what they mean.
2. Critical statistic.
Using the t Distribution Table with the column for one-tailed tests, , and row  , find
![\[t{\rm crit} = -1.895\]](https://openpress.usask.ca/app/uploads/quicklatex/quicklatex.com-5412dfc614f9ca0c6489df4db899ec70_l3.png "Rendered by QuickLaTeX.com")
(We added the negative sign because this is a left-tailed test.)
3. Test statistic.
![\[t_{test} = \frac{\bar{D}-\mu_D}{\left( \frac{s_D}{\sqrt{n}} \right)} = \frac{-2.375-0}{\left( \frac{4.84}{\sqrt{8}} \right)}\]](https://openpress.usask.ca/app/uploads/quicklatex/quicklatex.com-539e4cc0c6745bc6a2ddc97fa23b4105_l3.png "Rendered by QuickLaTeX.com")
![\[t_{test} = -1.388\]](https://openpress.usask.ca/app/uploads/quicklatex/quicklatex.com-f7c7641fb52e1ffa06ccee664192b5fa_l3.png "Rendered by QuickLaTeX.com")
To estimate the  -value, from the t Distribution Table,
  line, find
  .
.
4. Decision.
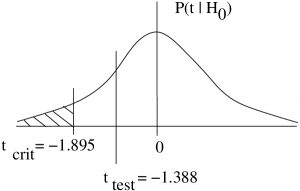
Do not reject  .
.  .
.
5. Interpretation.
Under a paired -test, at , the is not enough evidence to conclude that the vitamin increases strength.
▢
- An introduction to vectors will be given in Chapter 17. ↵
