
11. Comparing Proportions
11.1 z-Test for Comparing Proportions
In Section 9.4 we covered a one-sample test for proportions using the  approximation to the binomial distribution. Here we want to compare a proportion
  in one population with
  in another population, a two-sample test for proportions, also using the approximation to the binomial distribution. Define
![\[\hat{p}_{1} = \frac{x_{1}}{n_{1}} \mbox{\ \ \ \ and\ \ \ \ } \hat{p}_{2} = \frac{x_{2}}{n_{2}}\]](https://openpress.usask.ca/app/uploads/quicklatex/quicklatex.com-bfef26cdd232d0b1bb059d424864a4bc_l3.png "Rendered by QuickLaTeX.com")
where  and
and  are the number of items of interest in the samples from the two populations and
  and
and  are their sample sizes. Also define the corresponding
  ,
,  ,
,  and
and  . The hypotheses we want to test is
![\[ H_{0}: p_{1} = p_{2} \hspace*{3em} H_{1}: p_{1} \neq p_{2} \]](https://openpress.usask.ca/app/uploads/quicklatex/quicklatex.com-eb2e36fde54a44f85a4c75b0ab143aa3_l3.png "Rendered by QuickLaTeX.com")
which is equivalent to
![\[ H_{0}: p_{1} - p_{2} = 0 \hspace*{3em} H_{1}: p_{1} - p_{2} \neq 0 \]](https://openpress.usask.ca/app/uploads/quicklatex/quicklatex.com-ed8e16ebb3127f328334058e4d598d2c_l3.png "Rendered by QuickLaTeX.com")
If  , and
, and  are all
  then the appropriate normal distribution will provide a good approximation to the relevant binomial distribution and we can use the following test statistic to test the hypotheses
![\[ z_{\rm test} = \frac{\hat{p}_{1} - \hat{p}_{2}}{\sqrt{\bar{p}\bar{q} \left( \frac{1}{n_{1}} + \frac{1}{n_{2}} \right)}} \]](https://openpress.usask.ca/app/uploads/quicklatex/quicklatex.com-dc1f3e4de198ebd05245547504e9e99a_l3.png "Rendered by QuickLaTeX.com")
where
![\[ \bar{p} = \frac{x_{1}+x_{2}}{n_{1}+n_{2}} \hspace*{3em} \bar{q} = 1 -\bar{p} \]](https://openpress.usask.ca/app/uploads/quicklatex/quicklatex.com-d9bdfee7c783848183ad4b1ec54e1ece_l3.png "Rendered by QuickLaTeX.com")
are the proportions of items of interest and not of interest in the two samples combined.
Example 11.1 : In a nursing home study we are interested in the proportions of nursing homes that have vaccination rates of less than 80 . The two populations we want to compare are small nursing homes and large nursing homes. In a sample of 34 small nursing homes, 12 were found to have a vaccination rate of less than 80. In a sample of 24 large nursing homes, 17 were found to have a vaccination rate of less than 80. At
  is there a difference in the proportions of small and large nursing homes with vaccination rates of less than 80?
Solution :
0. Data reduction.
First define: population 1 = small nursing homes and population 2 = large nursing homes. Then compute the proportions:
![\[ \hat{p}_{1} = \frac{x_{1}}{n_{1}} = \frac{12}{34} = 0.35 \hspace{4em} \hat{p}_{2} = \frac{x_{2}}{n_{2}} = \frac{17}{24} = 0.71 \]](https://openpress.usask.ca/app/uploads/quicklatex/quicklatex.com-c4e57b0264d4b2f3ad2d36687da03145_l3.png "Rendered by QuickLaTeX.com")
![\[ \bar{p} = \frac{x_{1} + x_{2}}{n_{1} + n_{2}} = \frac{12+17}{34+24} = \frac{29}{58} = 0.5 \hspace{4em} \bar{q} = 1 - \bar{p} = 1 - 0.5 = 0.5 \]](https://openpress.usask.ca/app/uploads/quicklatex/quicklatex.com-58263f9c0fde65060fa0bc554d97514e_l3.png "Rendered by QuickLaTeX.com")
1. Hypotheses.
![\[H_{0}: p_{1} = p_{2} \hspace*{3em} H_{1}: p_{1} \neq p_{2}\]](https://openpress.usask.ca/app/uploads/quicklatex/quicklatex.com-243bc4a4955b87c6395e8db4bfe7eb36_l3.png "Rendered by QuickLaTeX.com")
2. Critical statistic.
Use Table F, the last () line in the column for a two-tailed test at : 
3. Test statistic.

4. Decision.
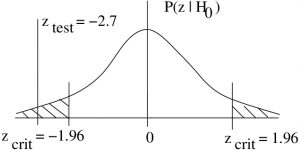
Reject  .
.
5. Interpretation.
There is enough evidence, from a proportions test at to support the observation that large nursing homes have worse vaccination rates than small nursing homes. Make sure your parents end up in a small nursing home. (Note that rejection of in a one-tail test allows us to believe the direction of difference given by the sample data.)
▢
