
14. Correlation and Regression
14.11 SPSS Lesson 12: Multiple Regression
Open “Hypertension.sav” from the Data Sets: It is very similar to the data file we used for demonstrating simple linear regression in SPSS but now we have more variables to choose from for independent variables. As before, we really should combine the strength variables but we’ll pick  and
and  . Let’s pick age as a second independent variable,
  . Pick Analyze → Regression → Linear and enter the independent and dependent variables :
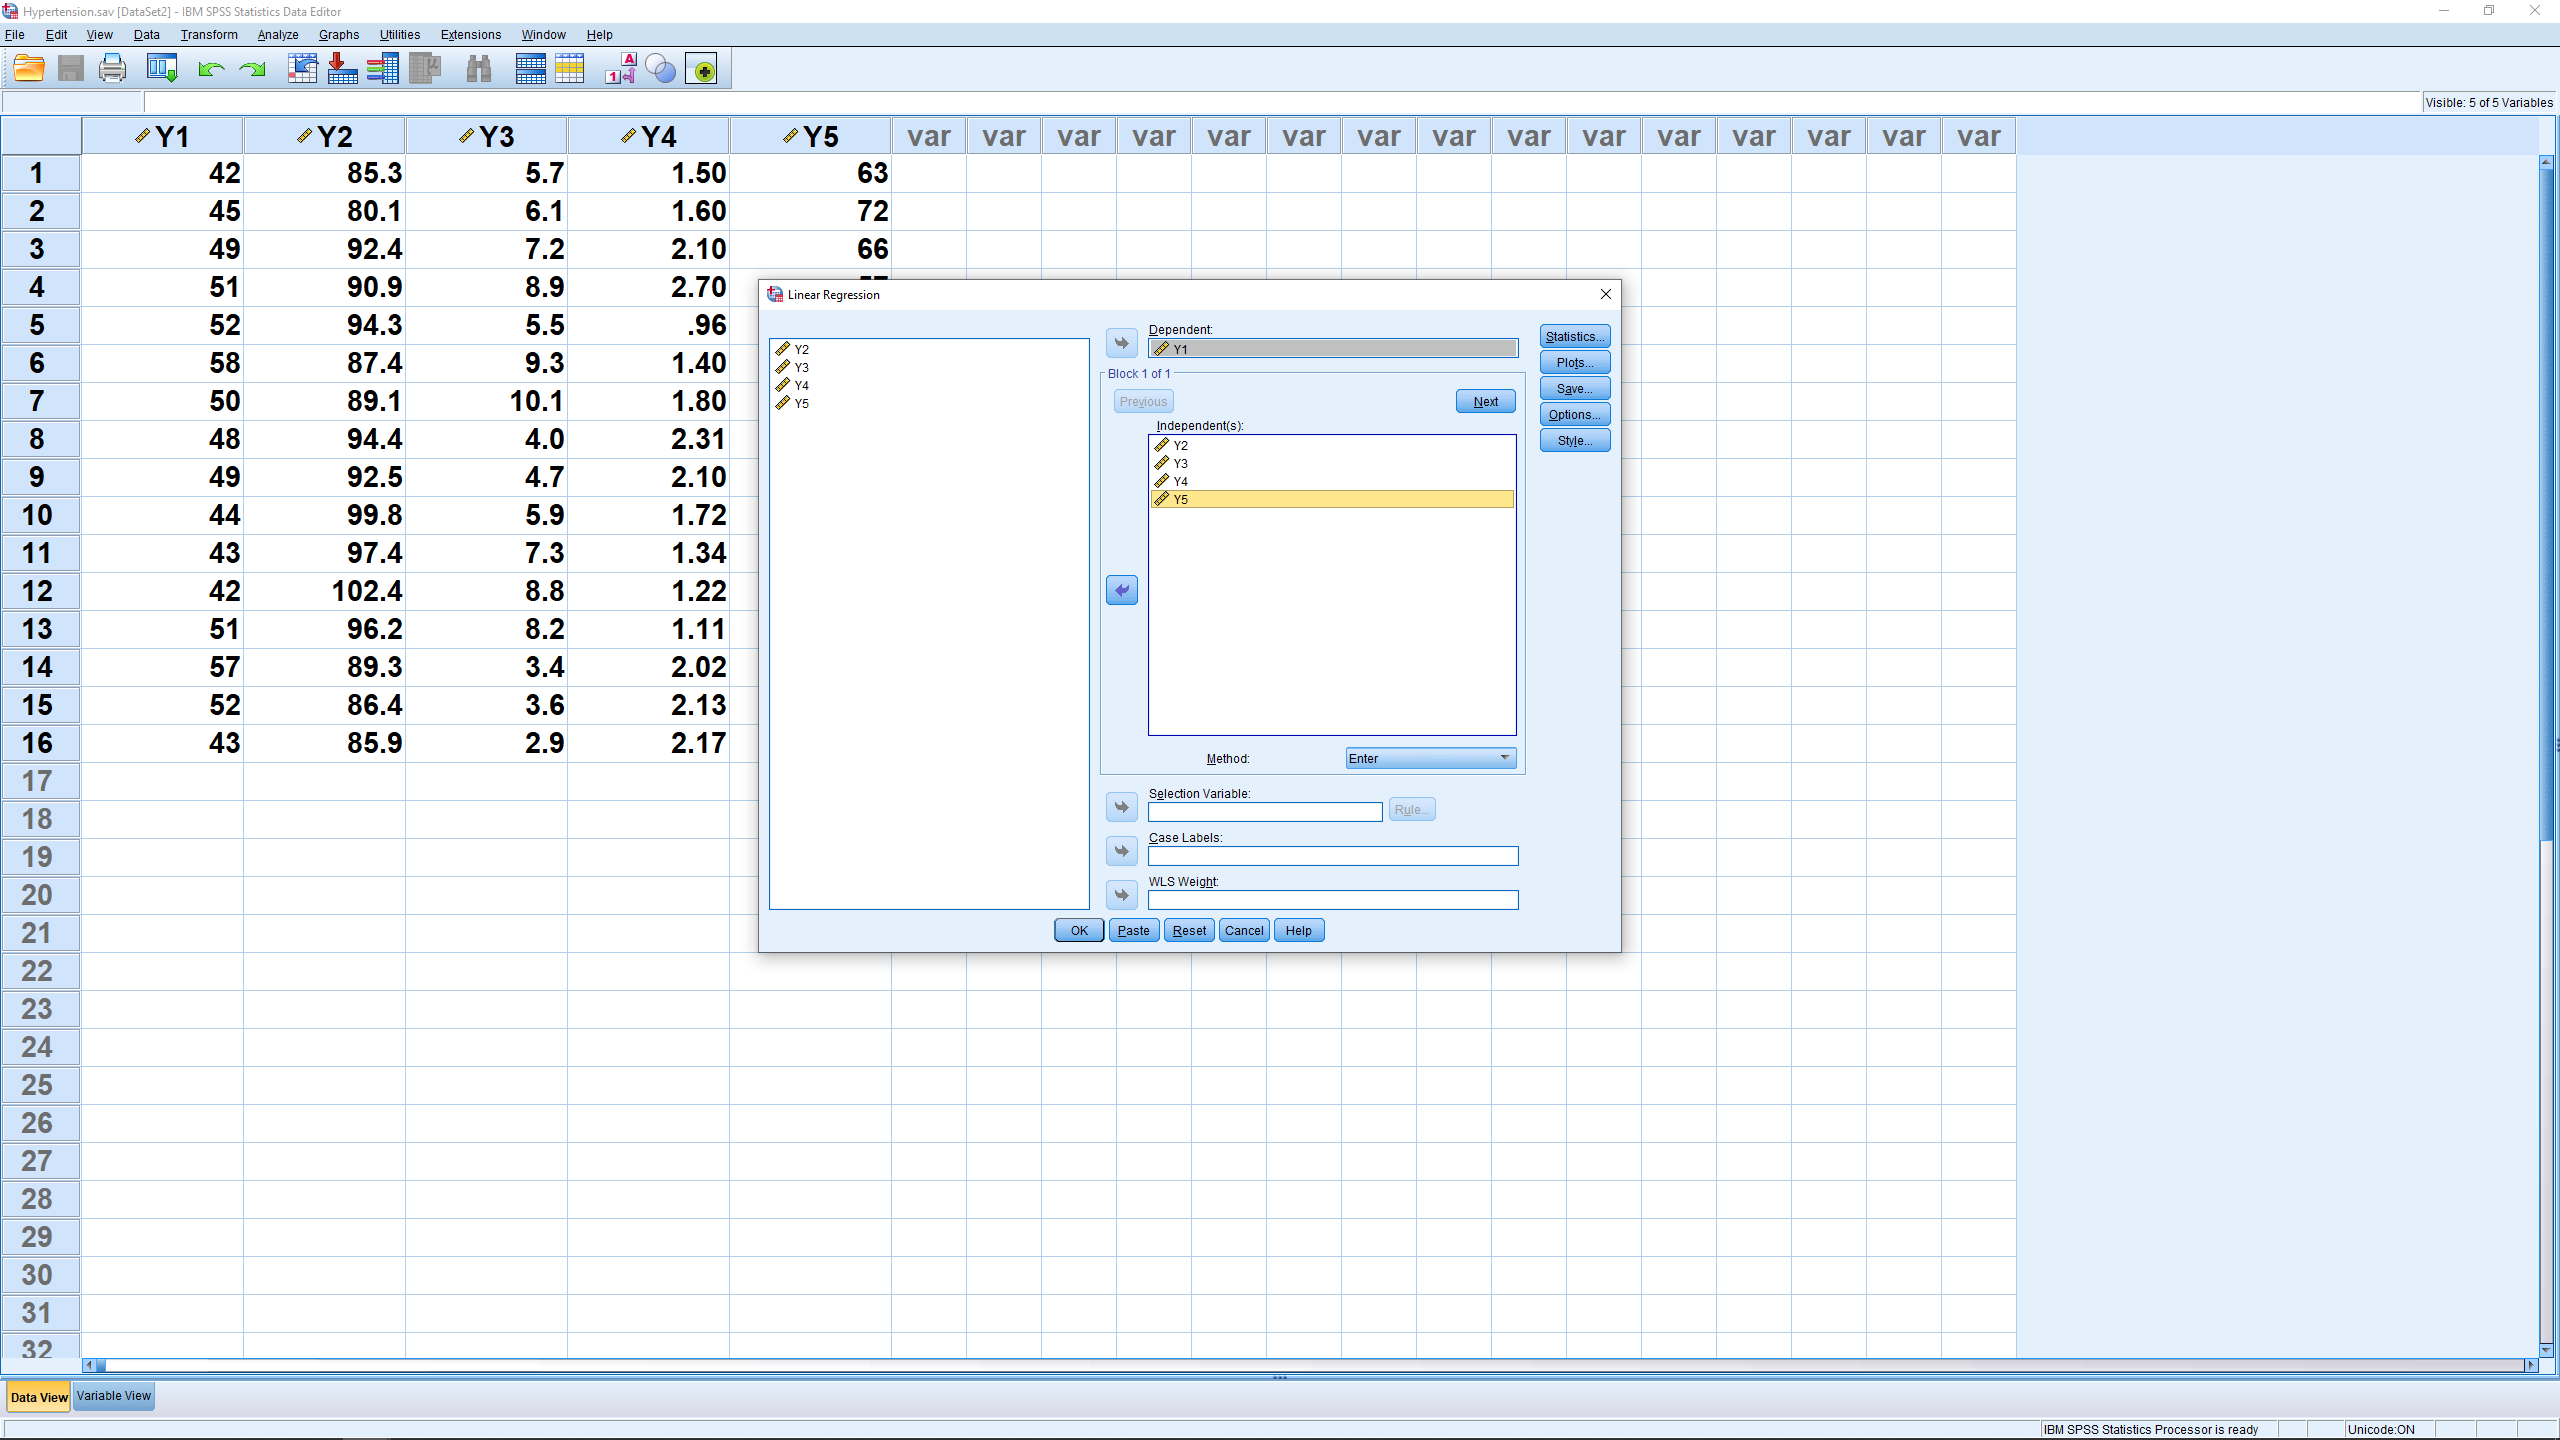
We will again ignore the submenus but note this time that they are to set up what is known as step-up and step-down analysis where independent variables are added or removed in an attempt to get a better fitting model by removing independent variables that are correlated with each other. The relevant output is (ignoring the table meant for step-up and step-down analysis) :
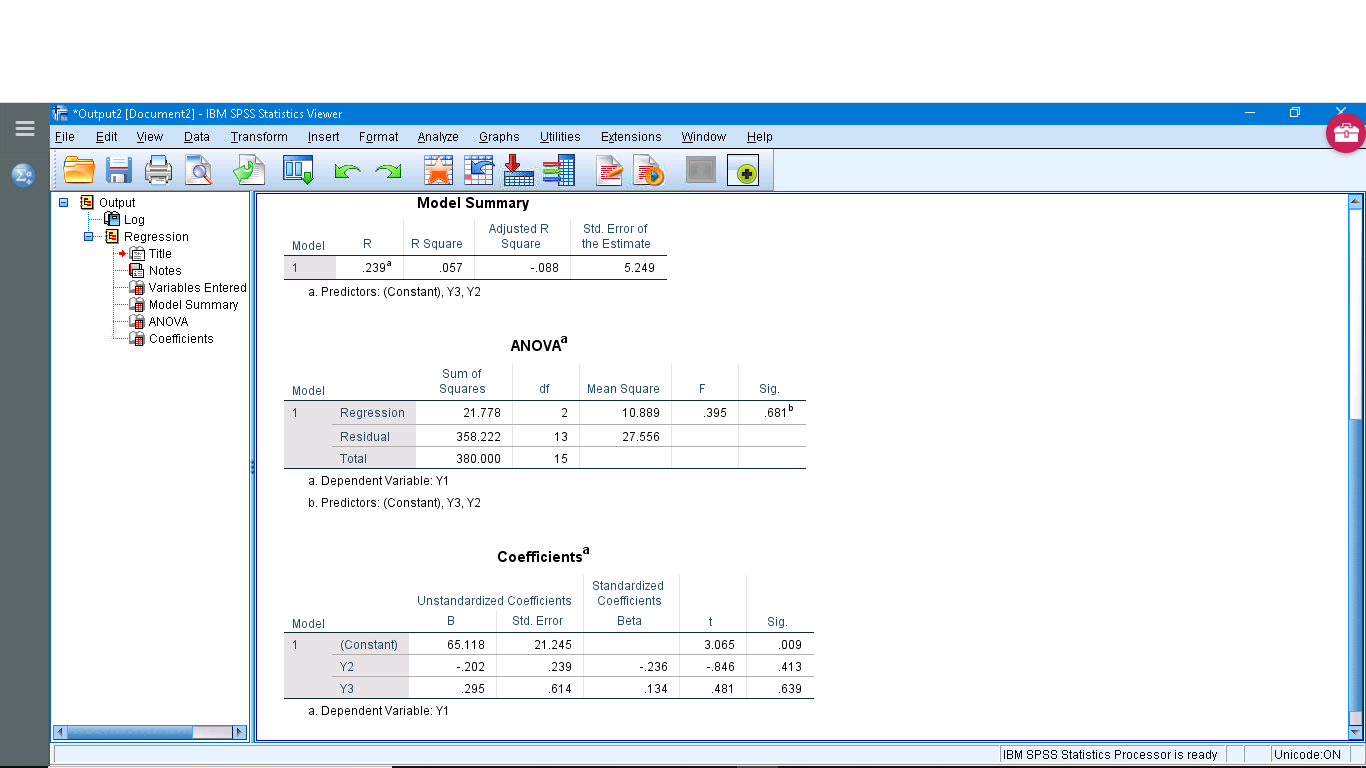
The “Model Summary” table gives  ,
,  (here the model explains 5.7
 of the variance of
  ),
),  and
and  for multiple regression which we did not look at explicitly for multiple regression. The “ANOVA” table gives the test statistic
  for the significance of along with its
  value, which is not significant here. Again, note that this is not the we looked at in Section 14.10.2, notice the drastic difference in the degrees of freedom between for the two values. But both do test the significance of the overall . The models given by the “Coefficients” table are :

Note that the intercept is significant but the two slopes are not. If the variables were  -transformed first then we’d have:

There is no way to get SPSS to plot the best fit plane through 3D scatterplot data.
