
16. Non-parametric Tests
16.6 Kruskal-Wallis Test (H Test)
The Kruskal-Wallis Test is a non-parametric one-way ANOVA. It detects differences in means between groups. The distribution behind the test is a new discrete distribution called the  distribution that assumes the group samples come from populations with identically shaped distributions. We will use a
  approximation of for computing the critical statistic so, for that approximation, we need
  for
for  , where
  is the number of groups. The hypothesis tested is :
 : means of groups all equal
 : means of groups not all equal
As mentioned, the critical statistic is  with
with  degrees of freedom which we can find using the Chi Squared Distribution Table.
The test statistic is :
![\[ H = \frac{12}{N(N+1)} \left[ \sum_{i=1}^{k} \frac{R_{i}^{2}}{n_{i}} \right] - 3(N+1) \]](https://openpress.usask.ca/app/uploads/quicklatex/quicklatex.com-82e798922cd2df85aadc57122d60c03d_l3.png "Rendered by QuickLaTeX.com")
where

The test is always right-tailed.
Example 16.8 : With the following data on ml of potassium/quart in brands of drink, determine if there is a significant difference in the potassium content between brands.
| Brand A | Brand B | Brand C |
| 4.7 | 5.3 | 6.3 |
| 3.2 | 6.4 | 8.2 |
| 5.1 | 7.3 | 6.2 |
| 5.2 | 6.8 | 7.1 |
| 5.0 | 7.2 | 6.6 |
0. Data reduction.
We need to rank the data. Ranking “in place” we have :
| Brand (IV) | DV | Rank |
| A | 4.7 | 2 |
| A | 3.2 | 1 |
| A | 5.1 | 4 |
| A | 5.2 | 5 |
| A | 5.0 | 3 |
| B | 5.3 | 6 |
| B | 6.4 | 9 |
| B | 7.3 | 14 |
| B | 6.8 | 11 |
| B | 7.2 | 13 |
| C | 6.3 | 8 |
| C | 8.2 | 15 |
| C | 6.2 | 7 |
| C | 7.1 | 12 |
| C | 6.6 | 10 |
Using A = 1, B = 2, c = 3, the sums of the ranks for each group are

Finally note that  and
and  .
.
1. Hypothesis.
: no differences in means between the brands
: some differences exist
2. Critical statistic.
From the Chi Squared Distribution Table with  ,
,  find
find
![\[ \chi^{2}_{\mbox{crit}} = 5.991 \]](https://openpress.usask.ca/app/uploads/quicklatex/quicklatex.com-4e21fc04013ec7370beb15f1779595f8_l3.png "Rendered by QuickLaTeX.com")
3. Test statistic.
![\begin{eqnarray*} H & = & \frac{12}{N(N+1)} \left[ \sum_{i=1}^{k} \frac{R_{i}^{2}}{n_{i}} \right] - 3(N+1) \\ & = & \frac{12}{15(16)} \left[ \frac{15^{2}}{5} + \frac{53^{2}}{5} + \frac{52^{2}}{5} \right] - 3(16) \\ & = & 9.38 \end{eqnarray*}](https://openpress.usask.ca/app/uploads/quicklatex/quicklatex.com-620477edfde356e95fc69c5bcbadebbb_l3.png "Rendered by QuickLaTeX.com")
4. Decision.
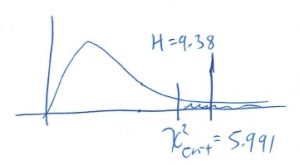
Reject .
5. Interpretation.
At least one of the brands is different. Since  is far less than the rank sums of the other two brands, we know that Brand A is different before we do any kind of post hoc testing.
▢
