
6. Percentiles and Quartiles
6.5 SPSS Lesson 4: Percentiles
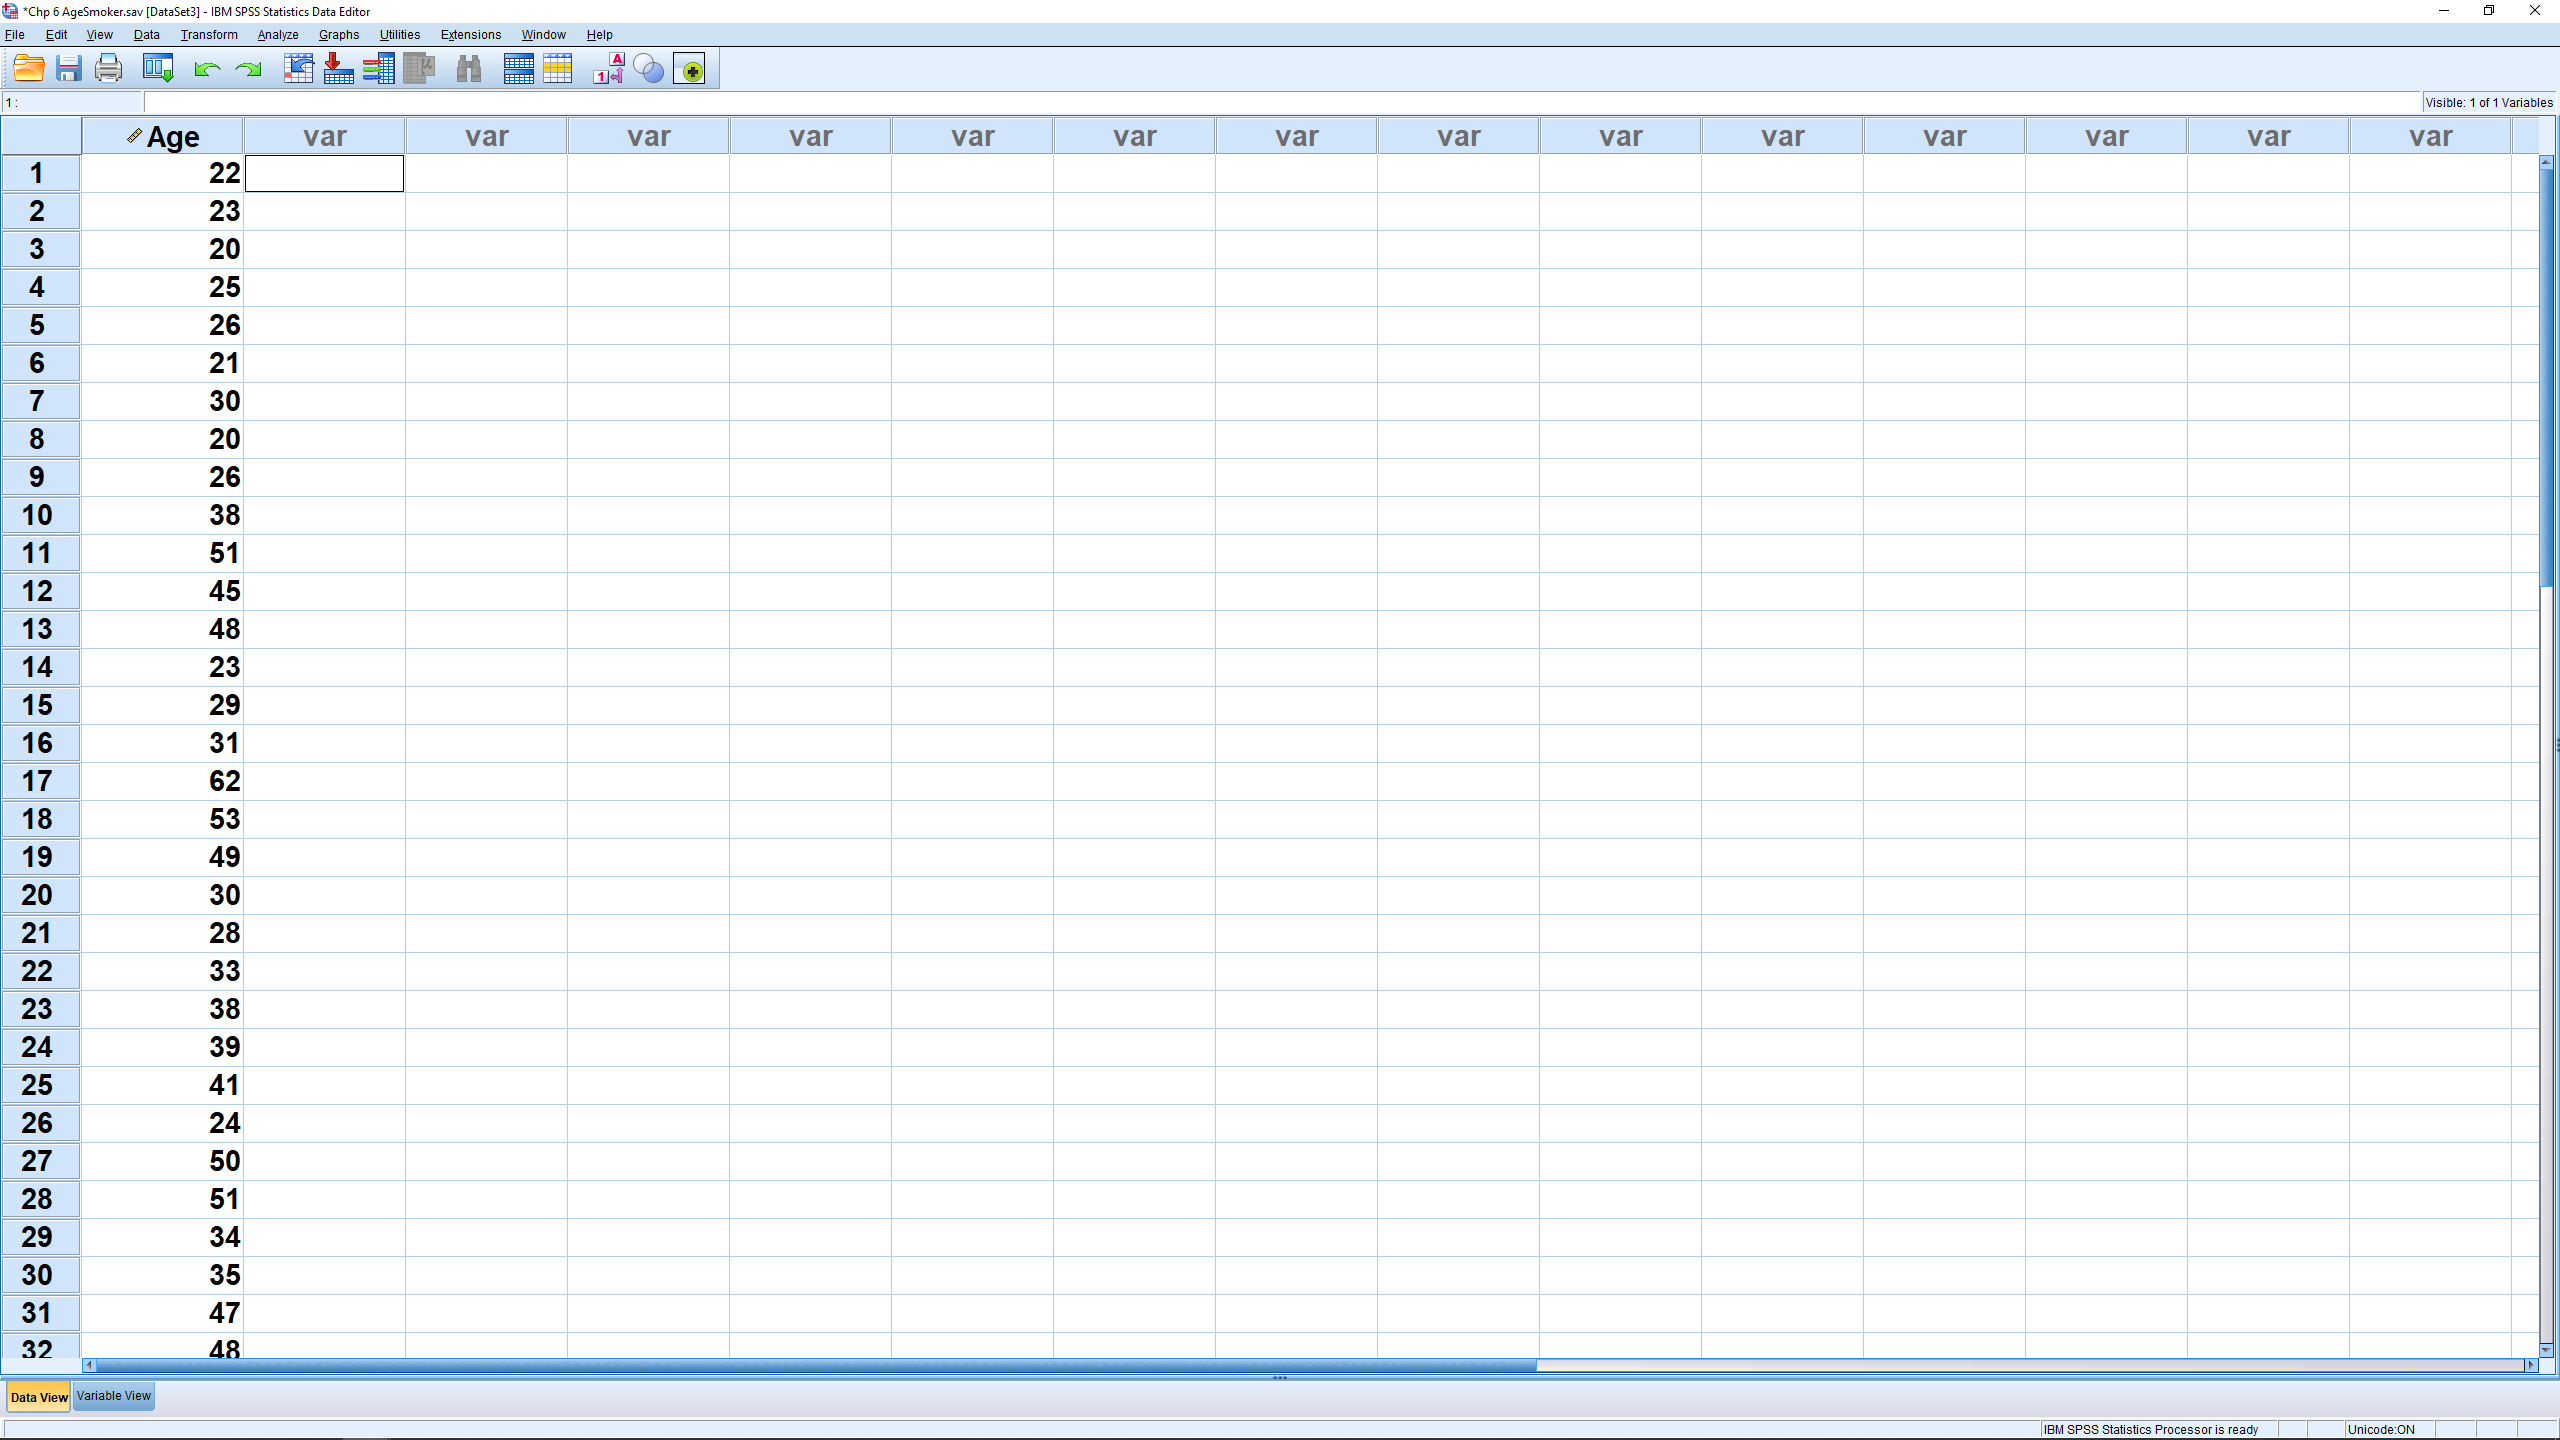
To follow along, load in the file “AgeSmoker.sav” from the Data Sets. We will pick on the variable Age. We will compute the percentile rank of each value in the Age dataset two ways. One way, we will treat the data as a discrete data set and will compute the percentile position following Equation 6.1. The other way, we will treat the data as if they came from a normal population.
First, treat the data as a stand alone discrete data set. First we need to rank the data; the ranks are the values  in Equation 6.1. Use Transform
  Rank Cases :

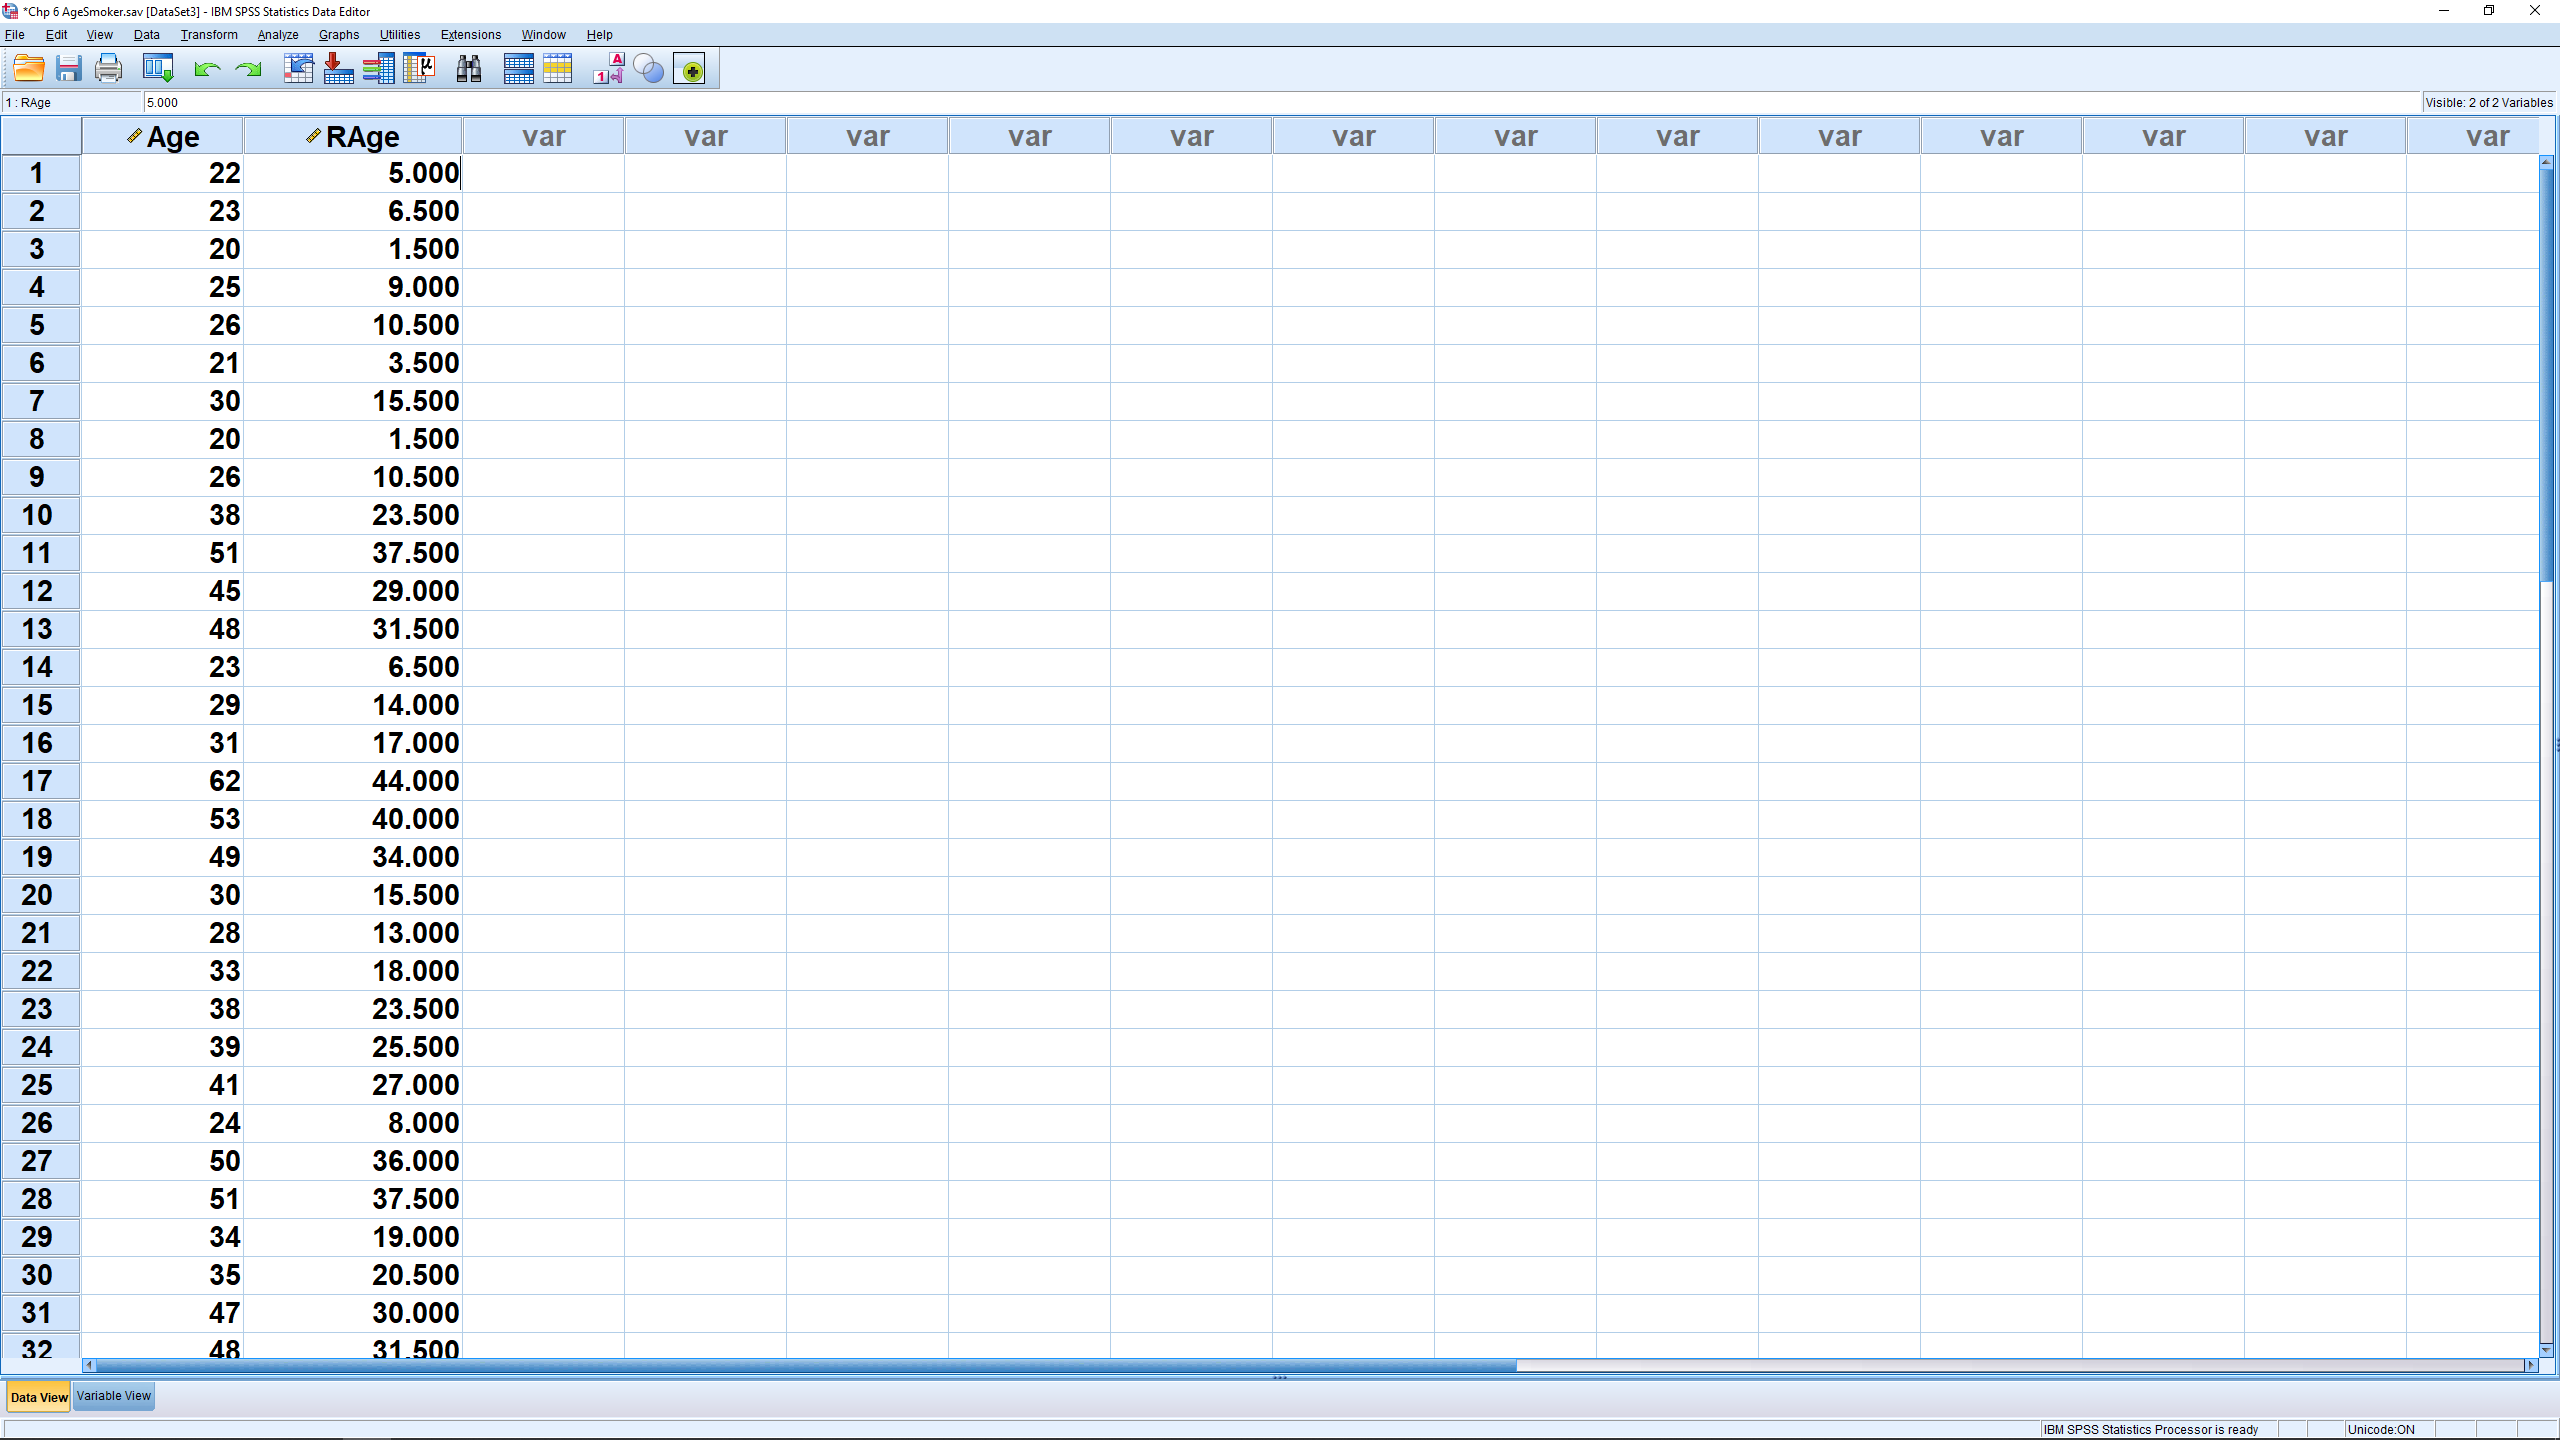
This produces the ranking variable RAge, visible in the Data View window.
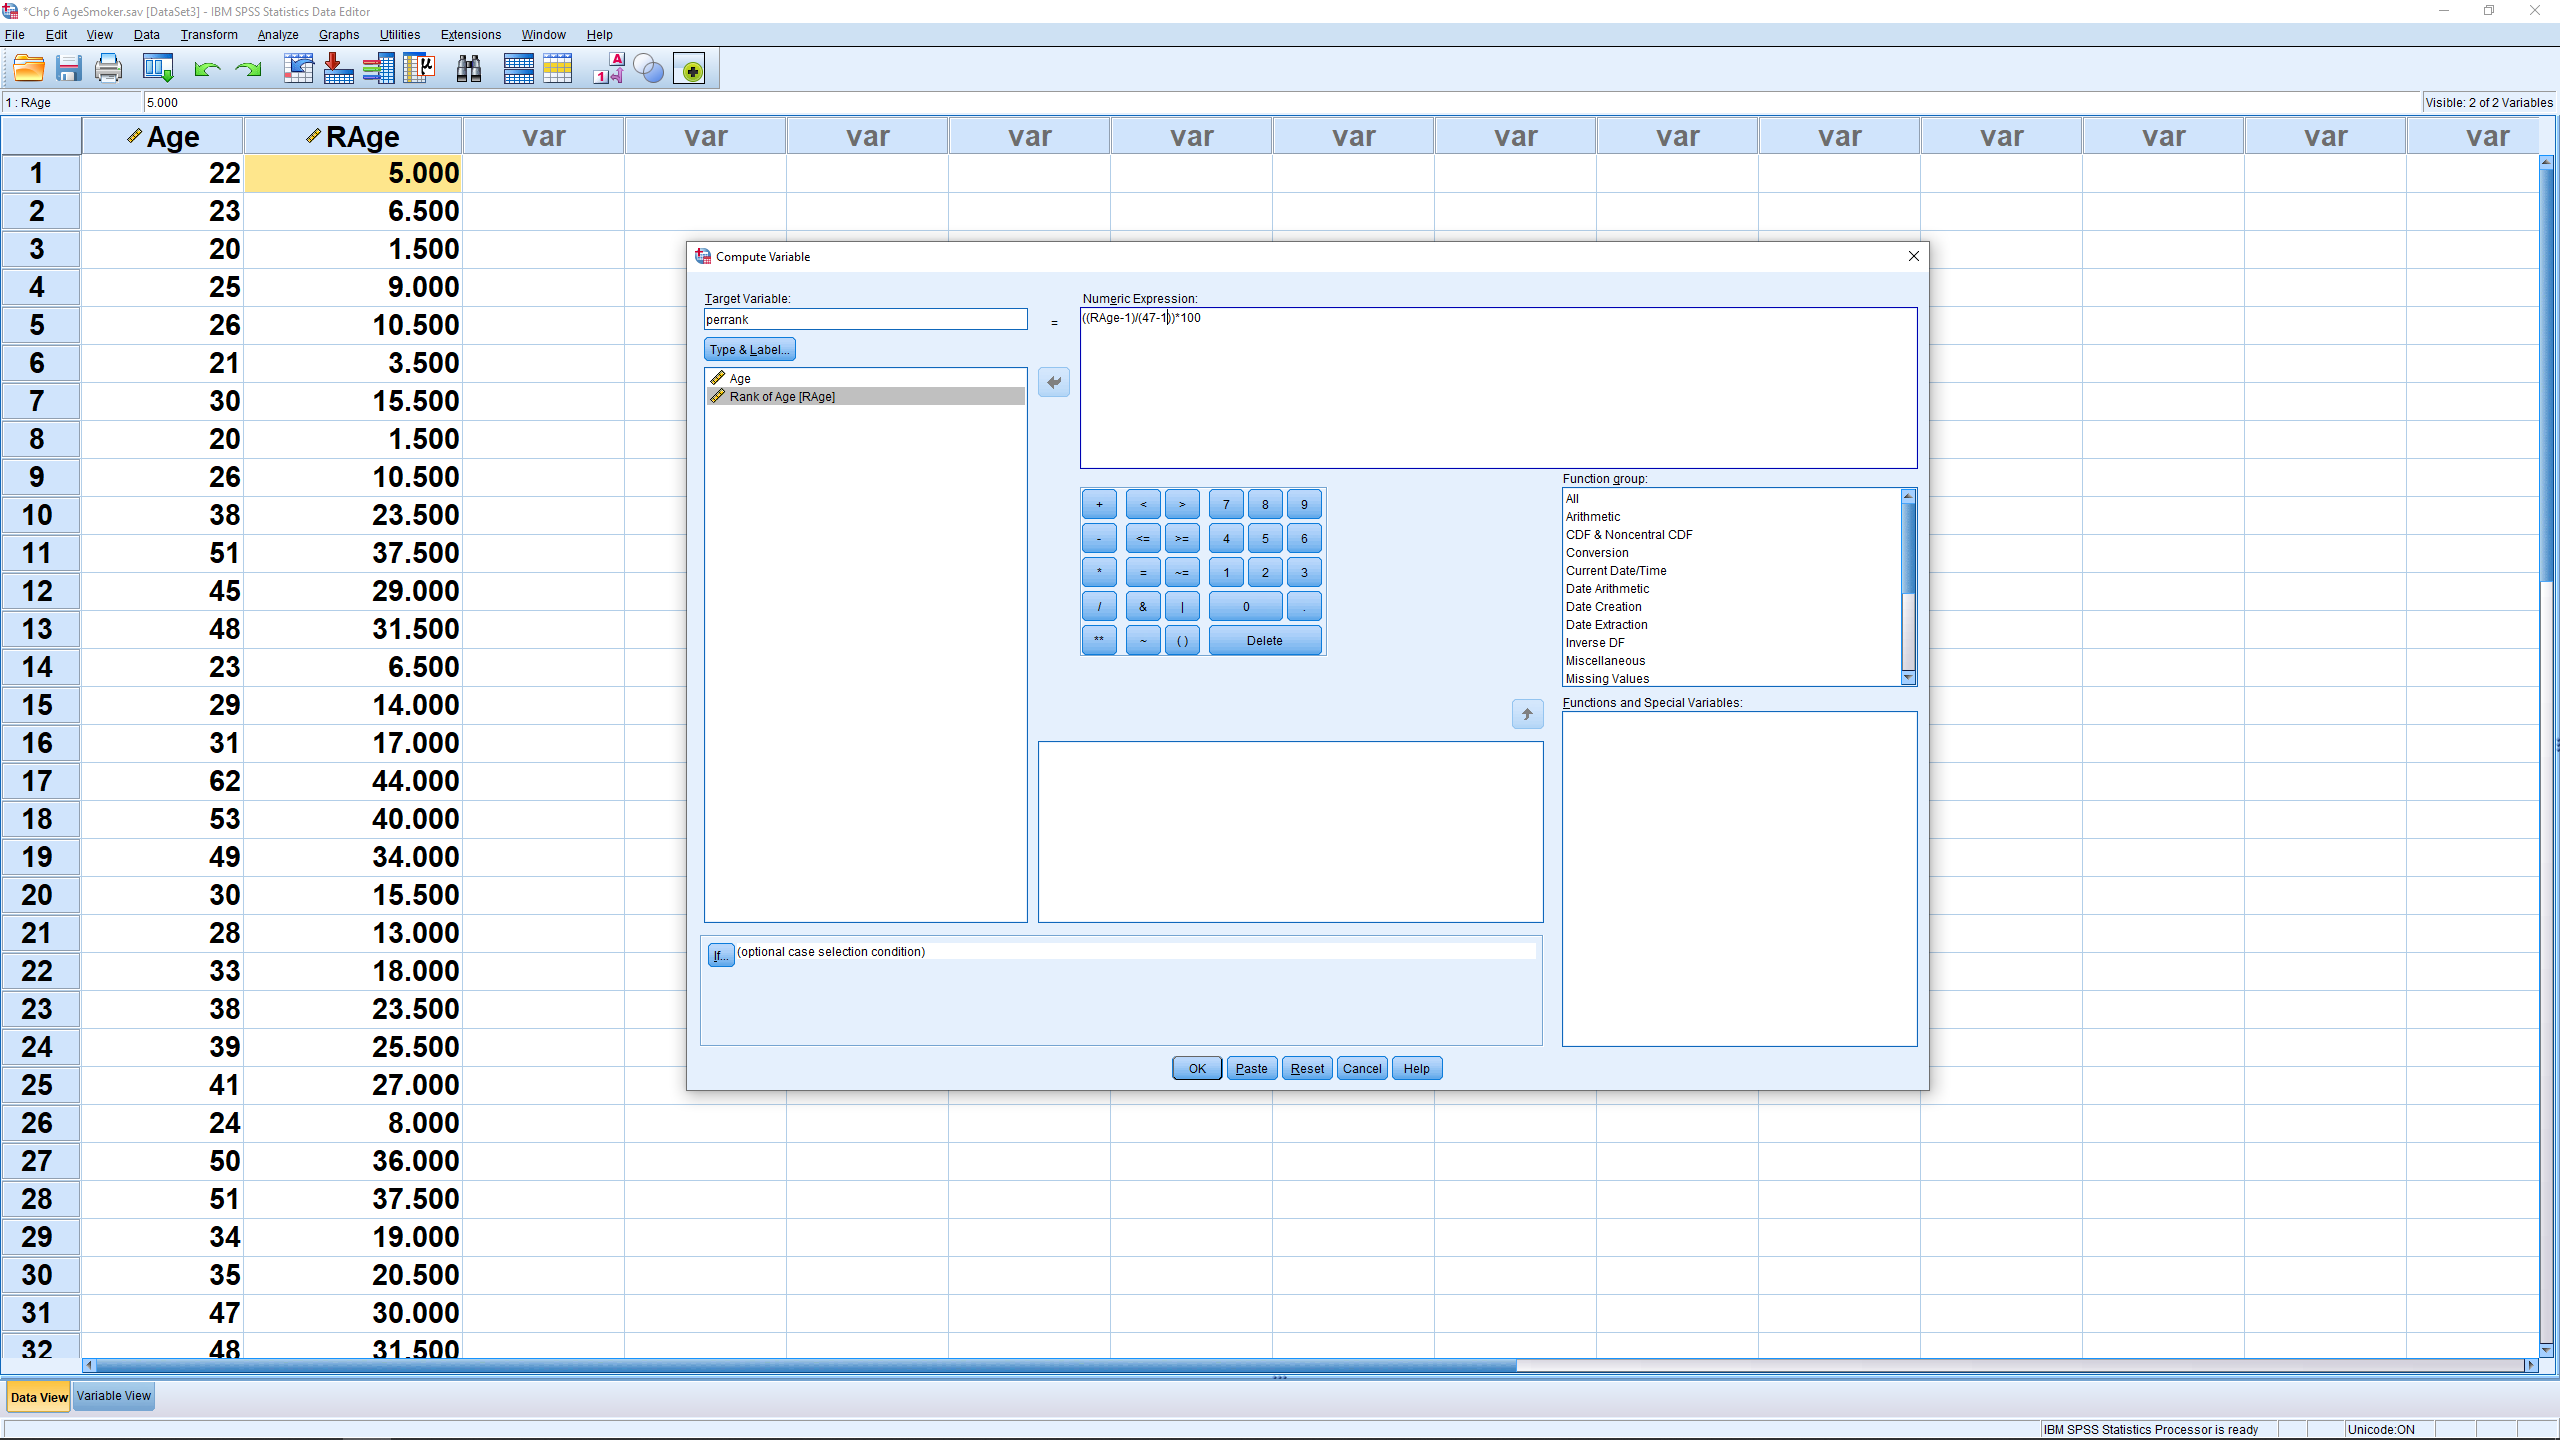
Now use that ranking variable in Equation 6.1 by pulling up Transform Compute Variable :
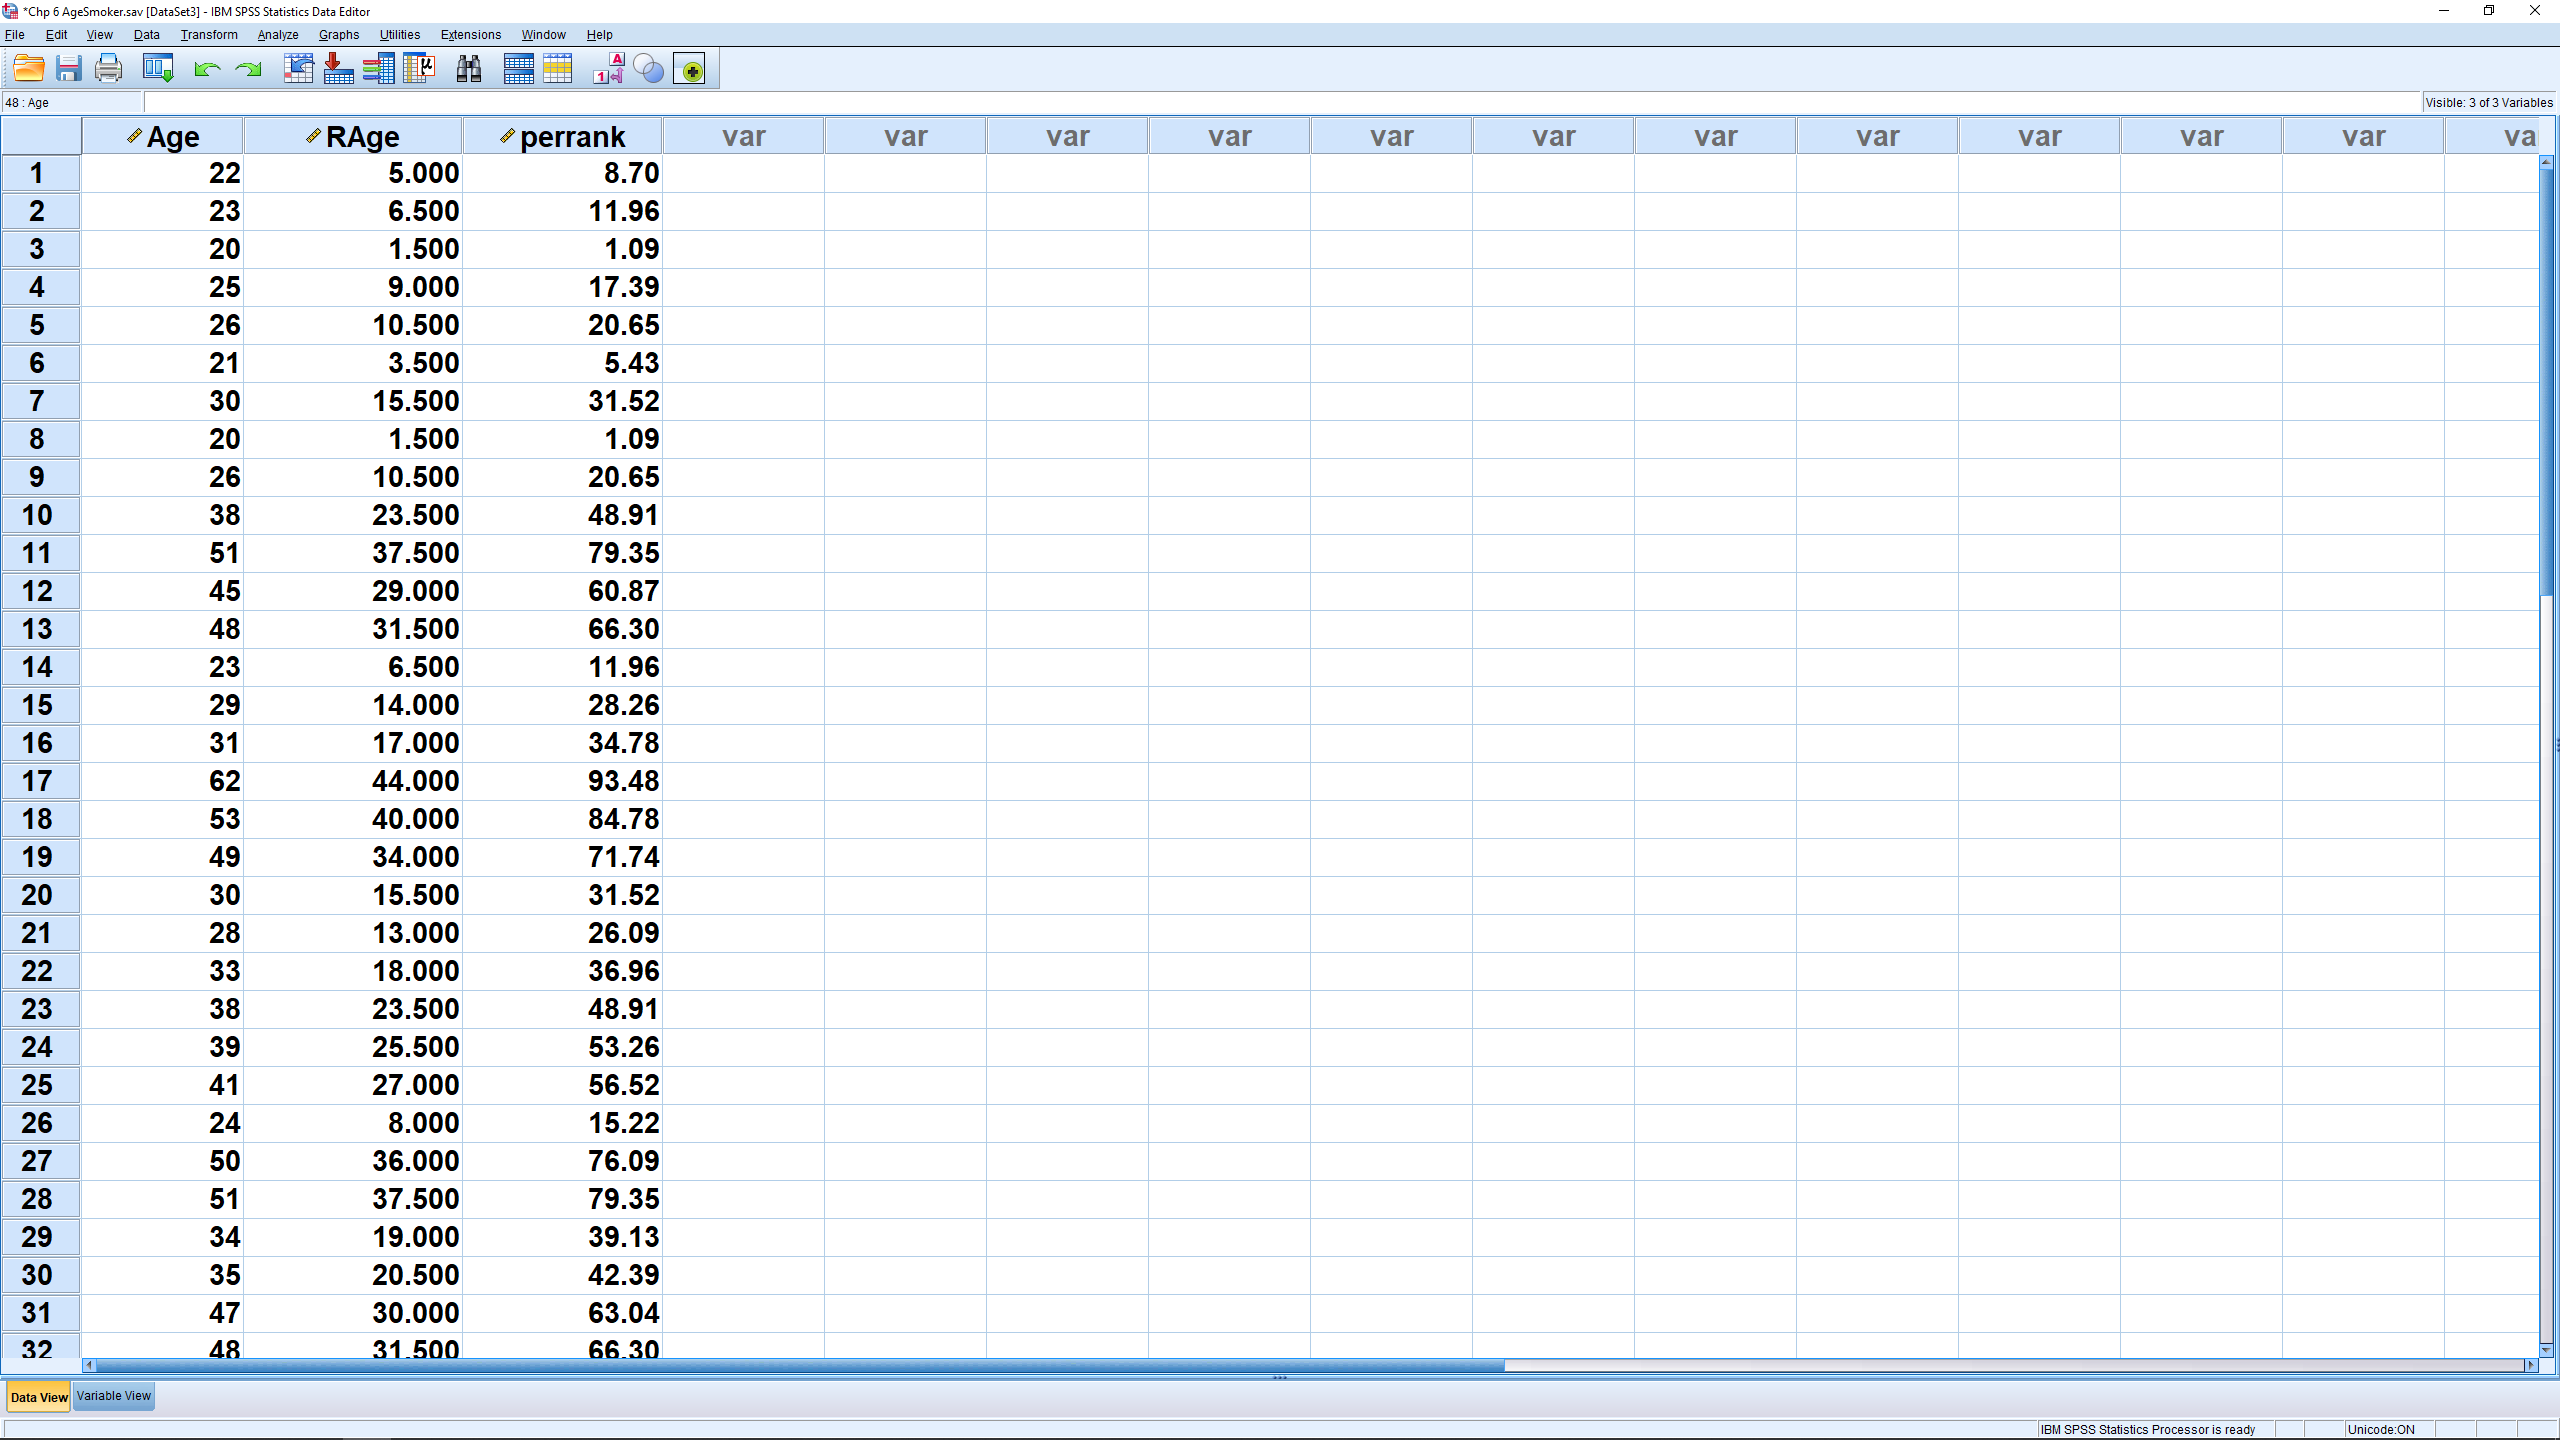
The result, in the Data View window, looks like :
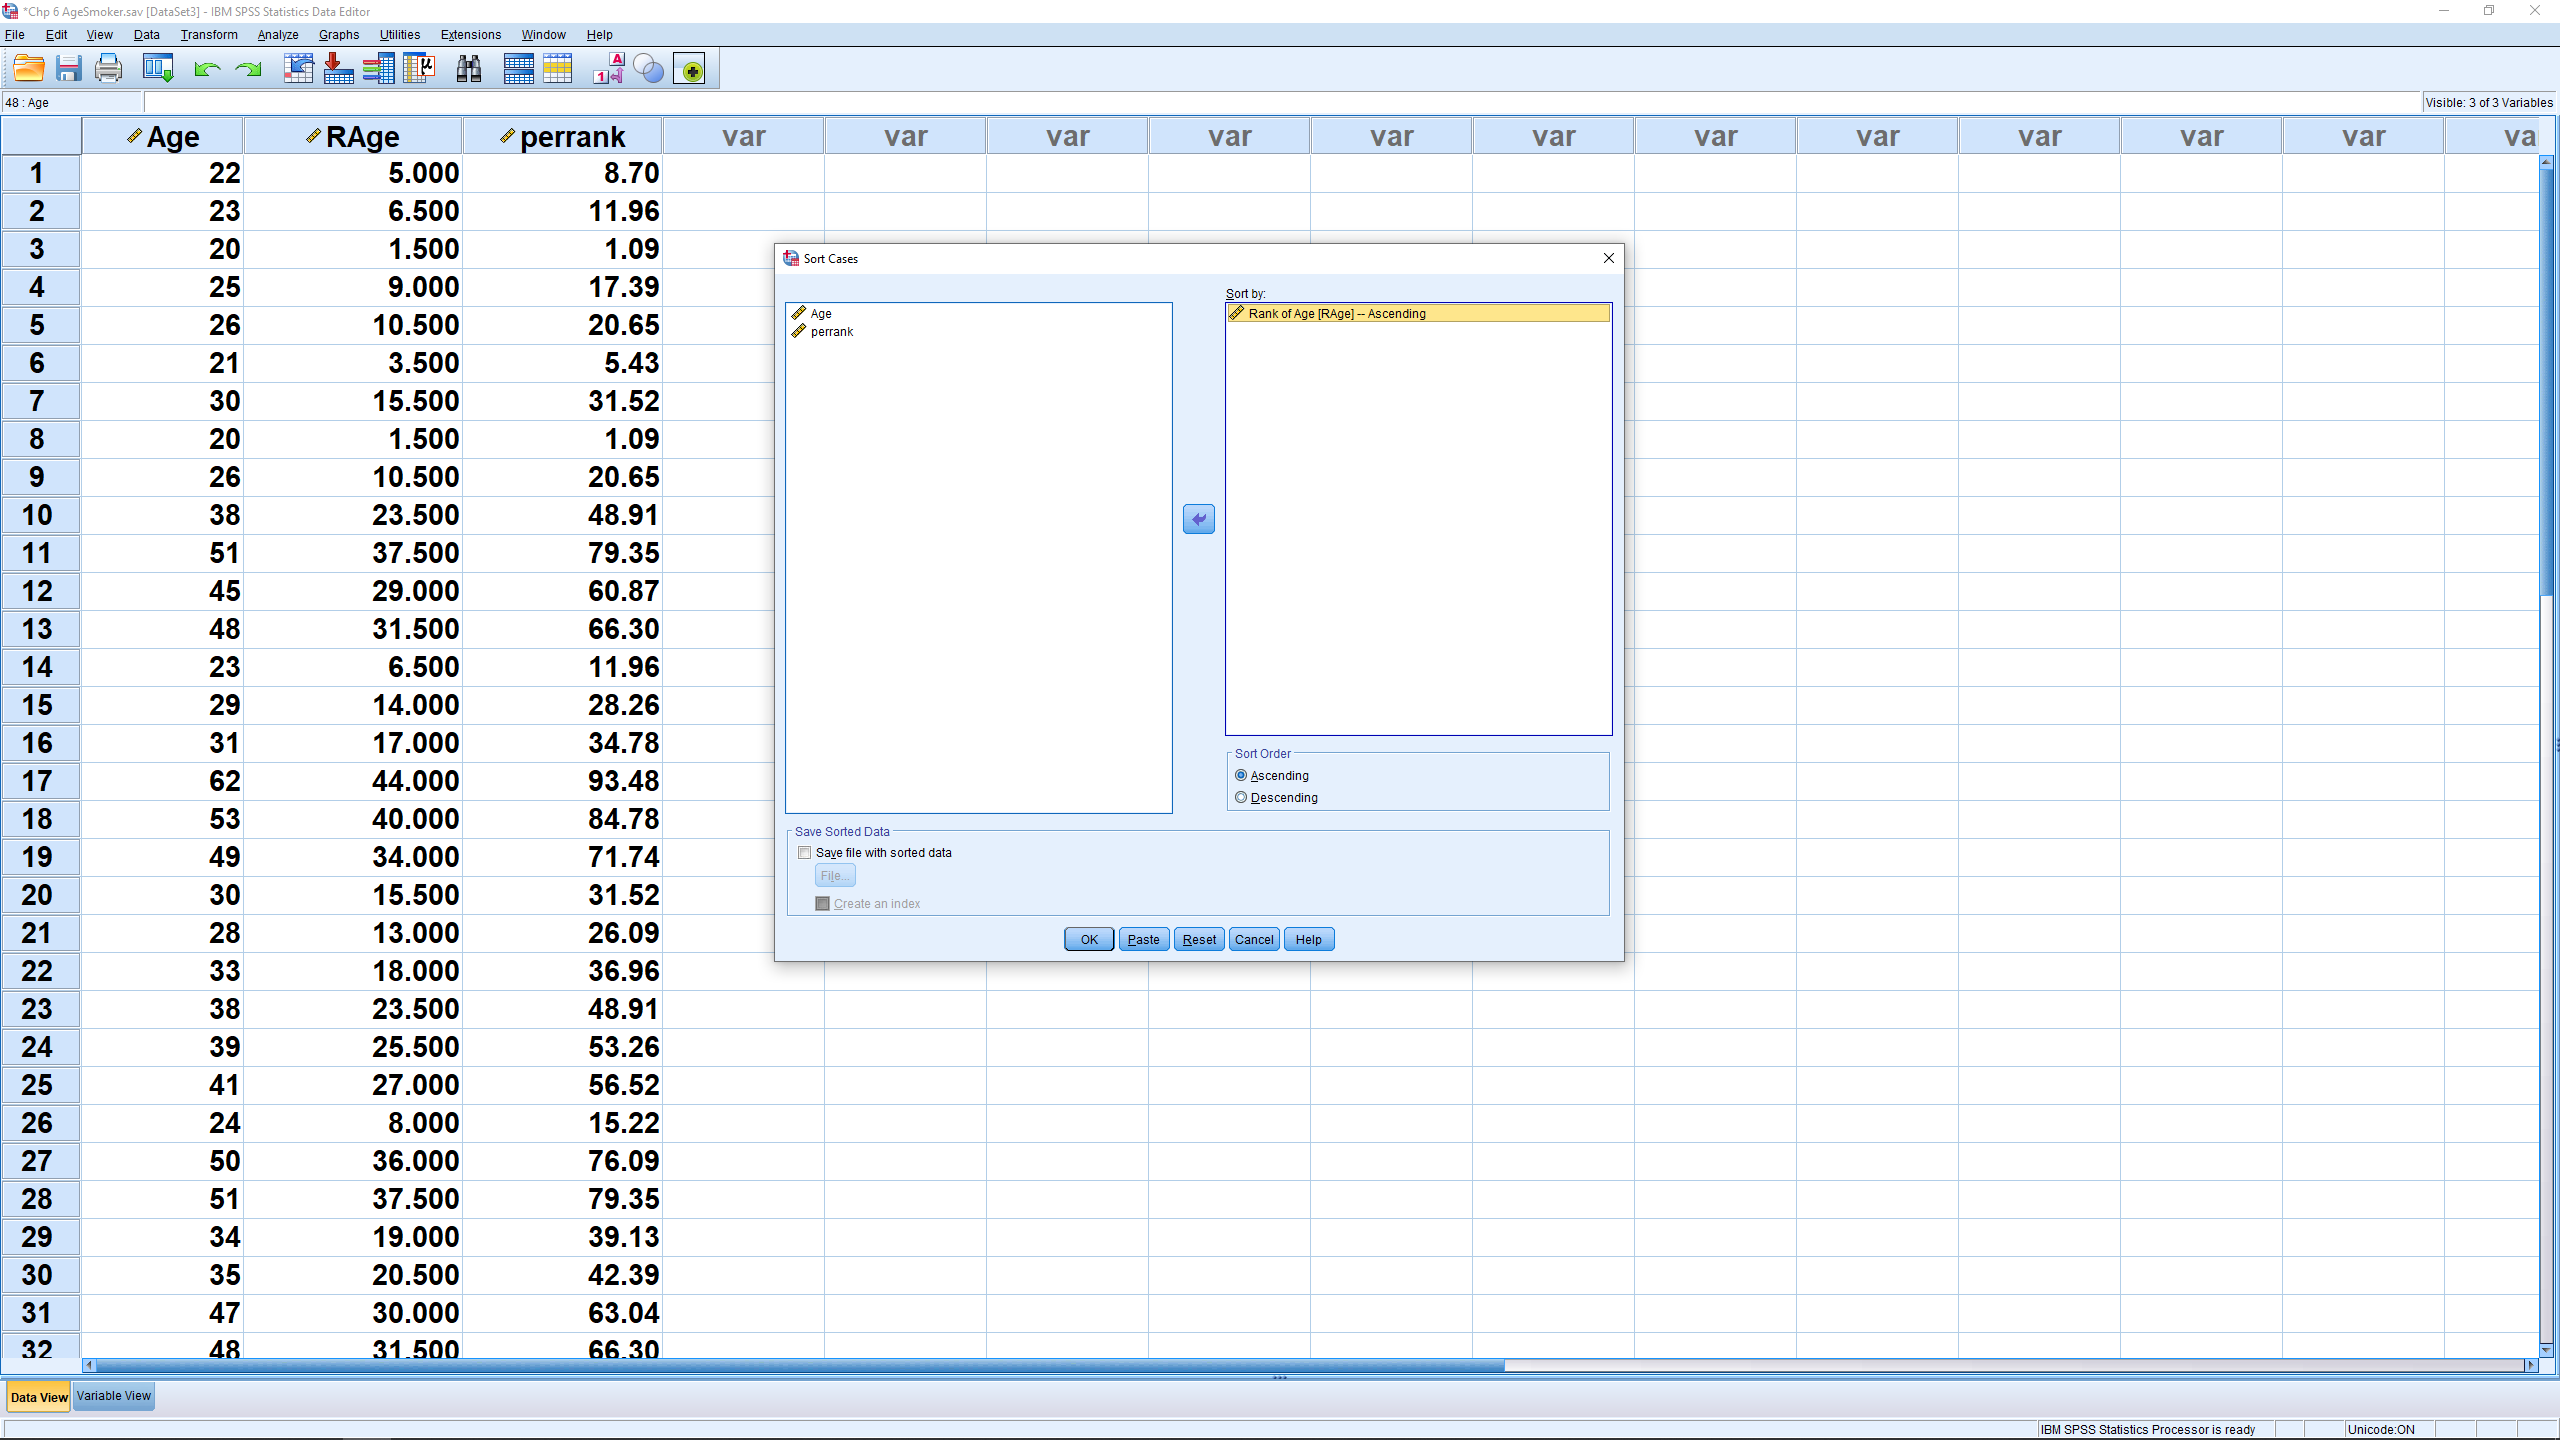
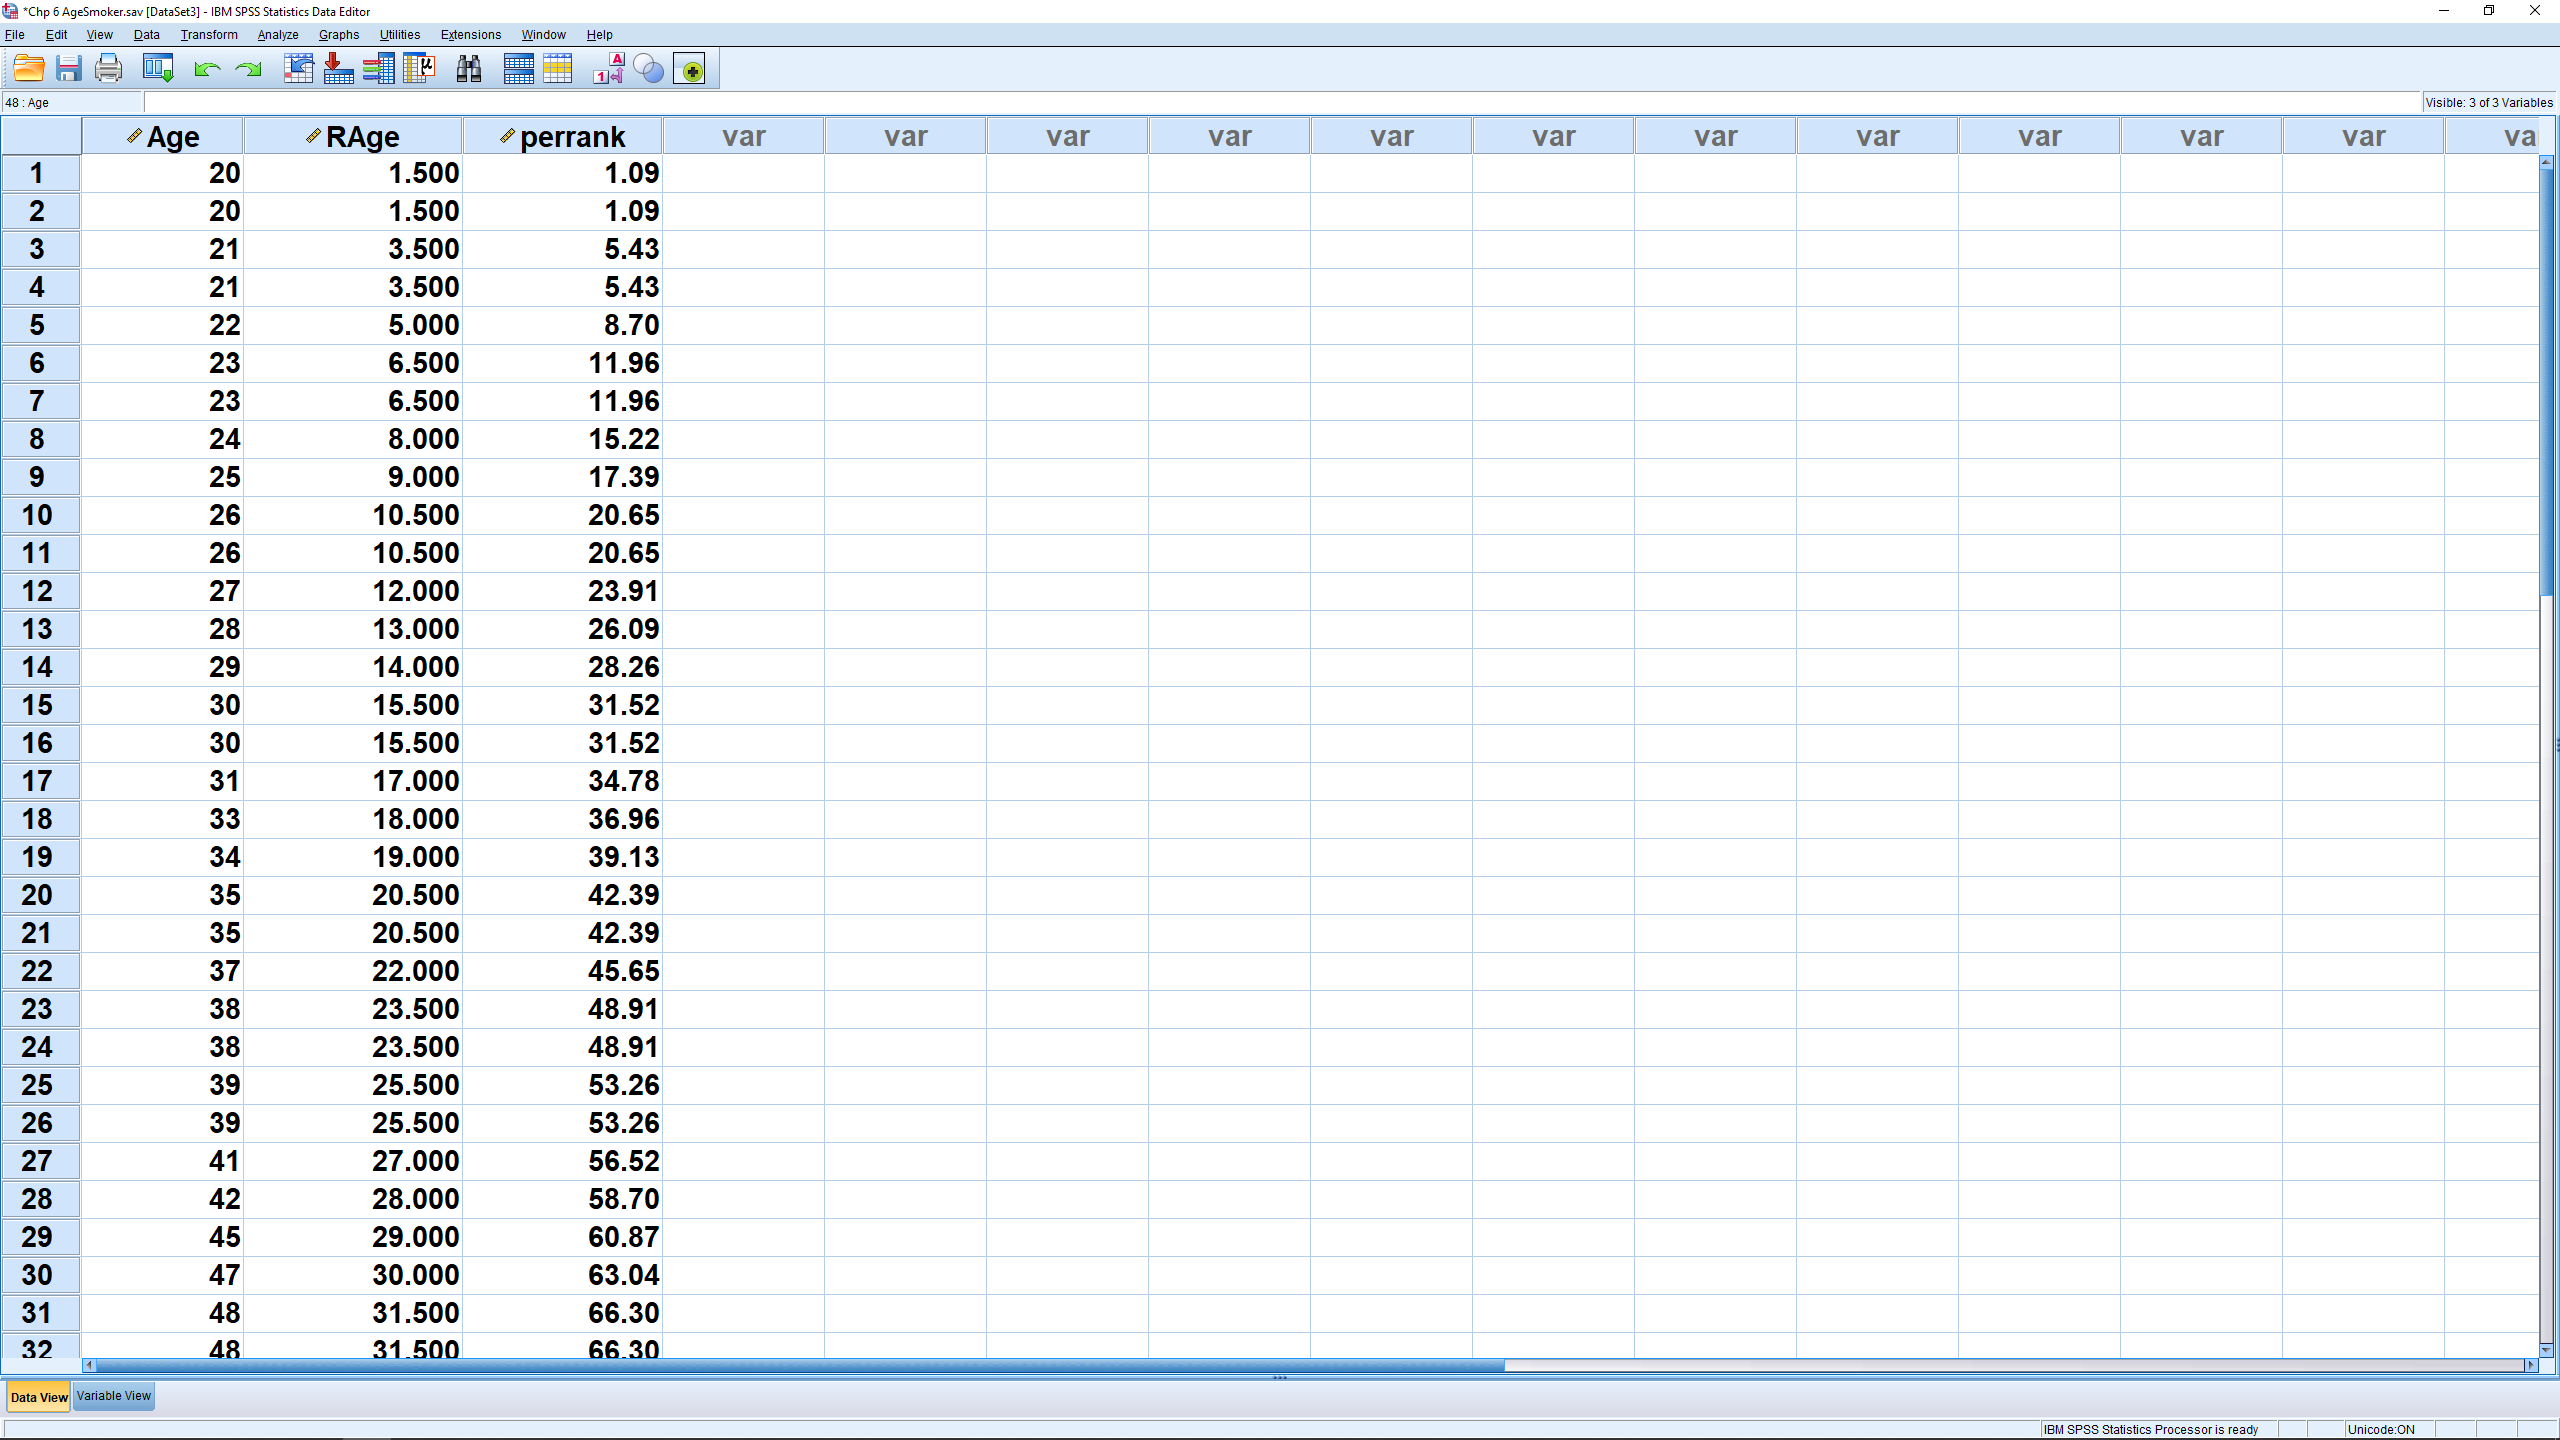
We can sort the data on RAge using Data Sort Cases :
Note how the smallest value has percentile rank 0. If you scroll to the end of the list you will see that the largest value has percentile rank 100.

CDF stands for Cumulative Distribution Function. It is literally the cumulative area under a probability distribution function, in this case the normal distribution. So multiplying it by 100 give the percentile rank. The output, in the Data View window looks like :
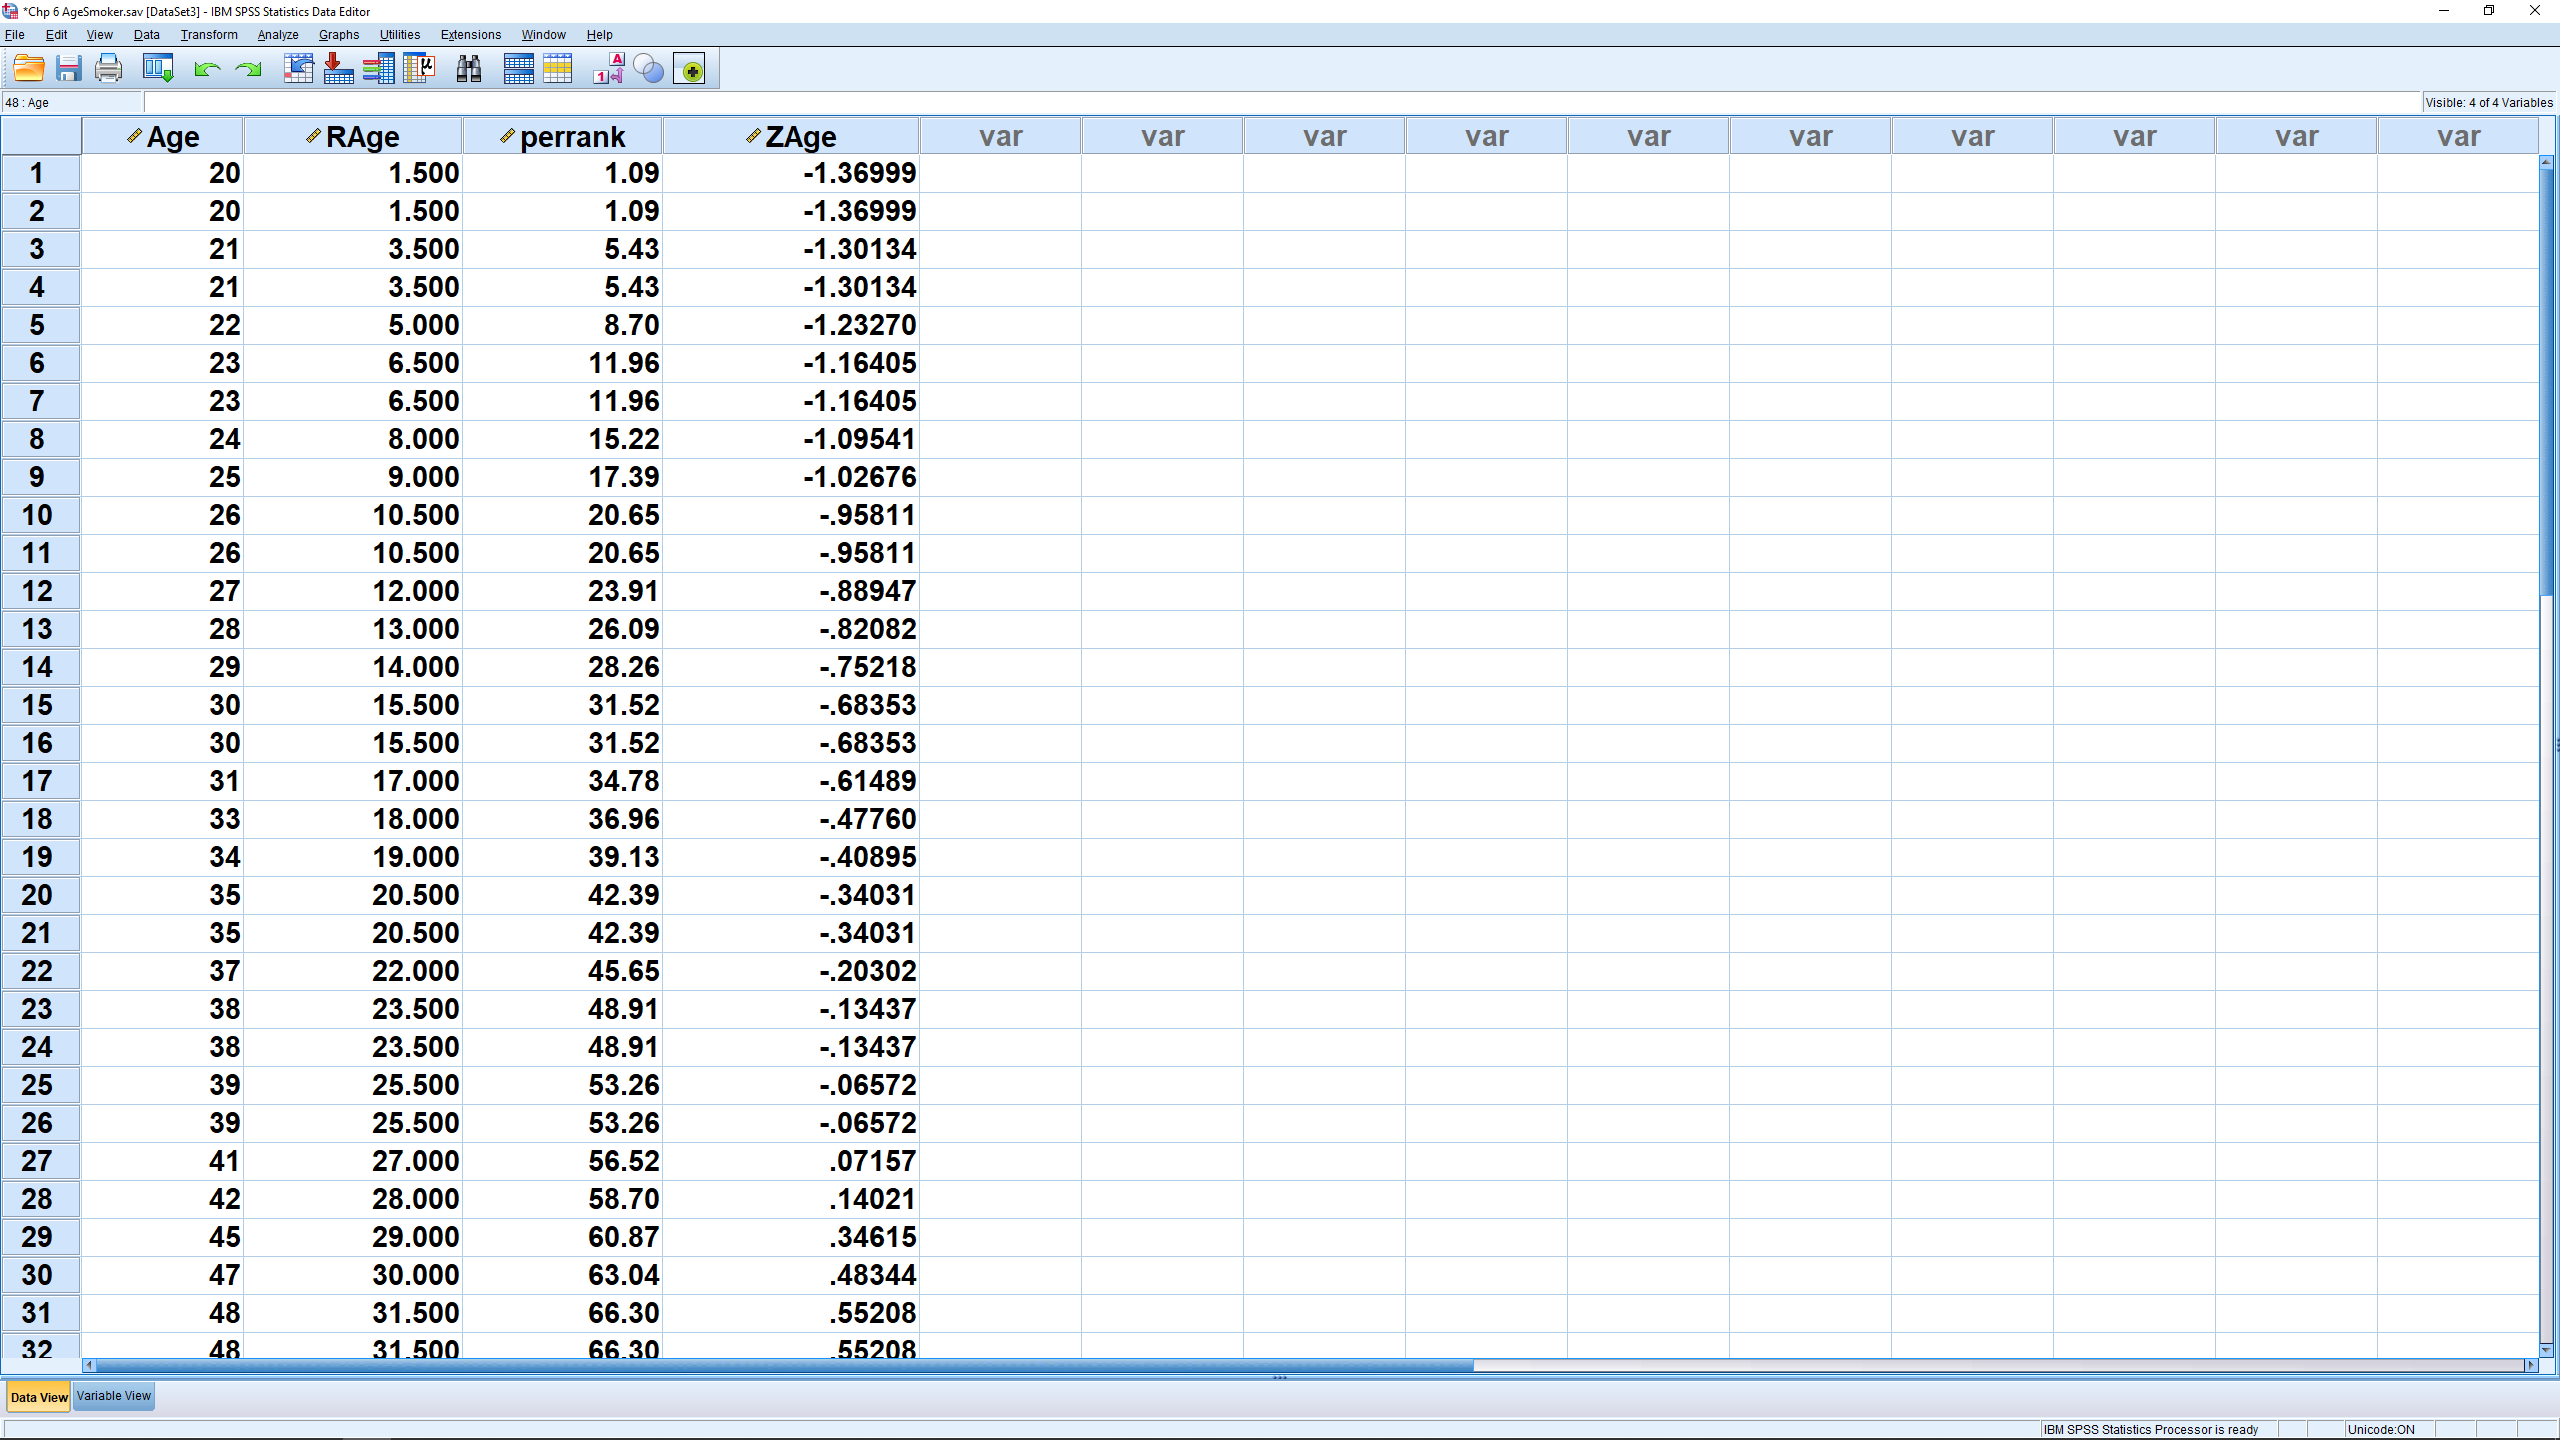
Note how the percentile ranks of gparank are different from, but close to, the percentile ranks of perrank computed using the data’s own distribution. This indicates that the data themselves follow an approximately normal distribution.
