4. Probability and the Binomial Distributions
4.3 SPSS Lesson 3: Combining variables – advanced
In SPSS Lesson 2 we saw how we can take variables defined on a Lickert scale and add them together, reverse scaling if necessary, to produce a single, better, variable for analysis. This works because the Lickert scale variables all have the same “units” (number of answer choices). You can combine any variables that have the same units, like feet or years or whatever. But if the units are different, but the variables still measure the same thing, like, for example, number of diet days per week and calories eaten per meal both measure levels of healthy eating habits but it makes no sense to simply add two such variables. It is literally like adding apples and oranges. The solution is to  -transform the variables you want to add first. The -transform converts whatever units the original variable has to the -transformed variable’s units of standard deviation distance from the mean. So when you add two -transformed variables you end up with another variable whose units are standard deviation distance from the mean.
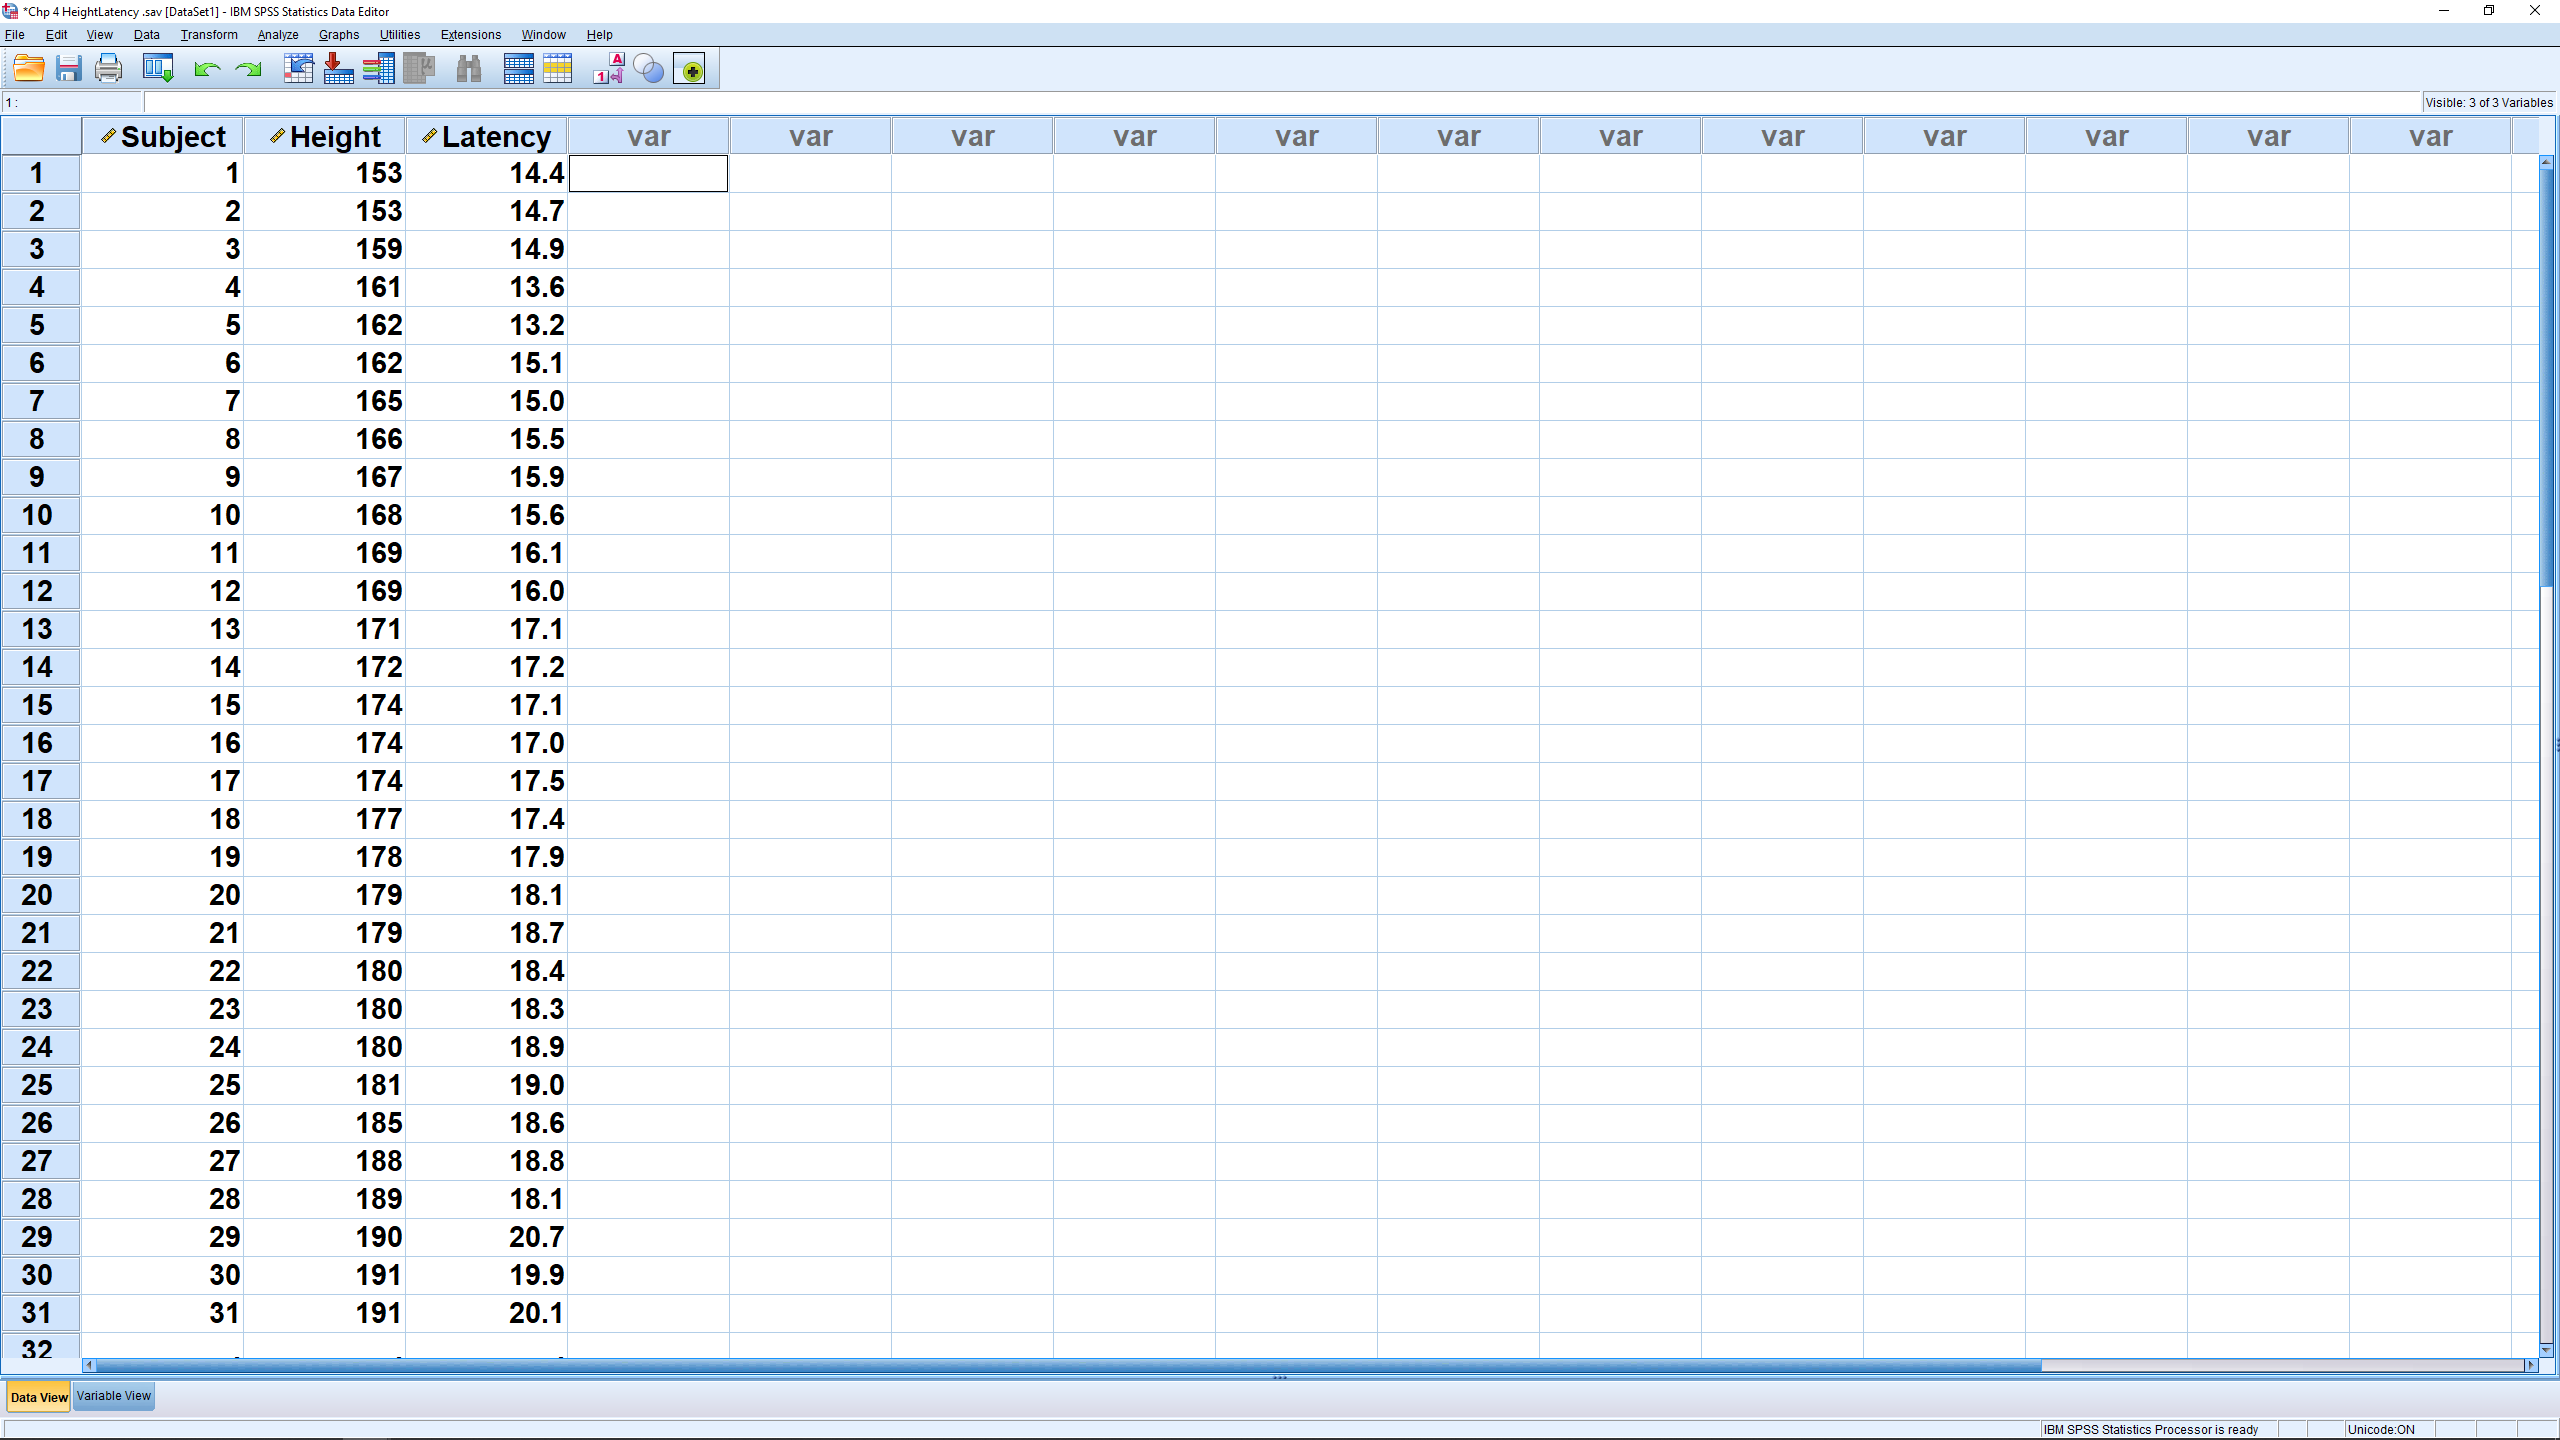
Let’s start by opening the file “HeightLatency.sav” from the Data Sets. There are two variables in this file that we will combine into fewer variables. We begin by combining the variables Height and Latency into a new variable.
Since Height and Latency have different units, we need to -transform them first by running a descriptive analysis, making sure you have the “Save standardized values as variables” box checked :
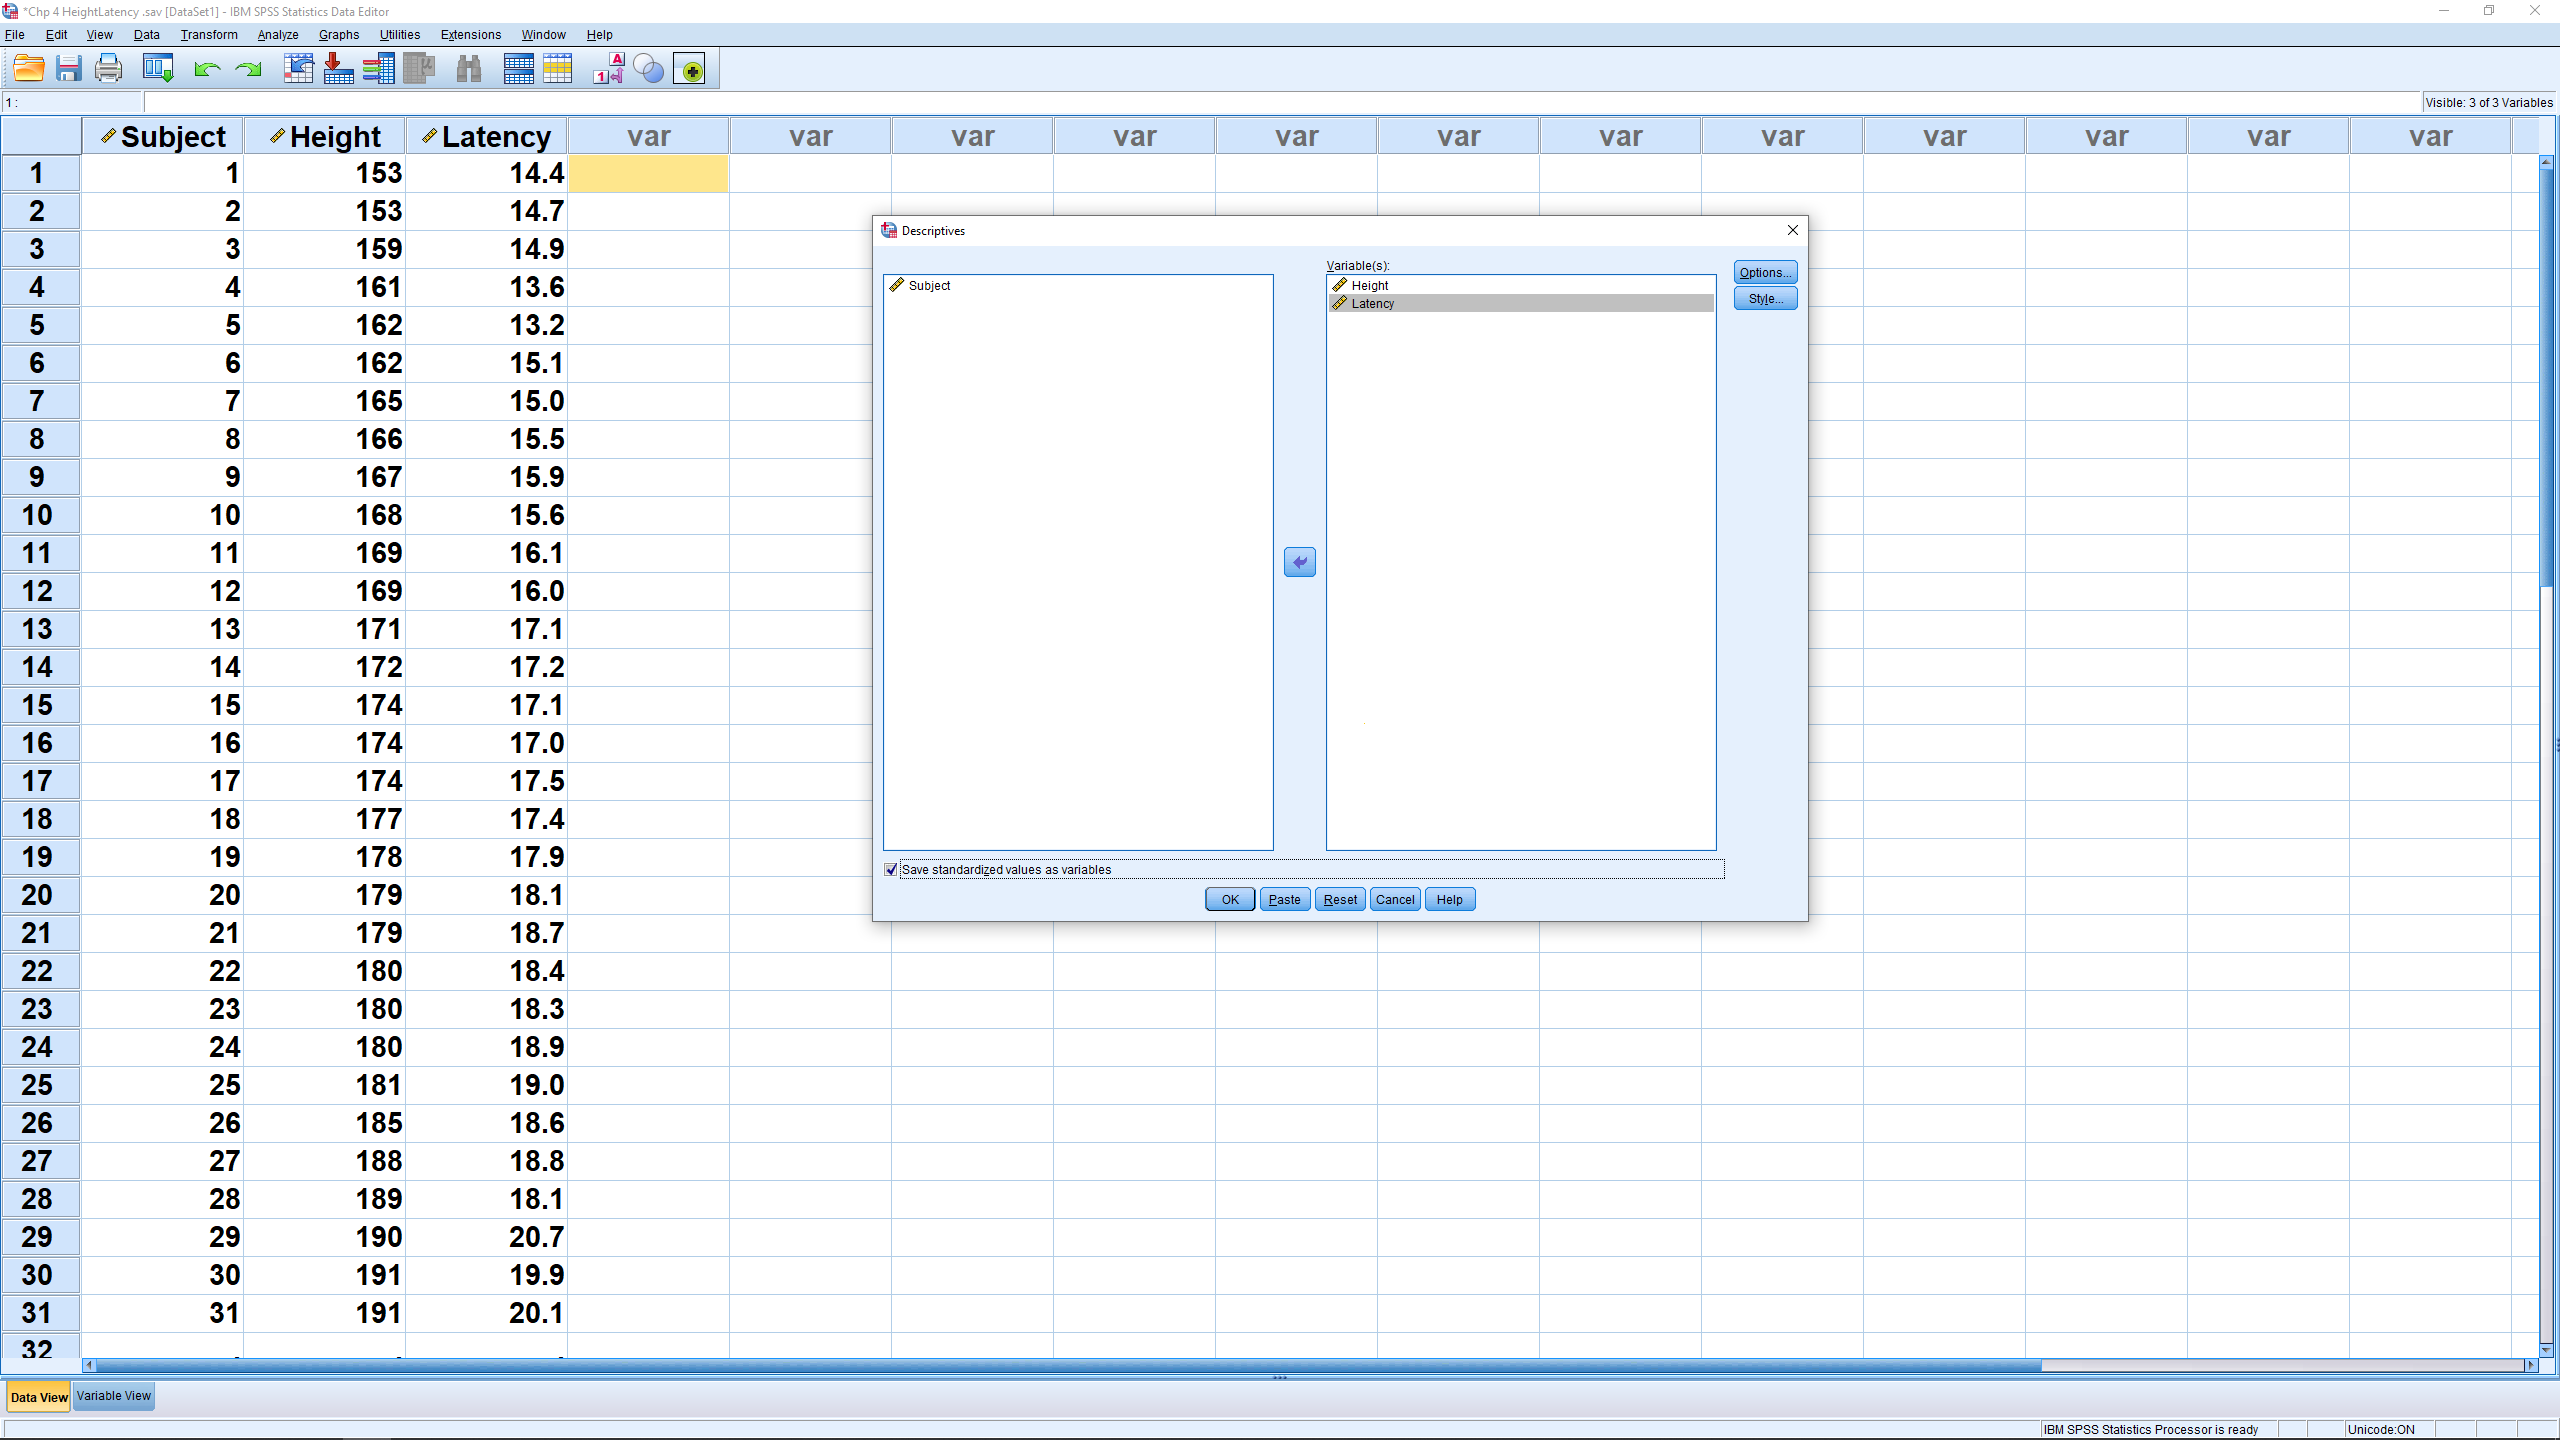
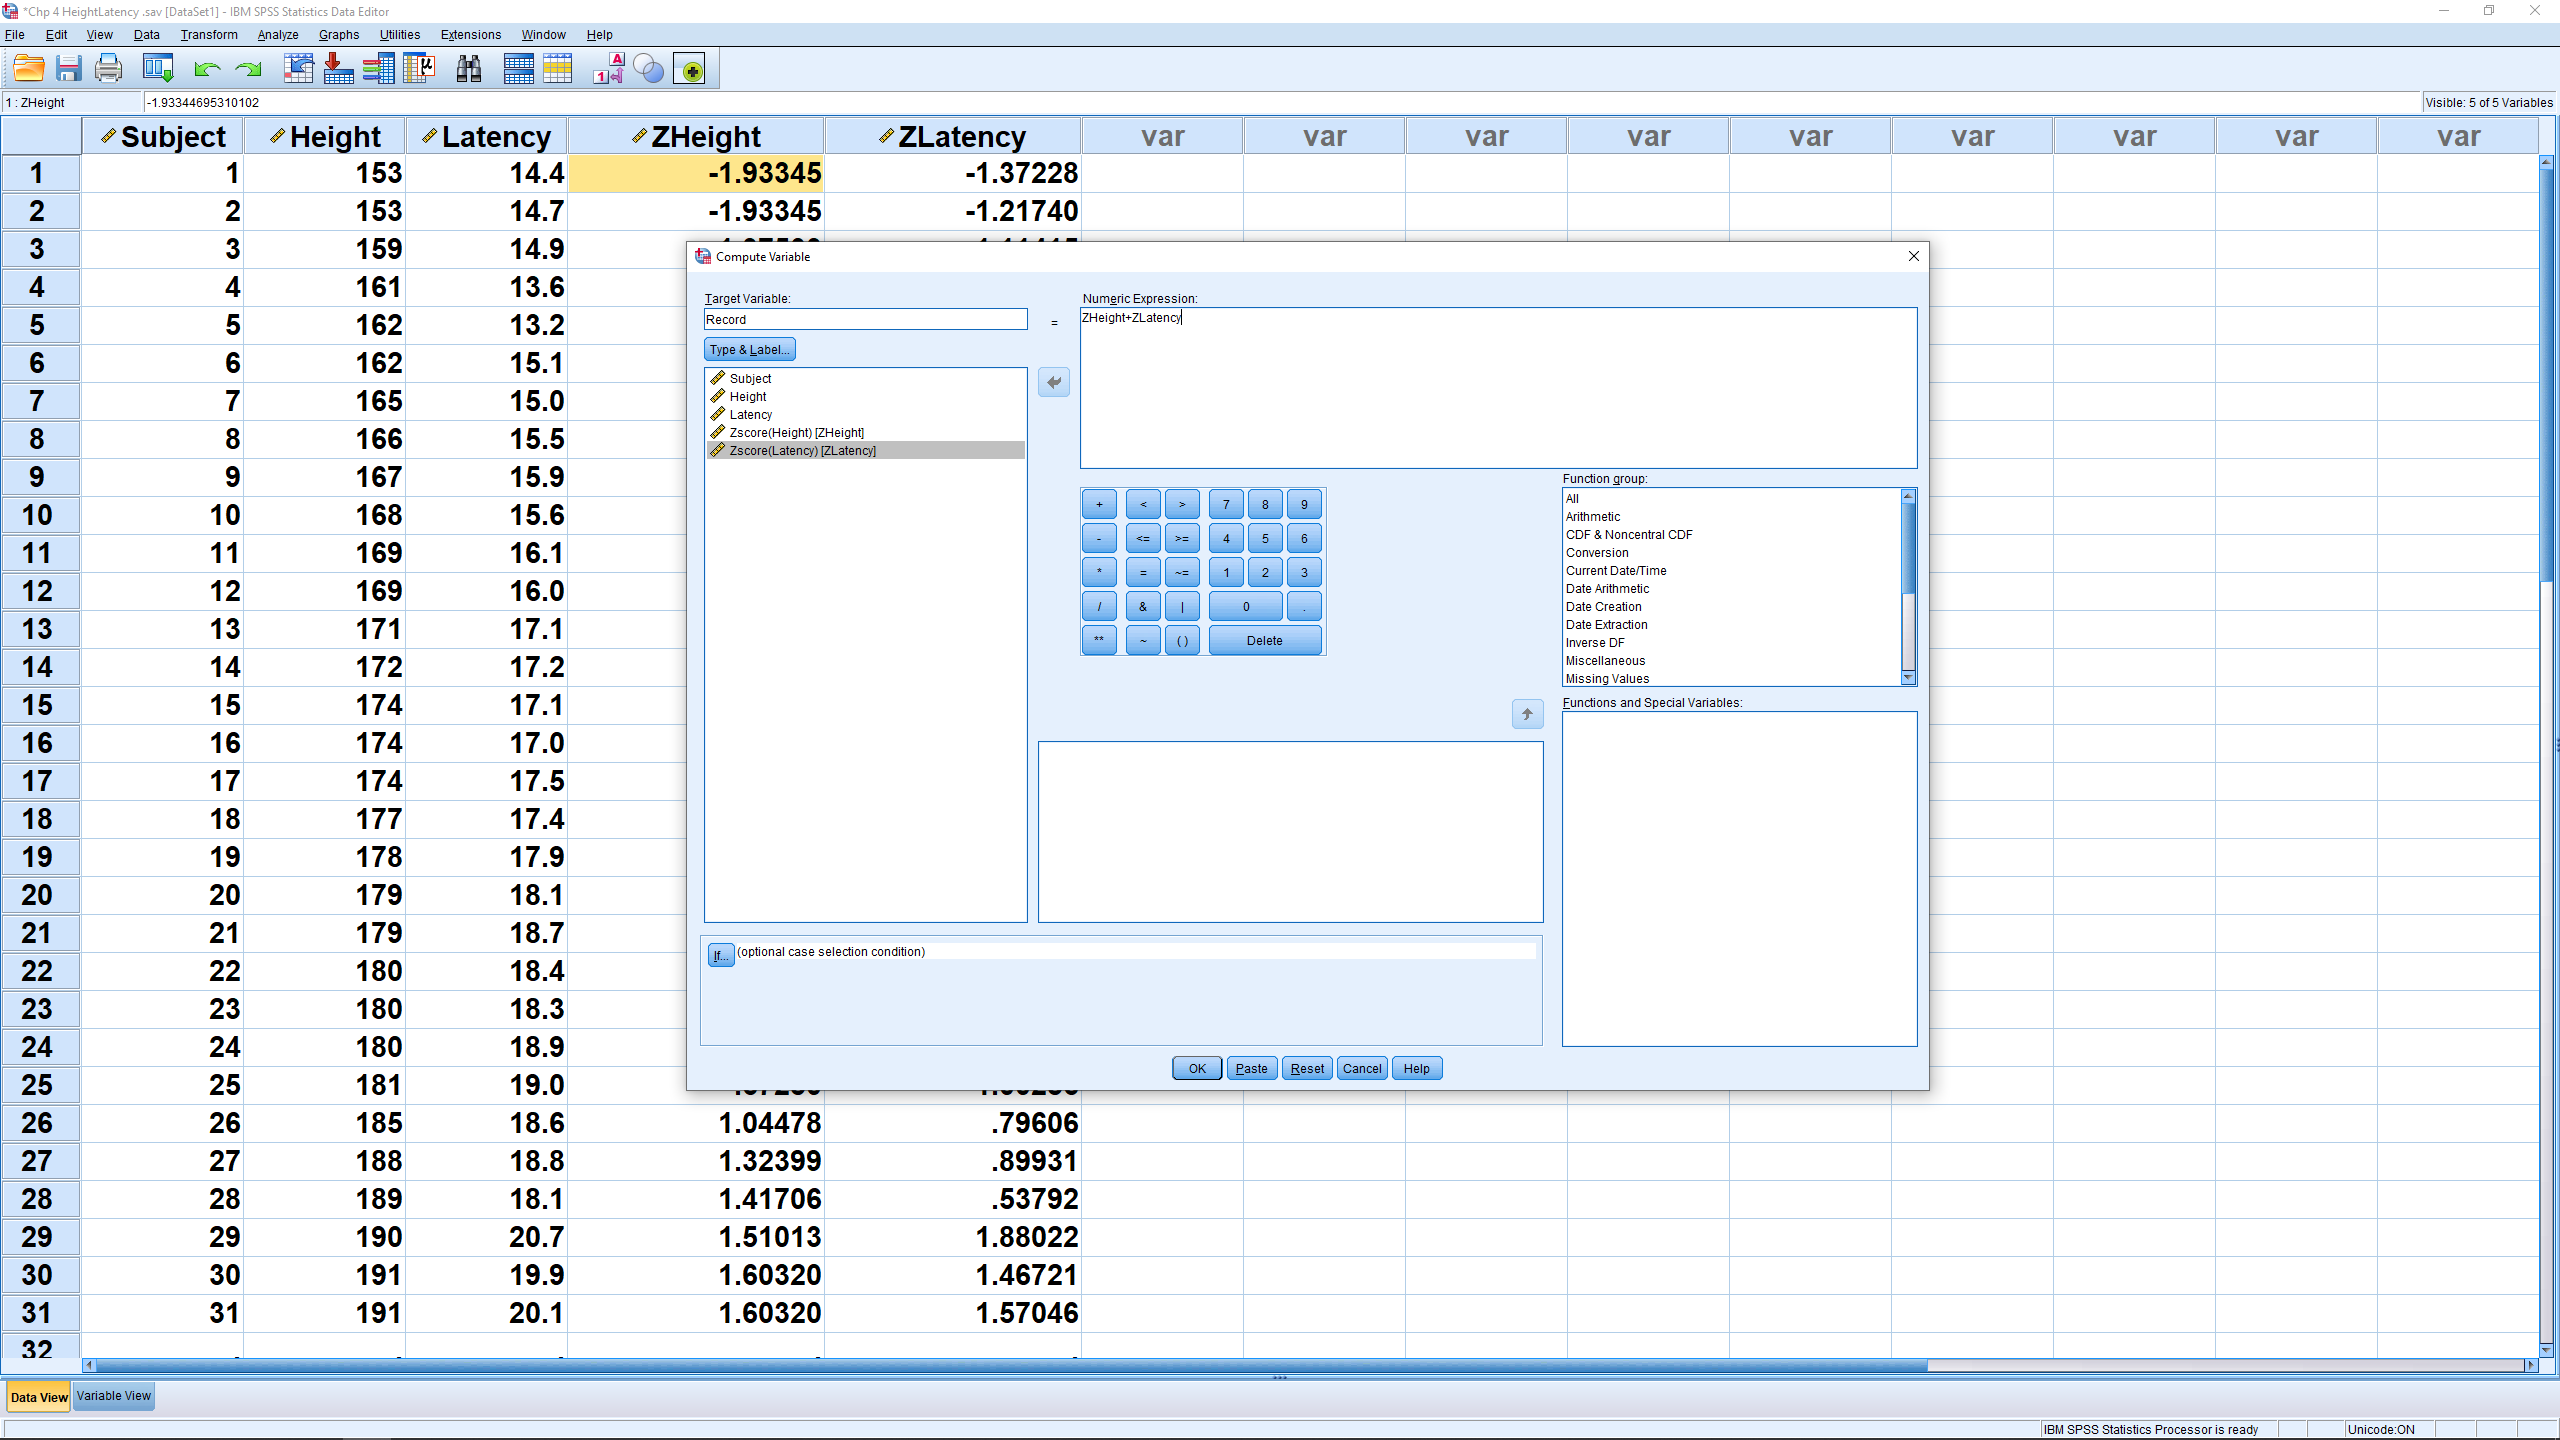
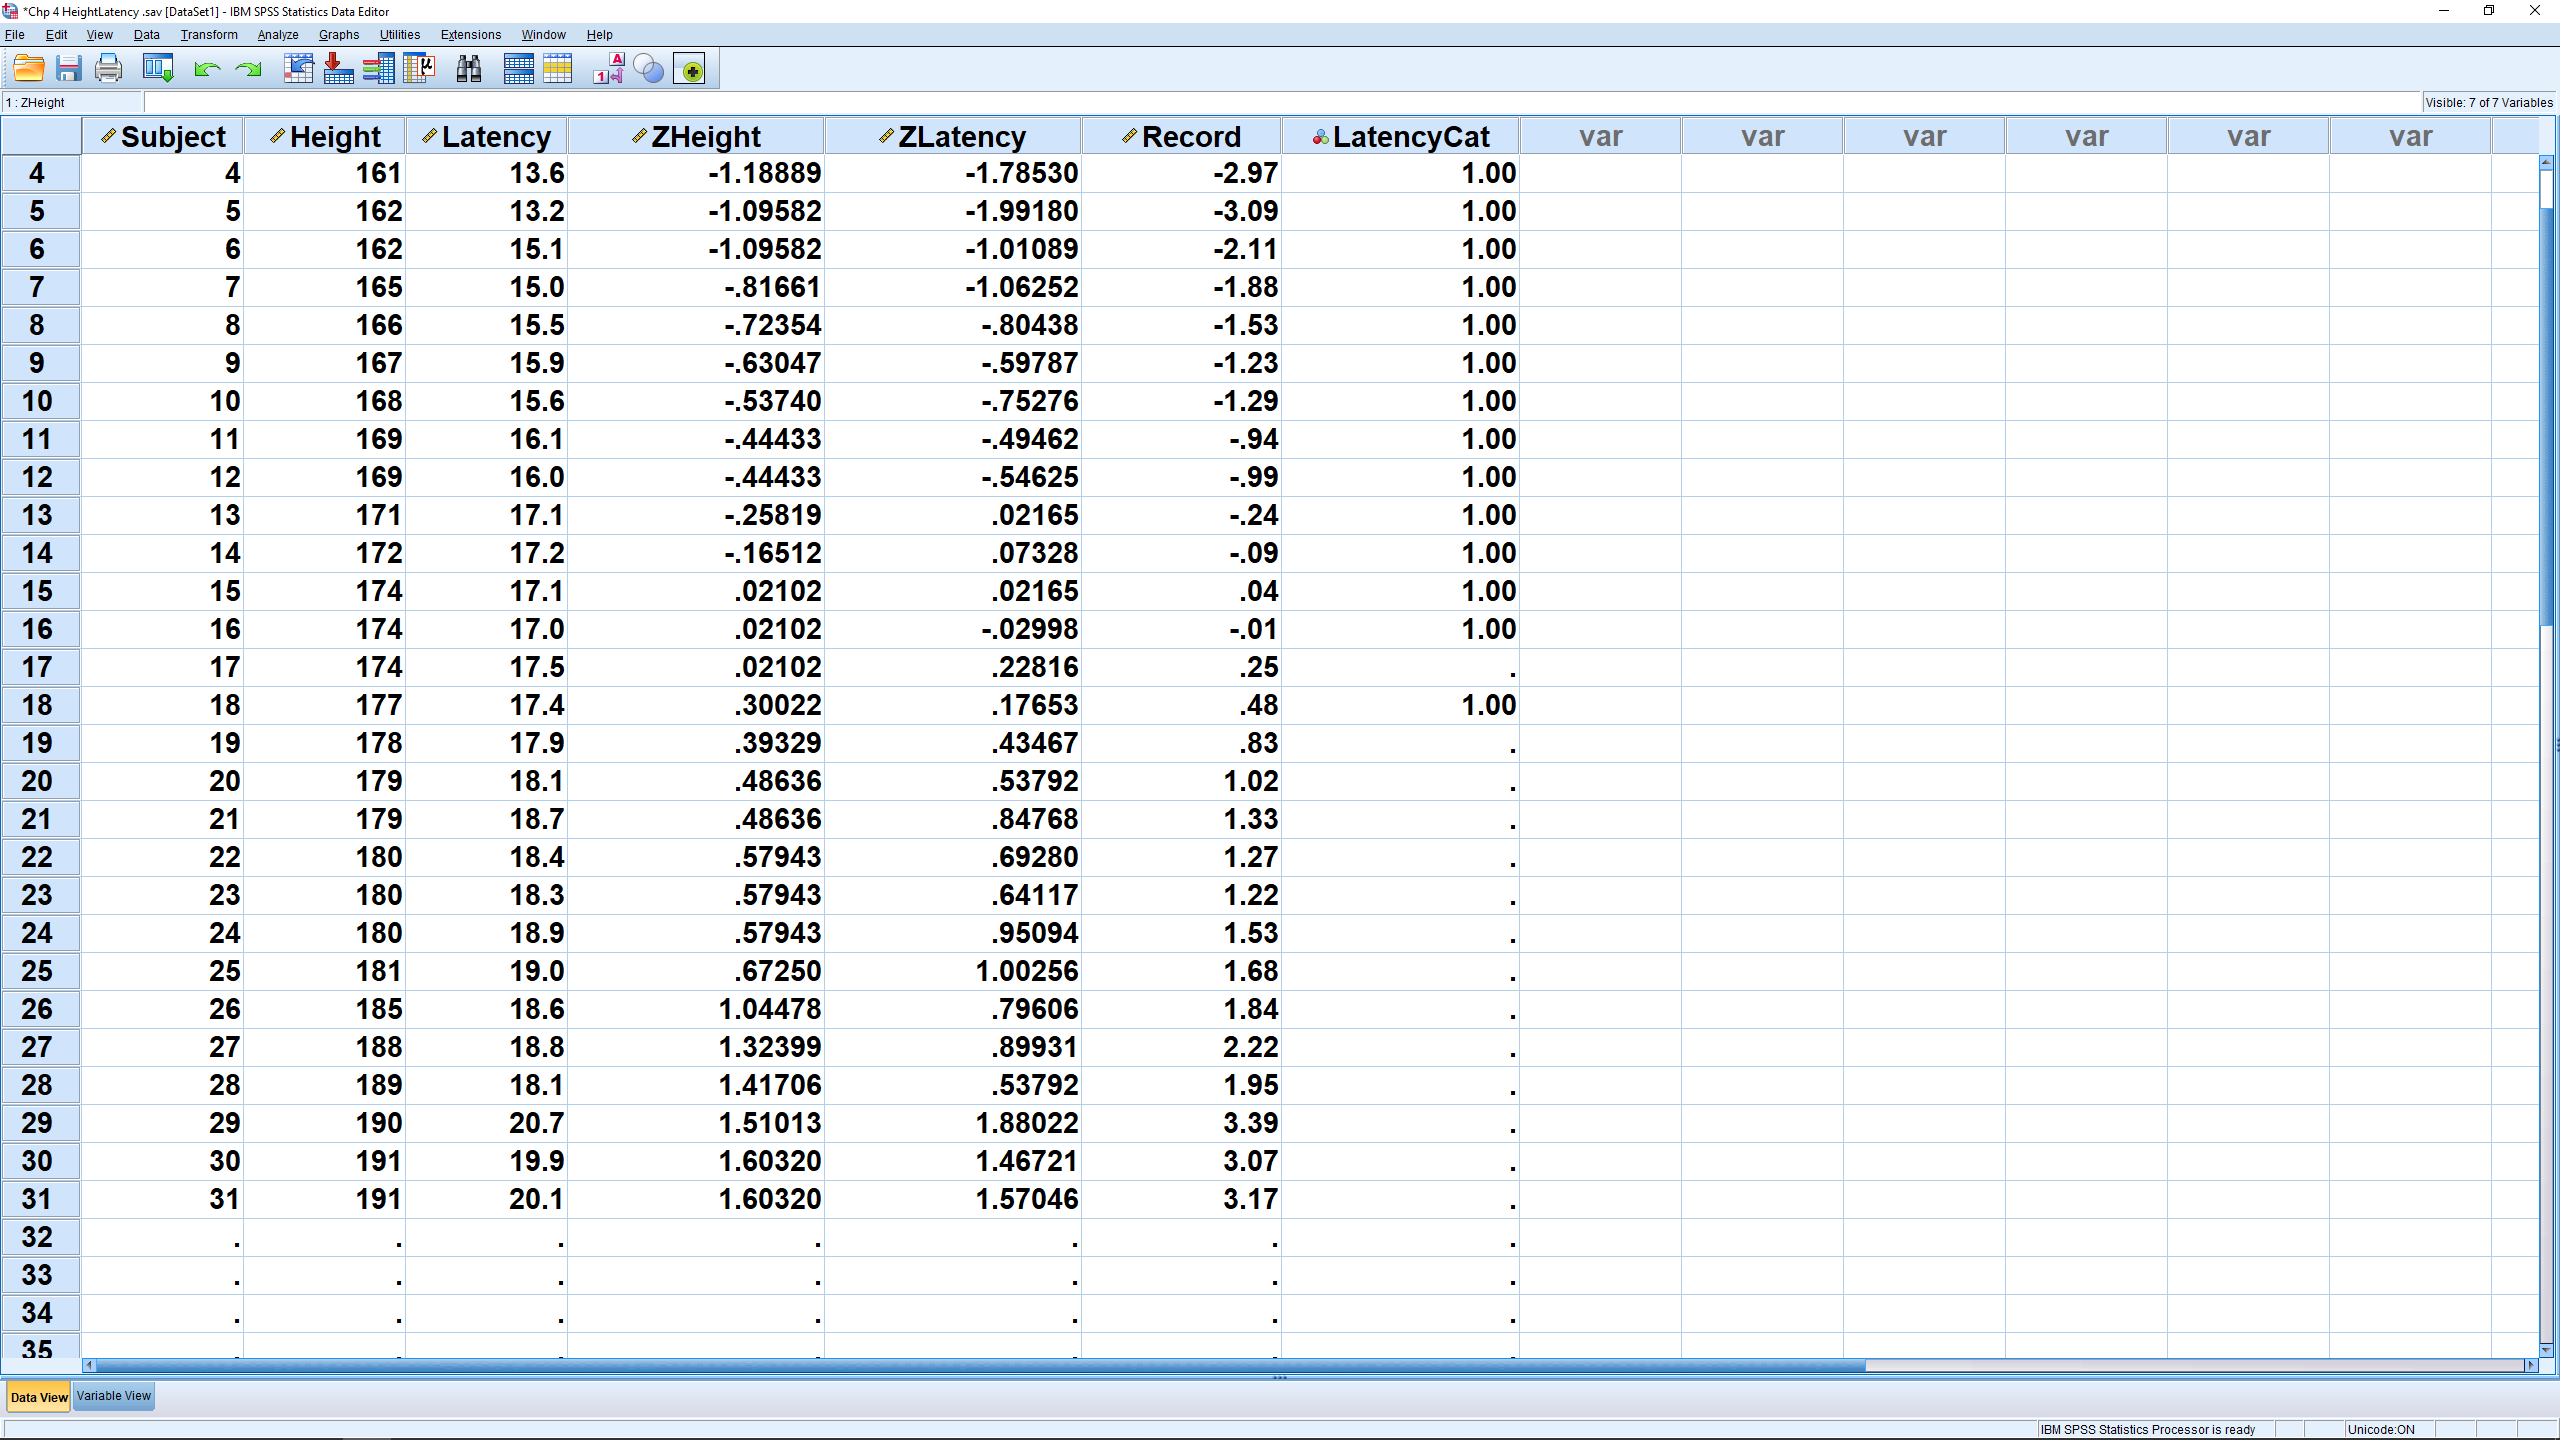
Hit Ok. This will produce two new variables, visible in the Data View window, called ZHeight and ZLatency. We don’t care about the actual descriptive statistics output here. Now you can simply add the -transforms to produce the required new variable :
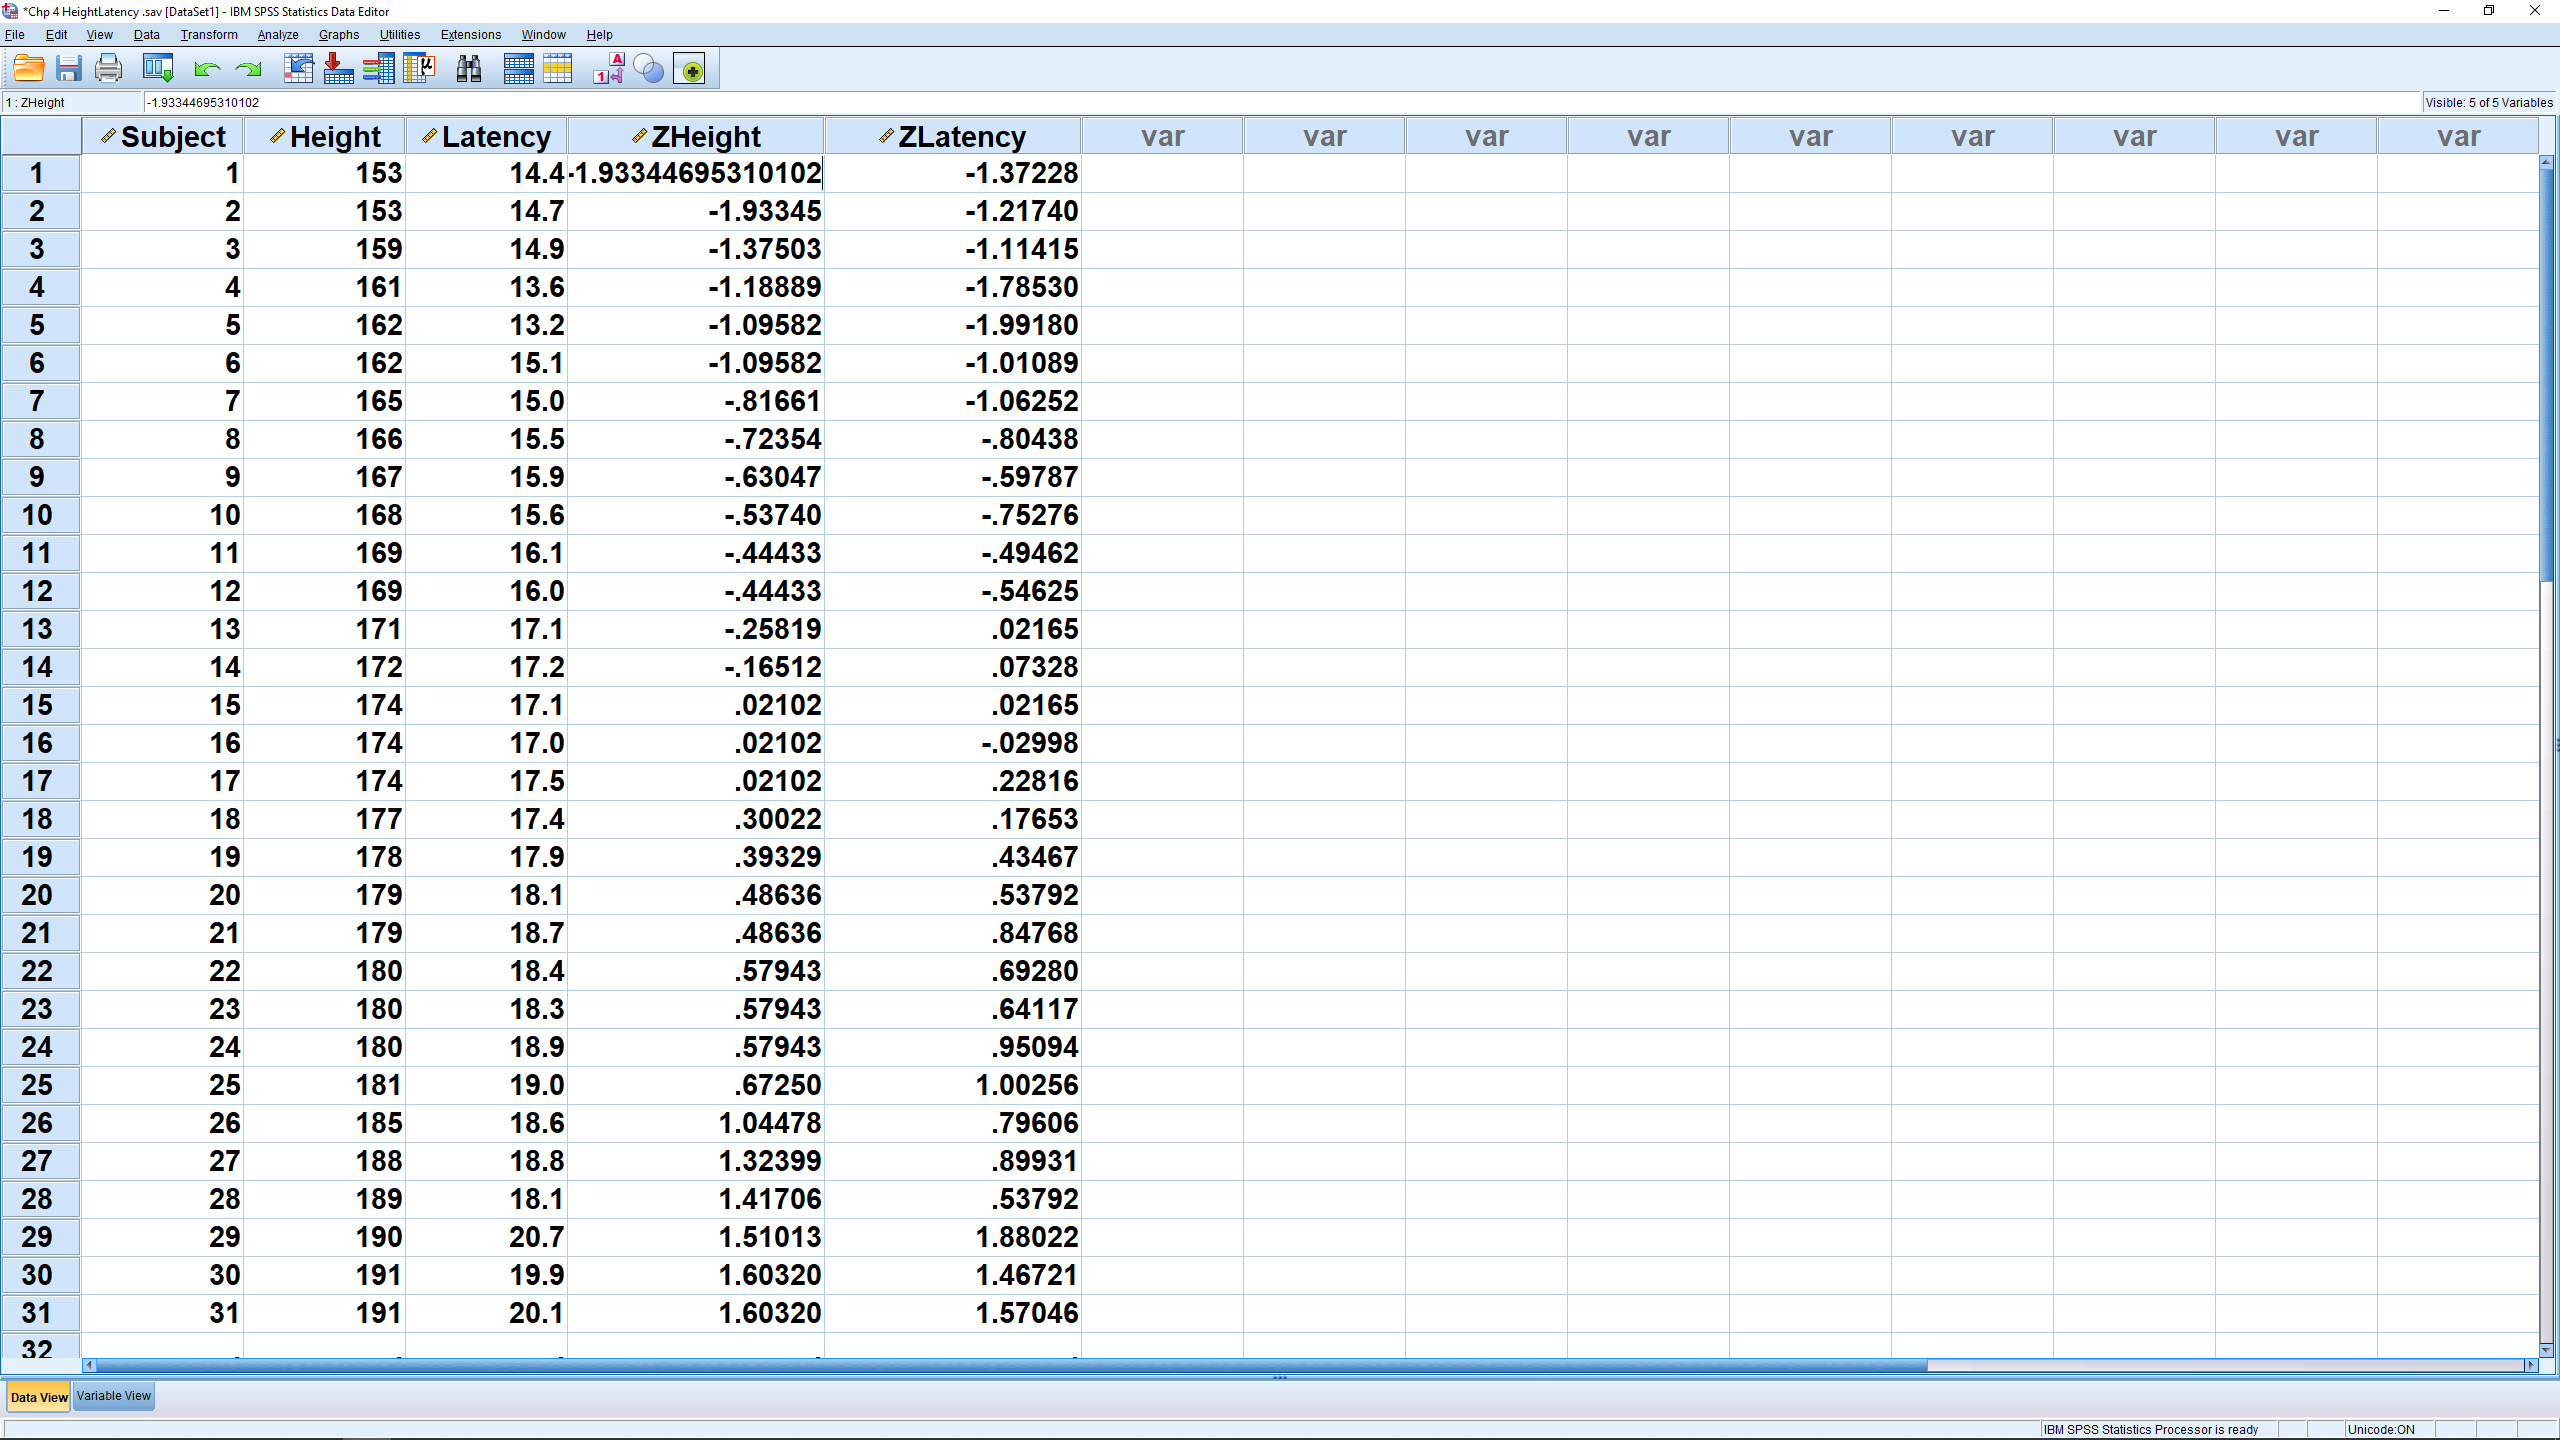
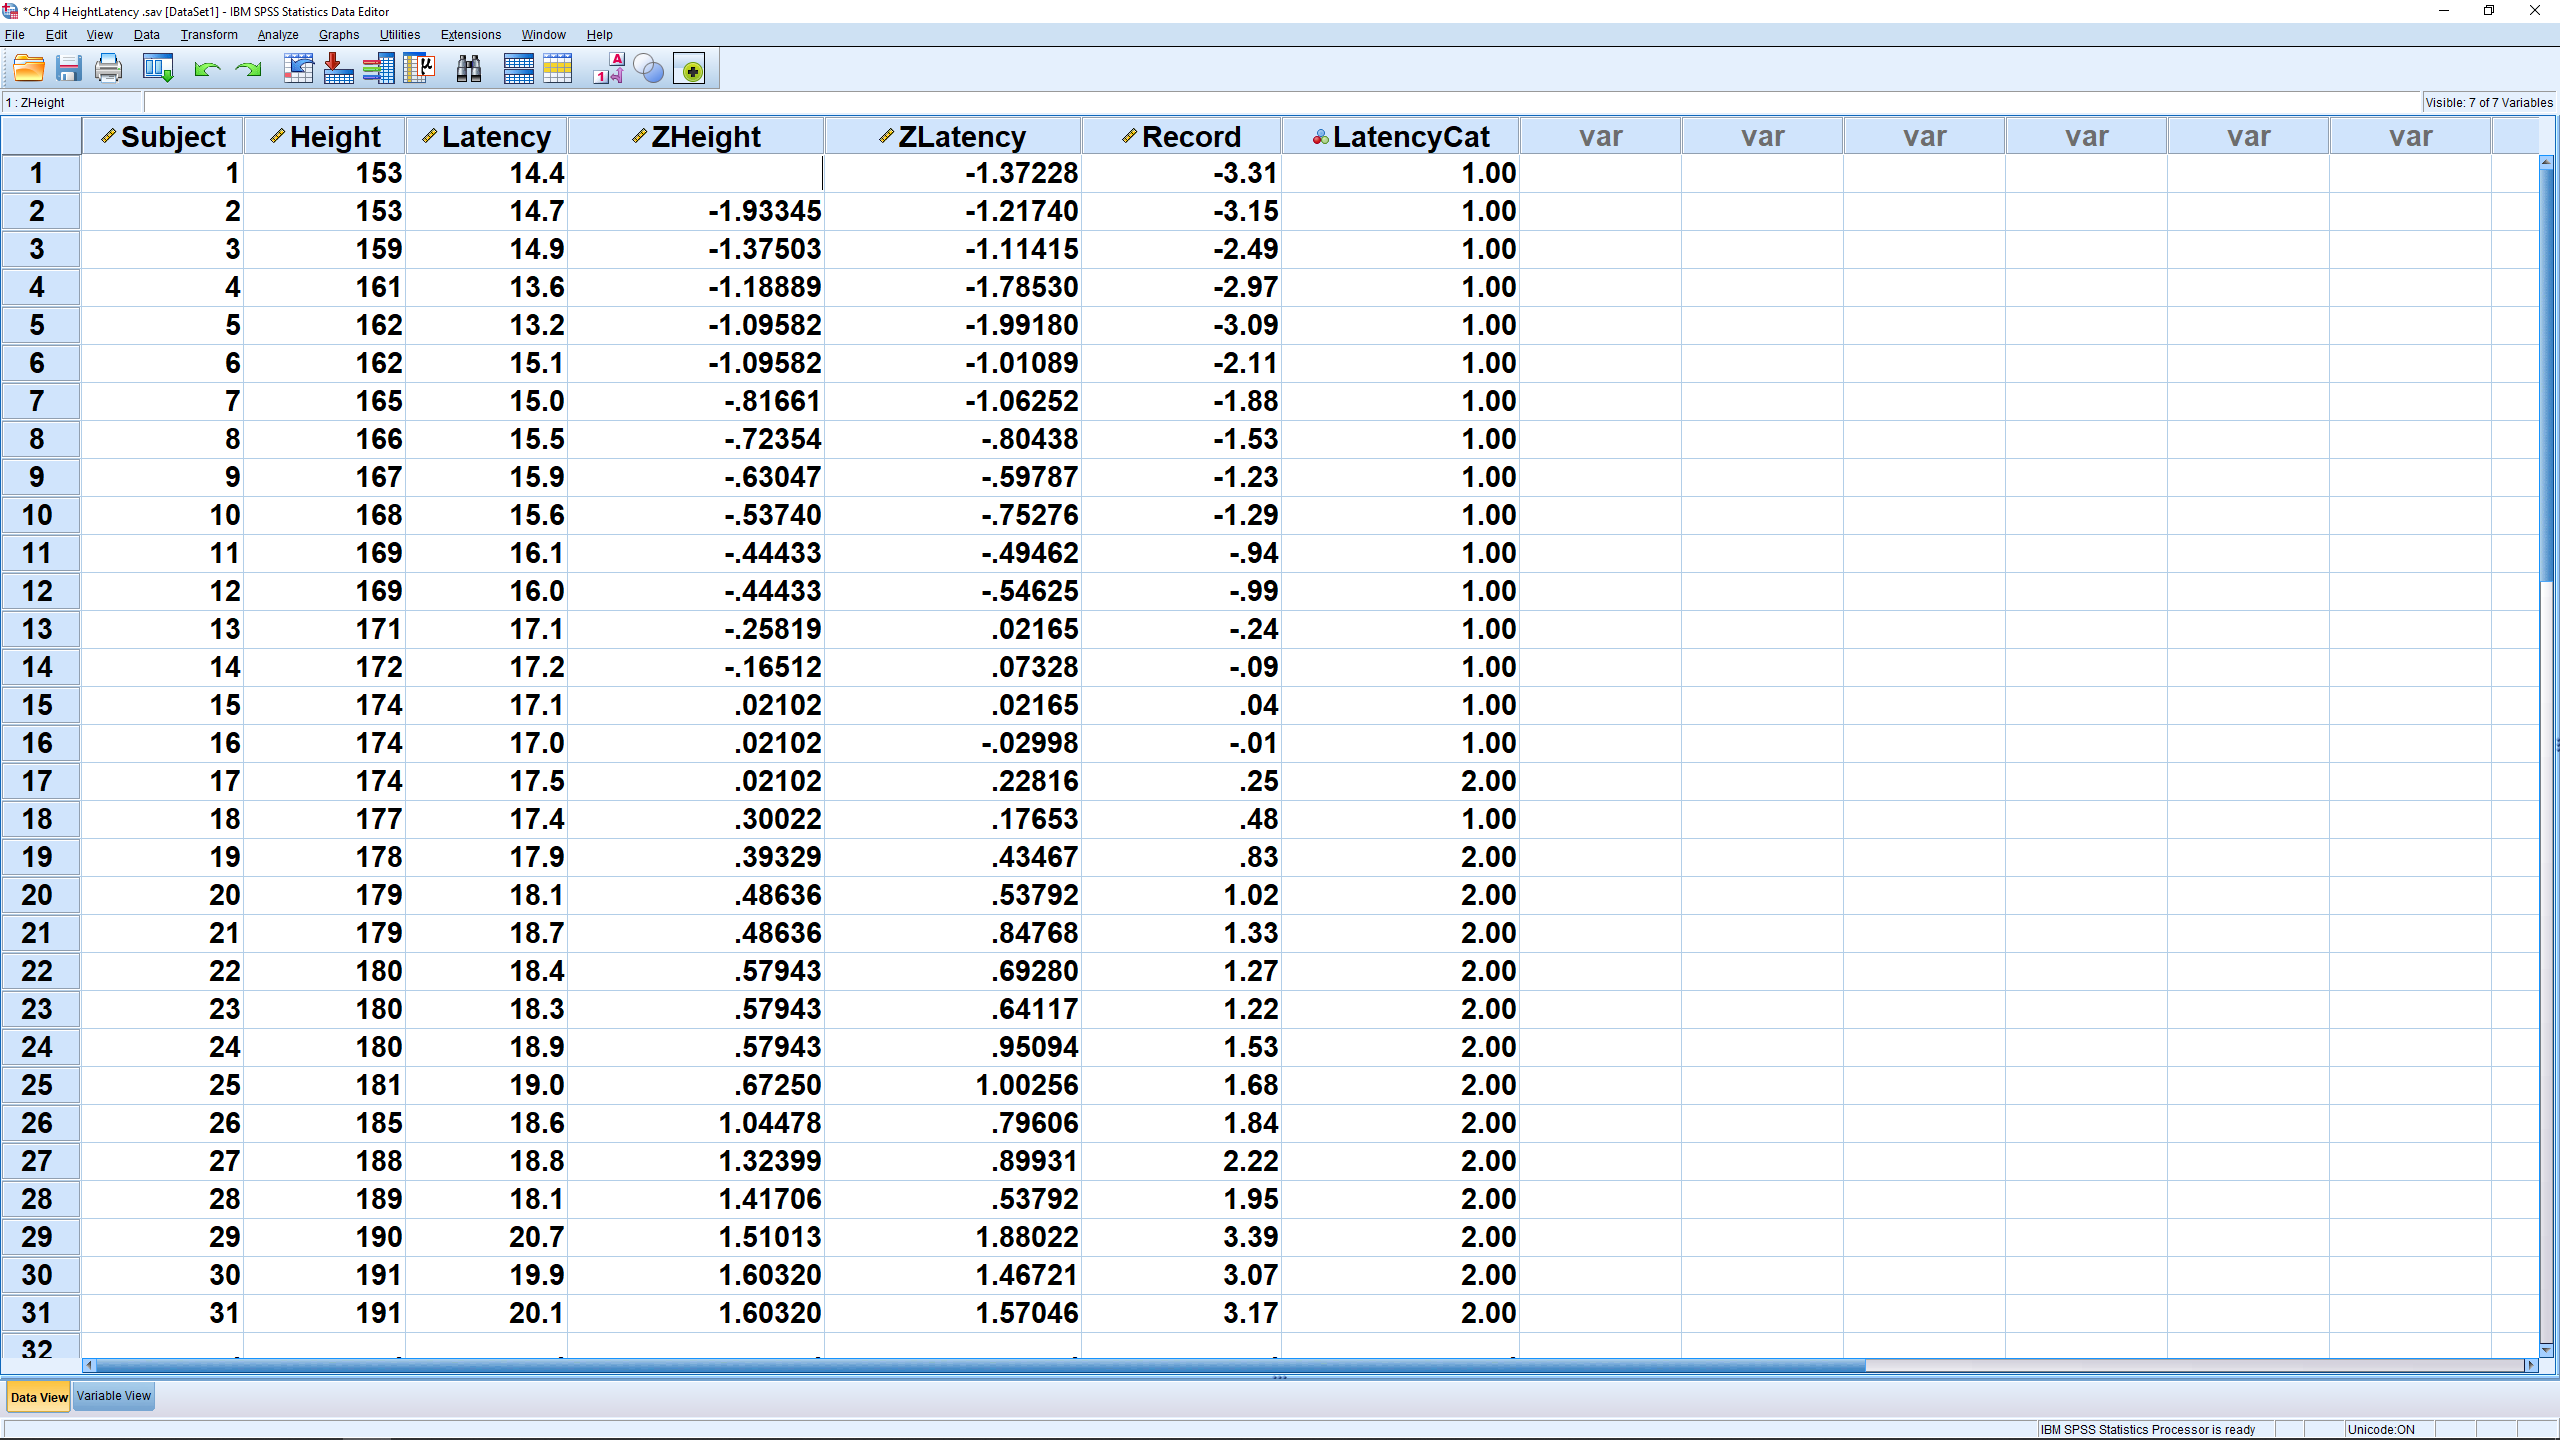
Now let’s combine a couple of sets of variables that have compatible units. First add ZHeight to ZLatency (note the fancy new way to add) to produce a new variable Sub :
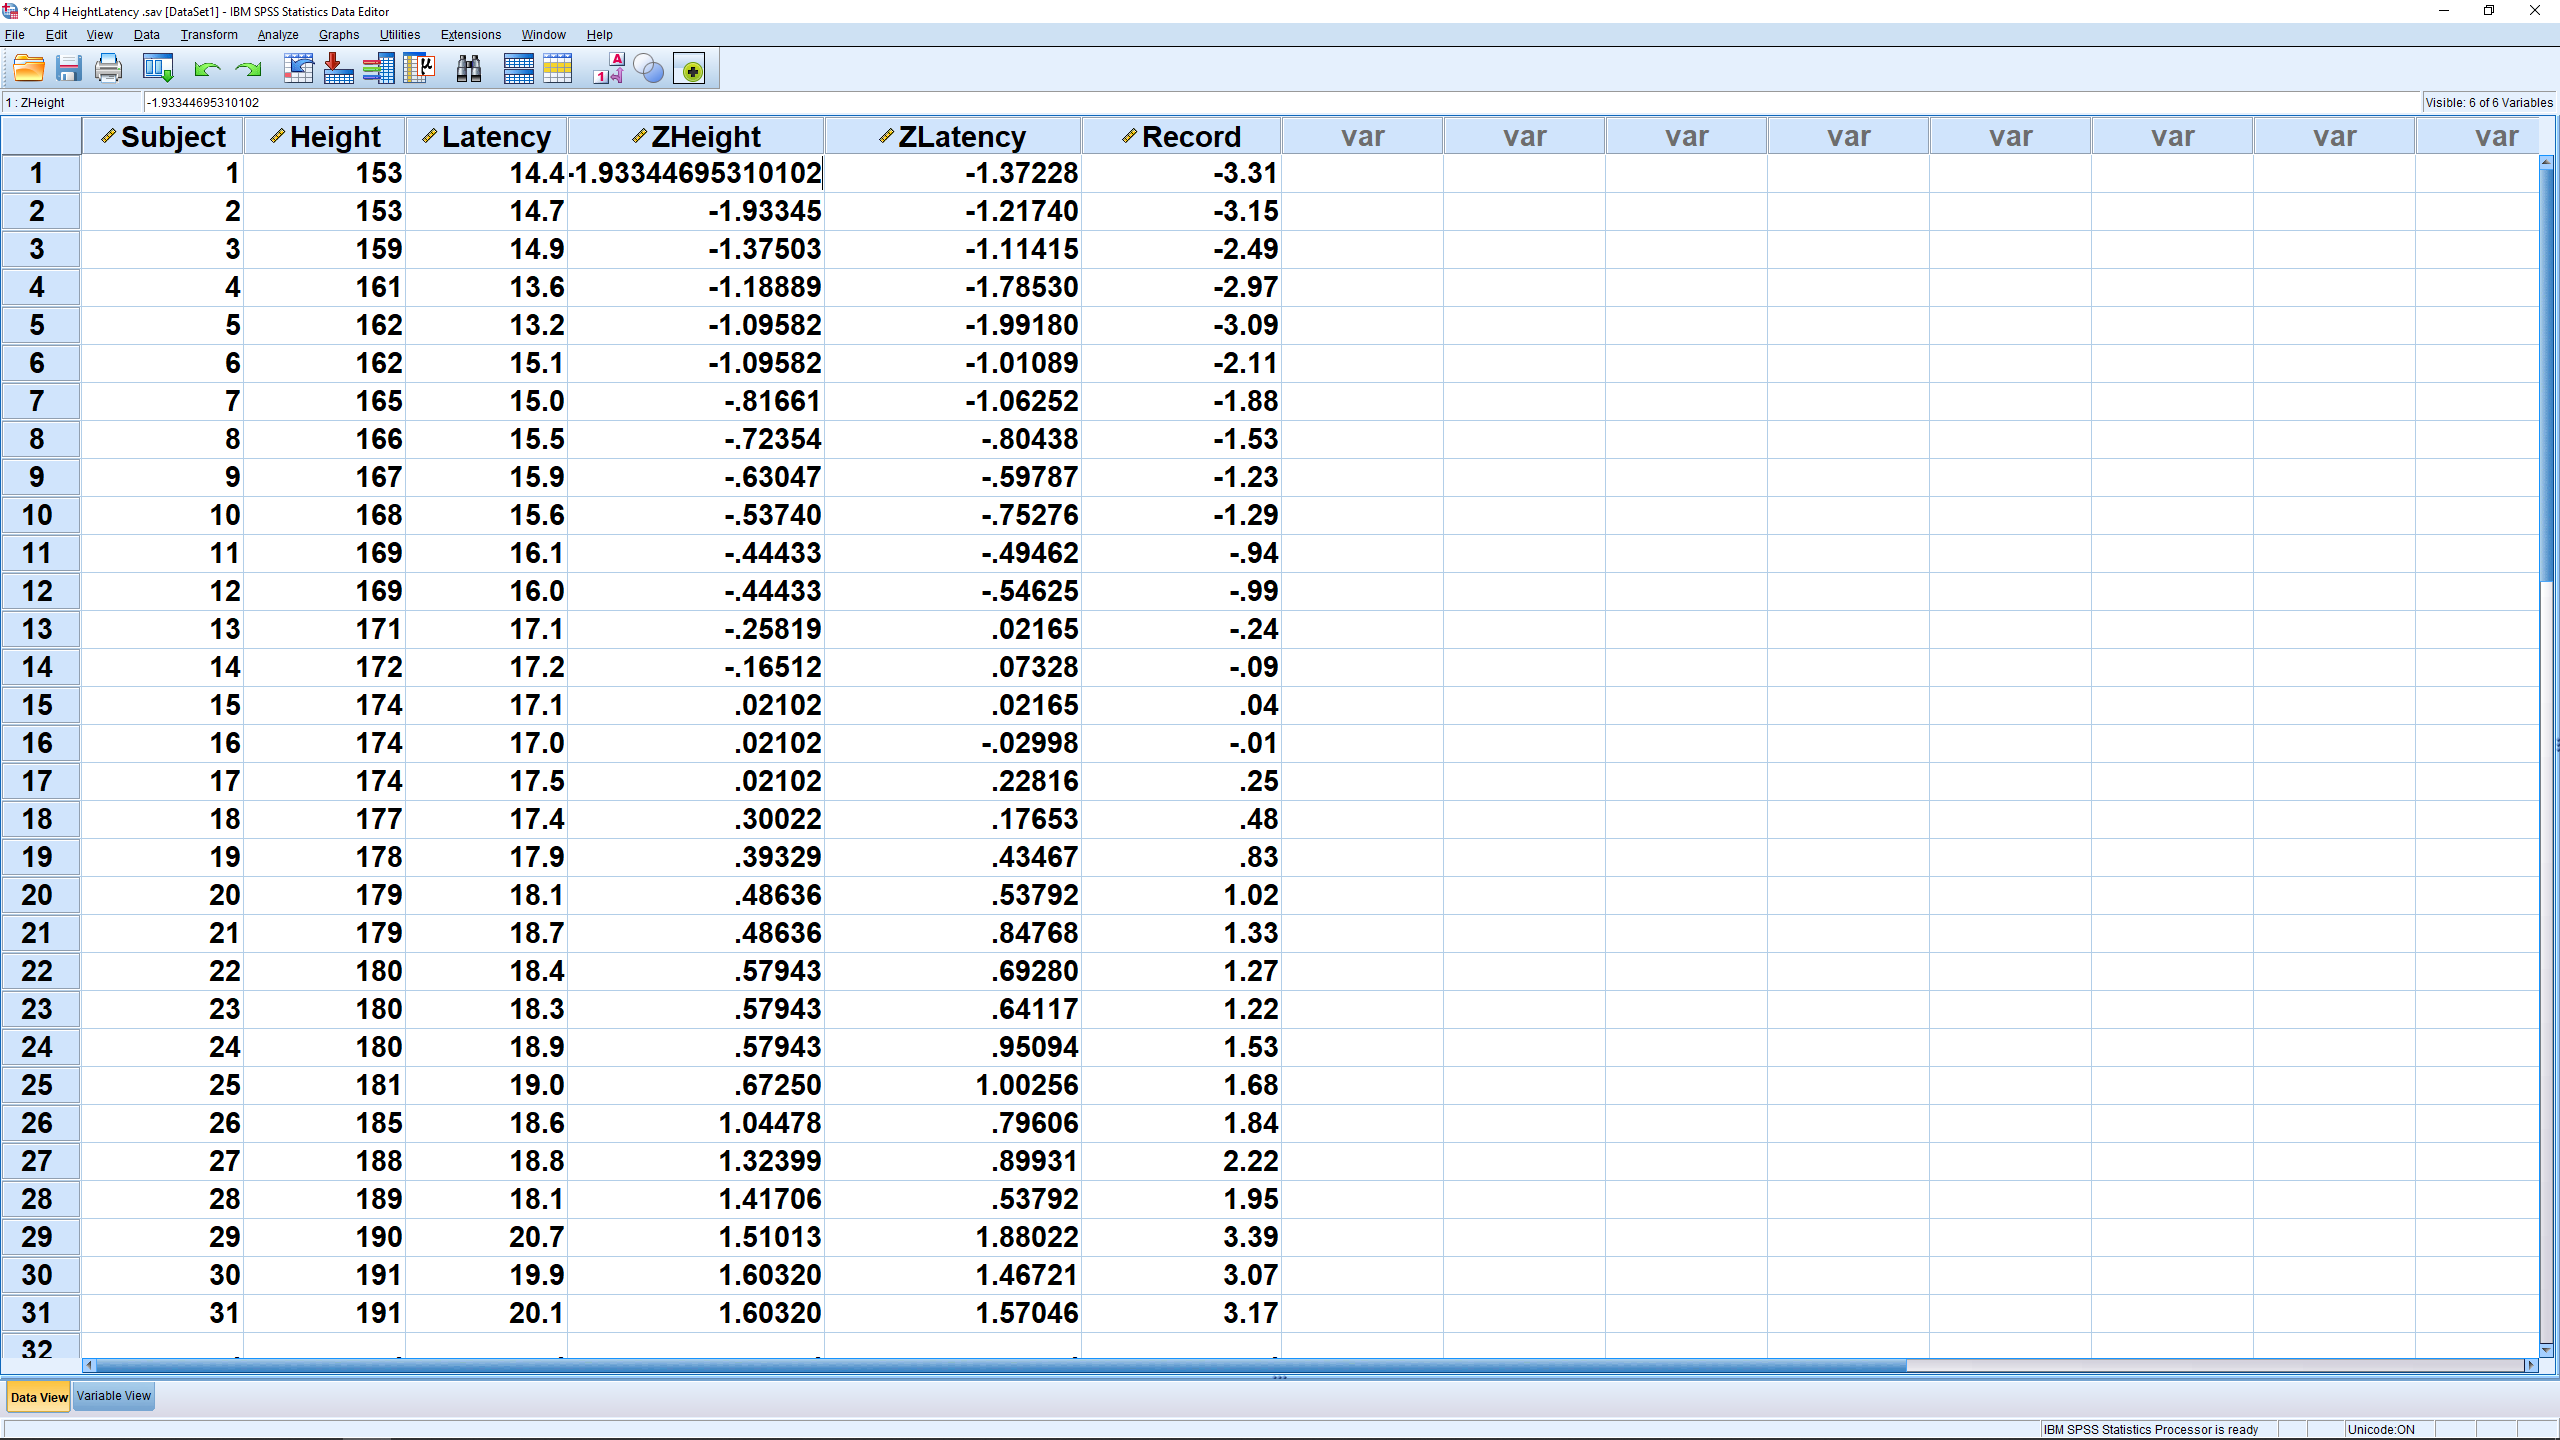
The new variable shows clearly on SPSS sheet :
Next we will make a conversion from a quantitative variable to a qualitative variable essentially by dividing the data into classes. First a simple case. Create the new variable Life from the variable Latency as the following :
![\[ {\rm Latency} = \left\{ \begin{array}{c} 1 {\rm \ if\ \ Latency} < 17.5 \\ 2 {\rm \ if\ \ Latency} \geq 17.5 \end{array} \right. \]](https://openpress.usask.ca/app/uploads/quicklatex/quicklatex.com-1a8c1ec13aaaf8e4d16dcfa9ab34569f_l3.png "Rendered by QuickLaTeX.com")
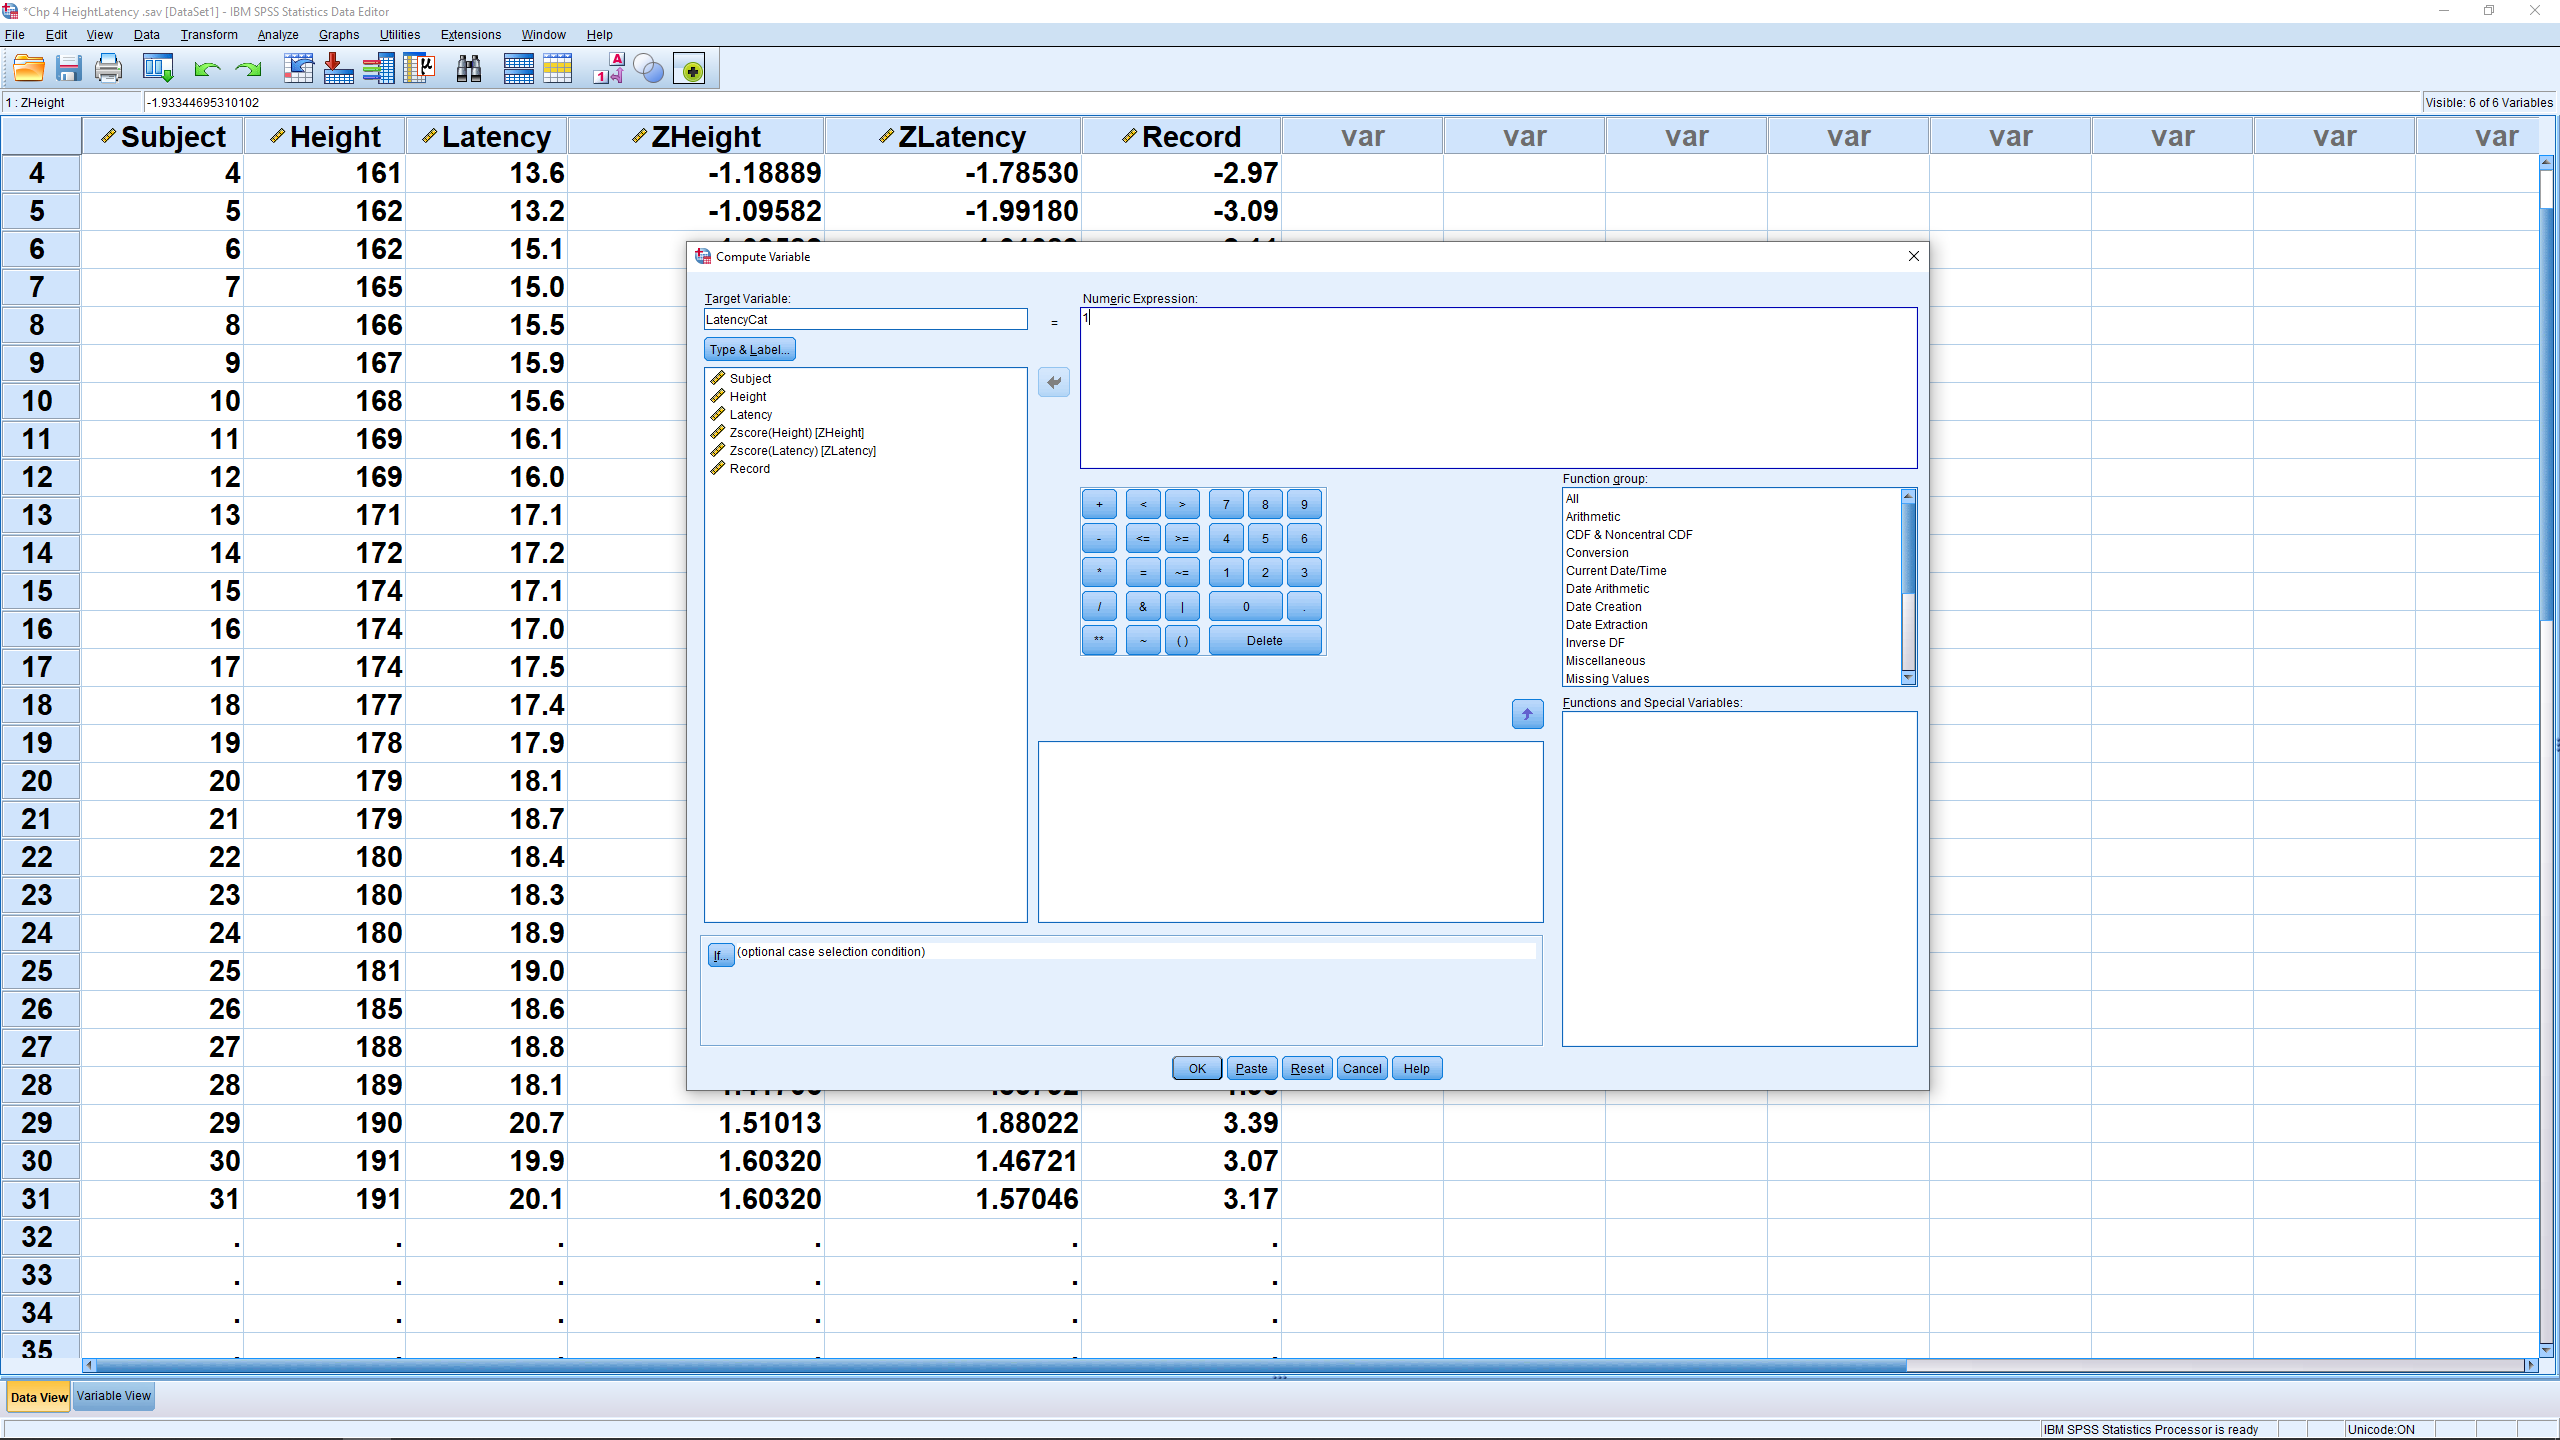
We’ll need to do this in two steps. First pull up Transform  Compute Variable and set it up so that 1 is in the Numeric Expression box. Then hit the If… button at the bottom left hand of the menu window to bring up :
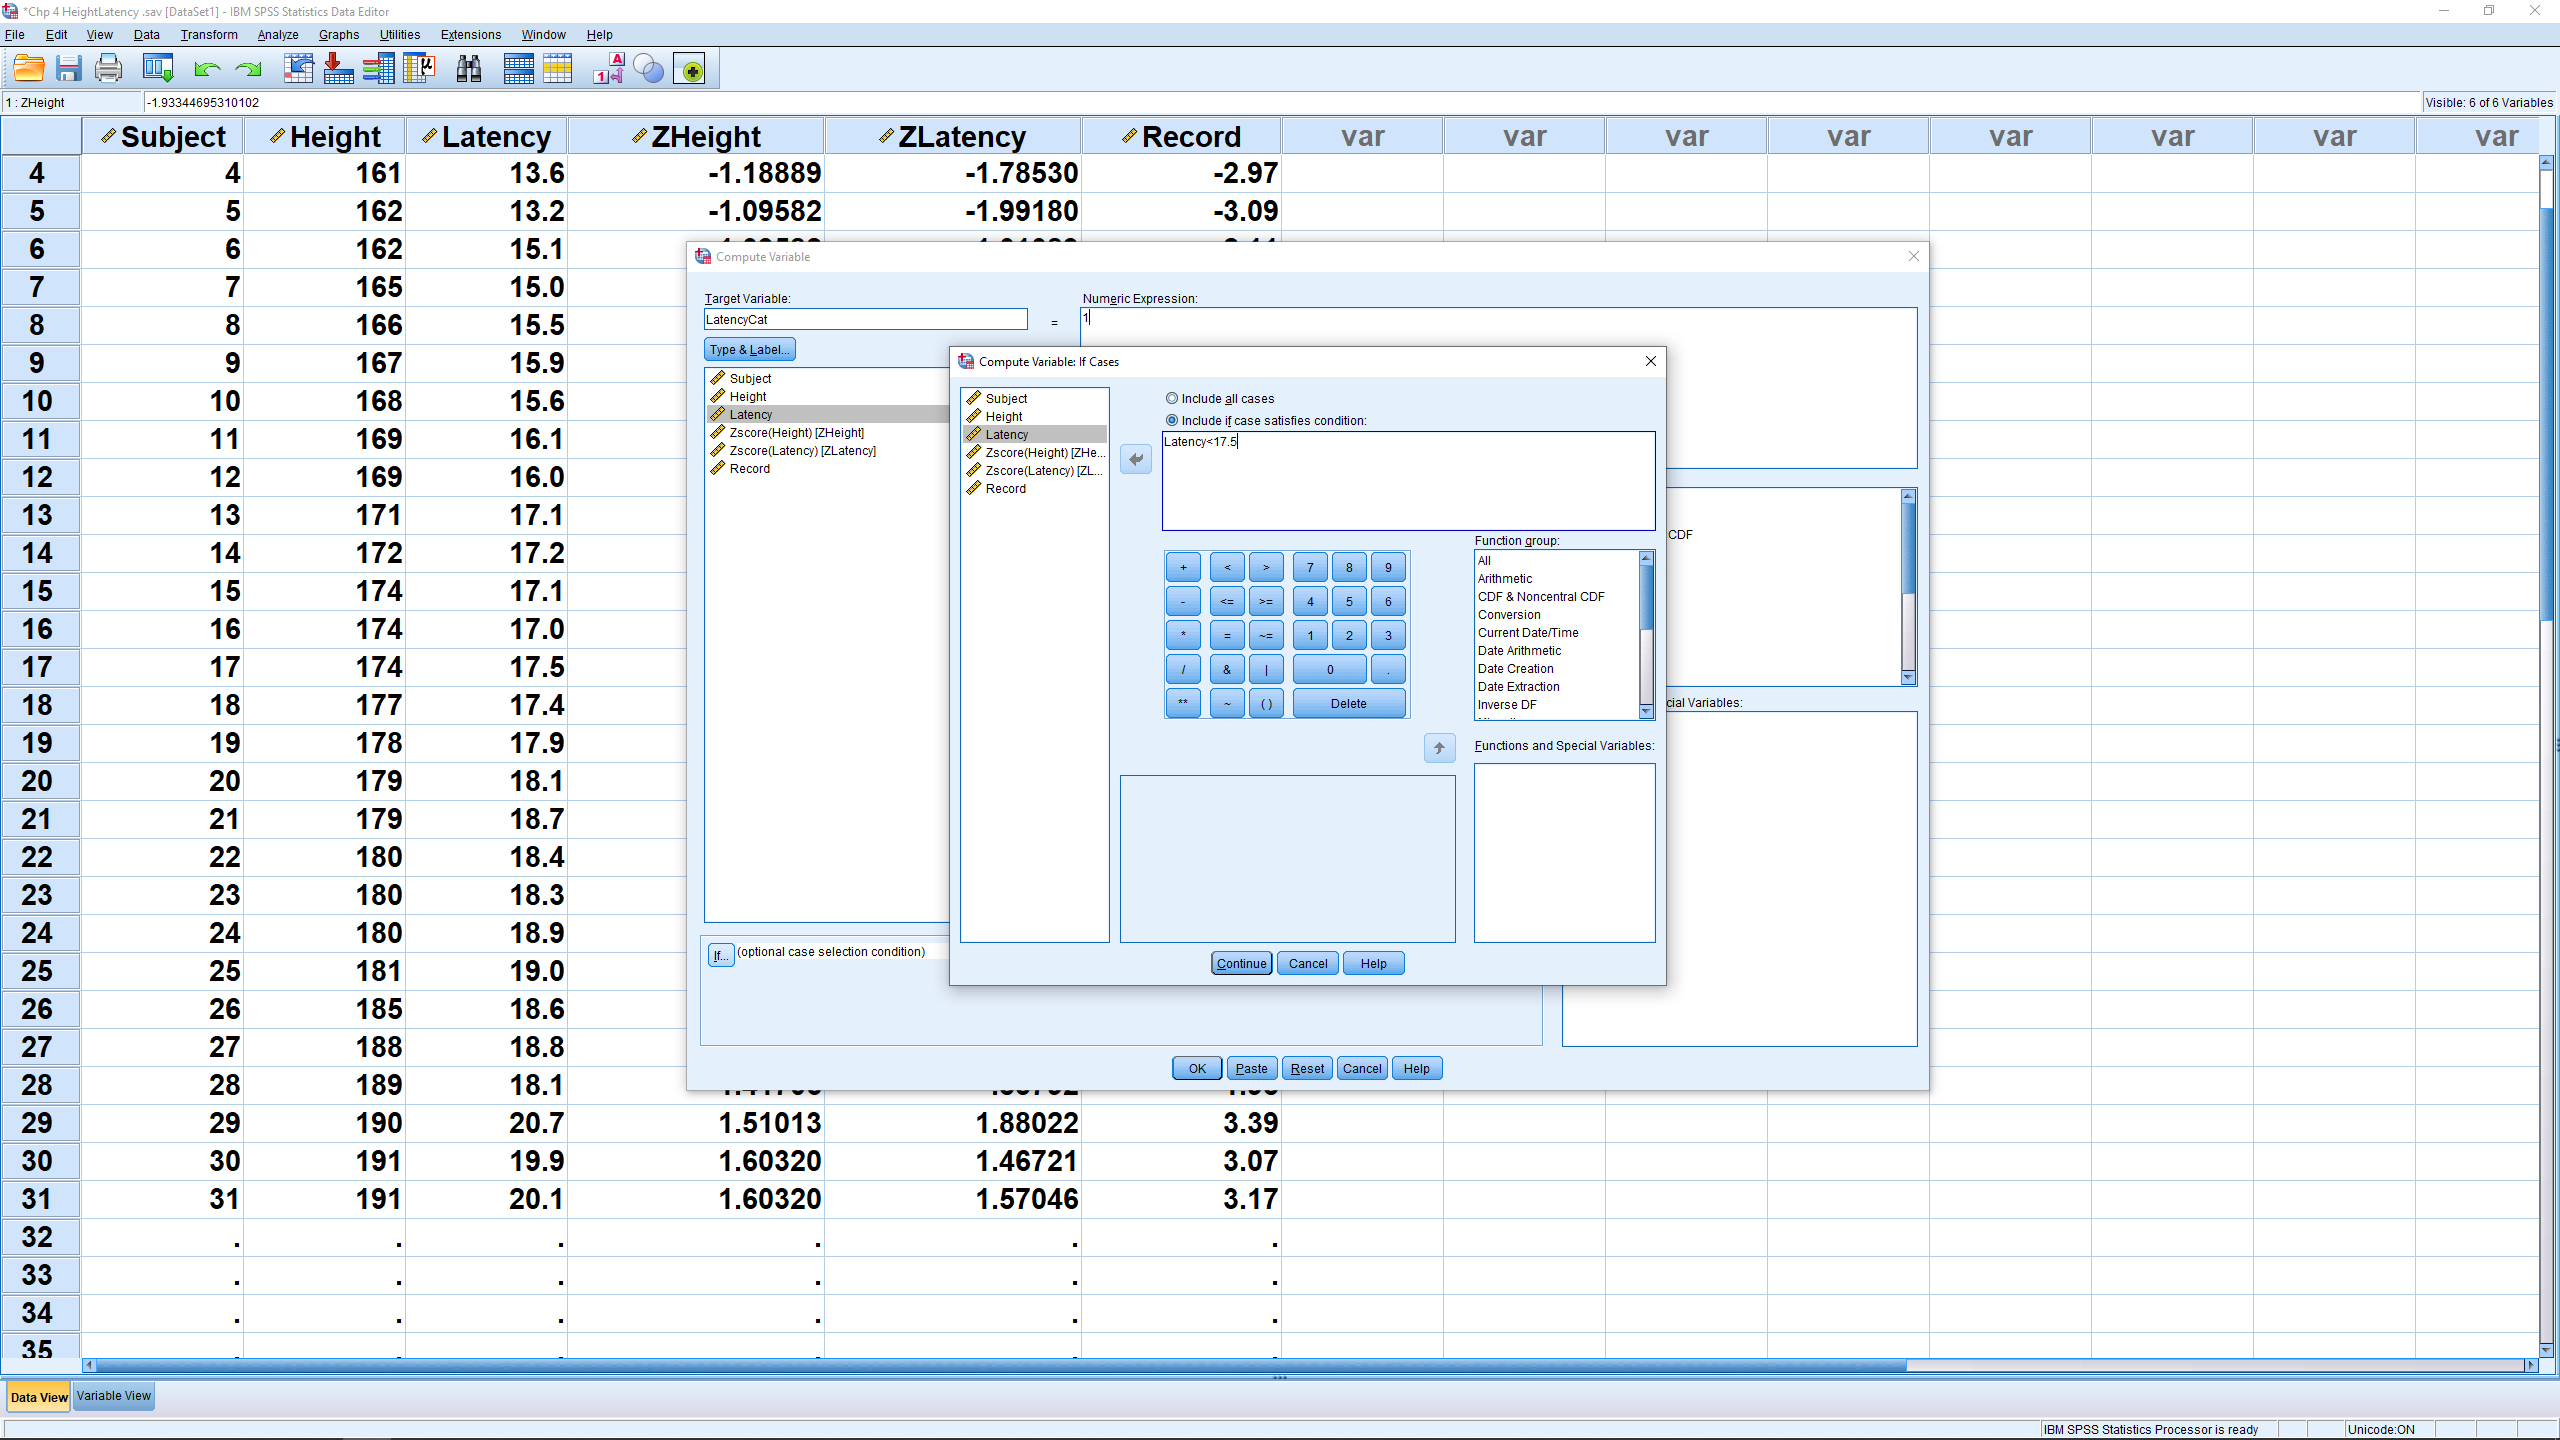
Then click Continue, then hit OK. That will create the new LatencyCat variable, with missing values. Those values will be filled in the next step.
Pull up Transform → Compute Variable again and, leaving LatencyCat where it is, put 2 in the Numeric Expression box, then hit the “If” button again and change the expression in the condition box, then hit Continue, then OK. Now LatencyCat is either 1 or 2 with no missing values :