
16. Non-parametric Tests
16.8 SPSS Lesson 14: Non-parametric Tests
16.8.1 Mann Whitney/Wilcoxson Rank Sum
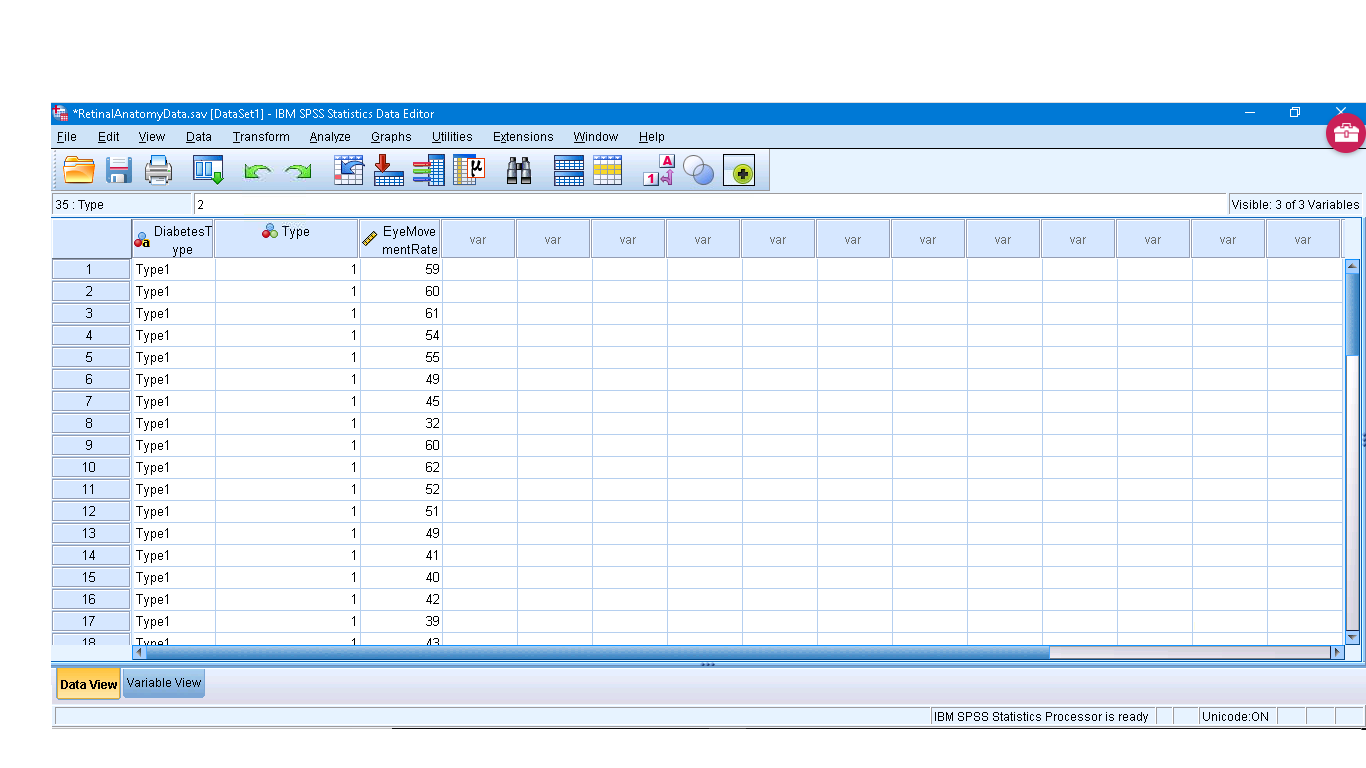
The Mann Whitney/Wilcoxson Rank Sum tests is a non-parametric alternative to the independent sample  -test. So the data file will be organized the same way in SPSS: one independent variable with two qualitative levels and one independent variable. Open “RetinalAnatomyData.sav” from the textbook Data Sets :
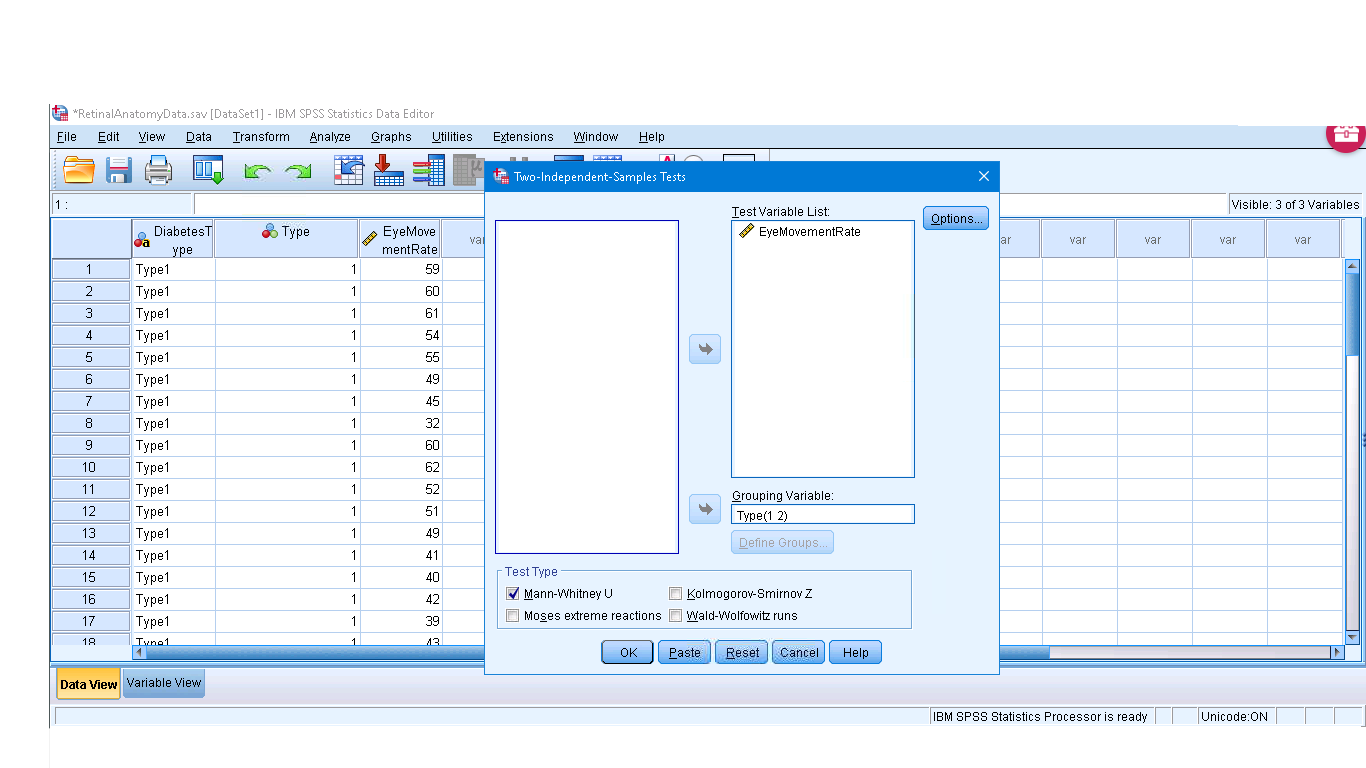
Choose Analyze  Nonparametric Tests Legacy Dialogues 2 Independent Samples. Then set-up :
Running the test produces :
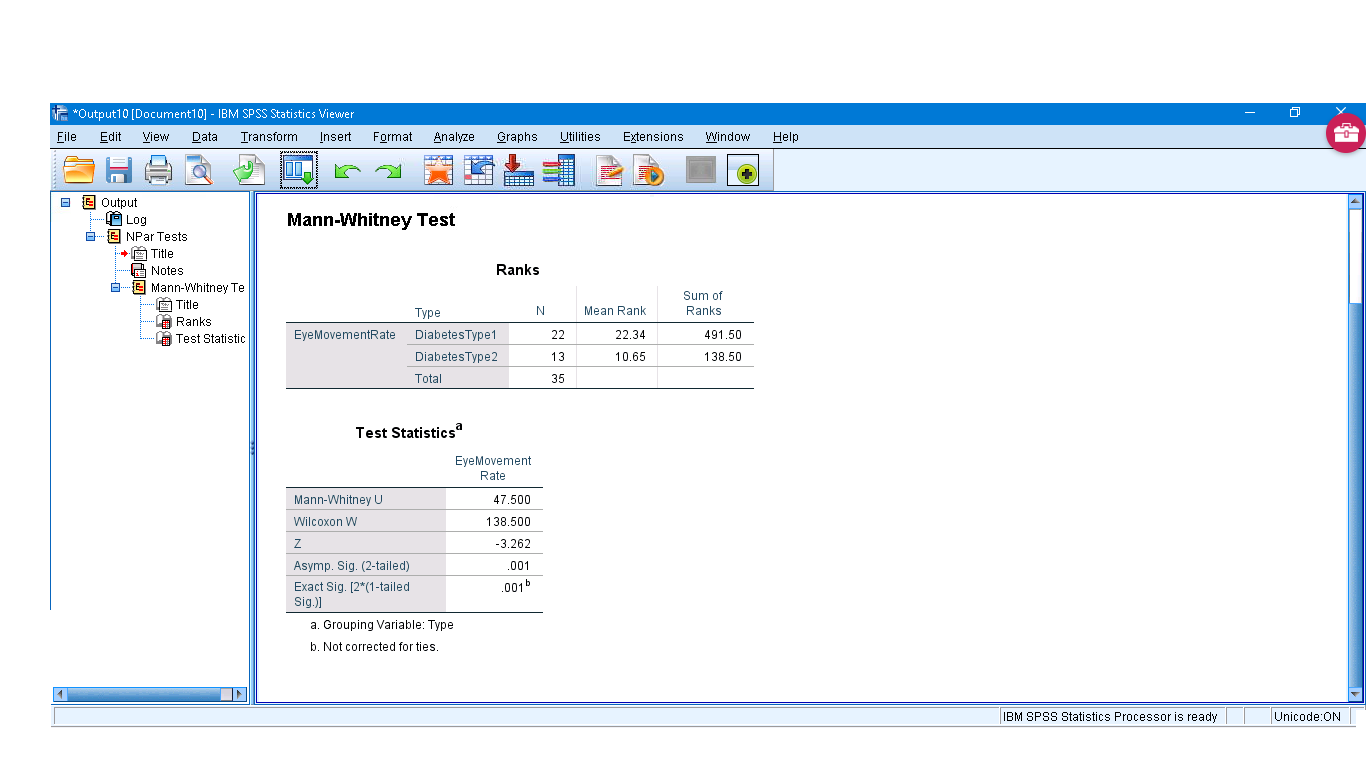
The first table has sums of the ranks including the sum of ranks of the smaller sample,  , and the sample sizes
  and
and  that you could use to manually compute
  if you wanted to. The test statistic shows up in the second table along with
  which means that you can marginally reject
  for a two-tail test. When we did this test by hand, we required ,
  so that the
  test statistic would be valid. In the SPSS output two other test statistics,
  and
and  that can be used for smaller sample sizes. The exact
  -value is given in the last line of the output; the asymptotic -value is the one associated with . When the asymptotic -value equals the exact one, then the test statistic is a good approximation — this should happen when , .
16.8.2 Paired Wilcoxon Signed Rank Test and Paired Sign Test
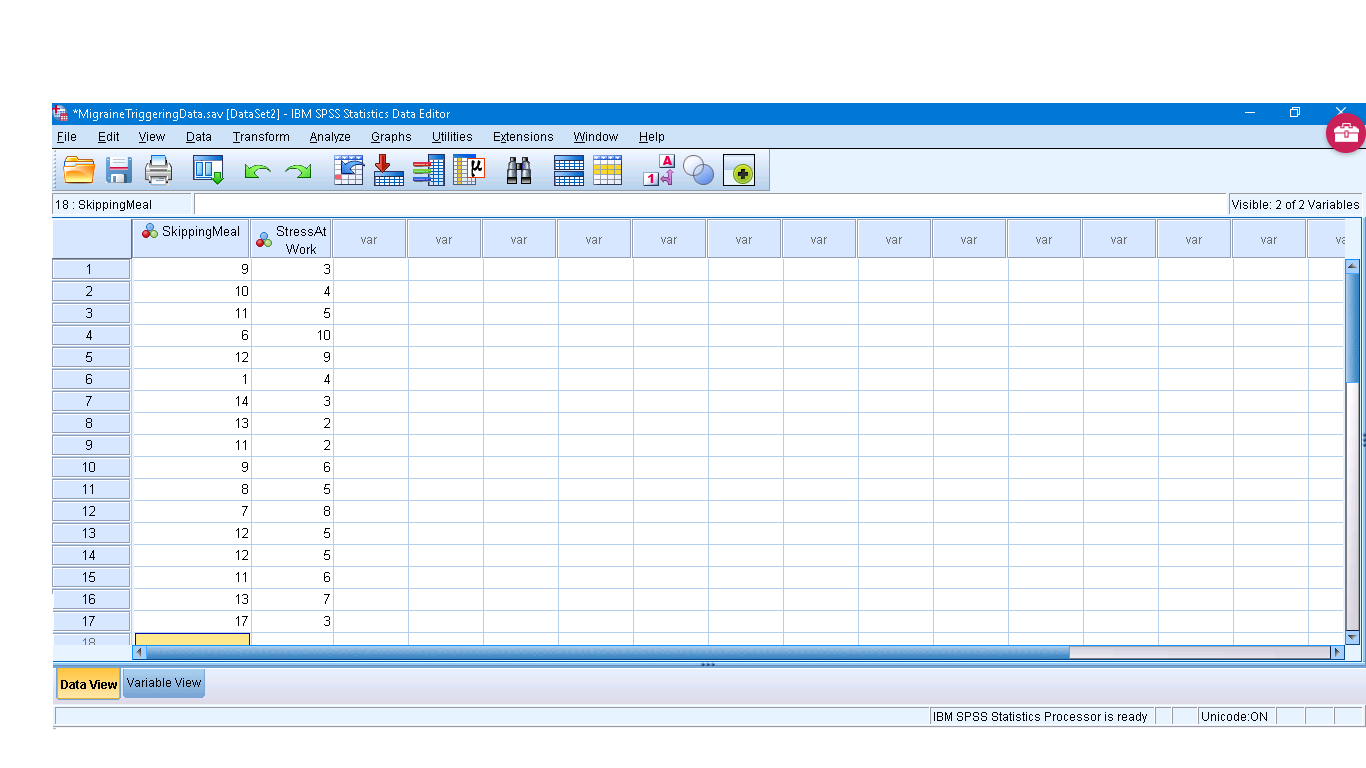
Open “MigraineTriggeringData.sav” from the textbook Data Sets :
We will see if there is a significant difference between pay and security (
 ). Pull up Analyze Nonparametric Tests Legacy Dialogues 2 Related Samples to get :

The output for the paired Wilcoxon signed rank test is :
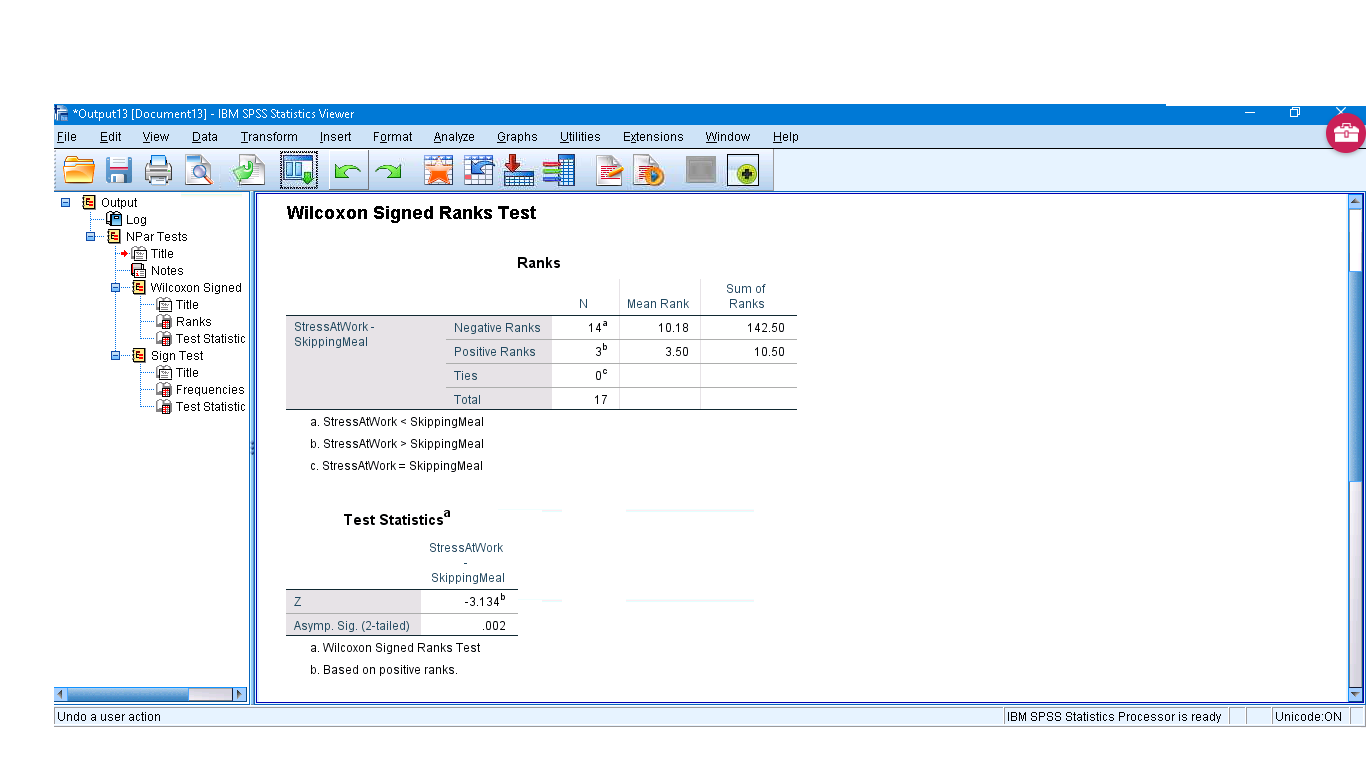
From the output we see that  . The test statistic
  with
with  so the mean difference is significantly different from zero.
The output for the paired sign test ( MD difference  ) is :
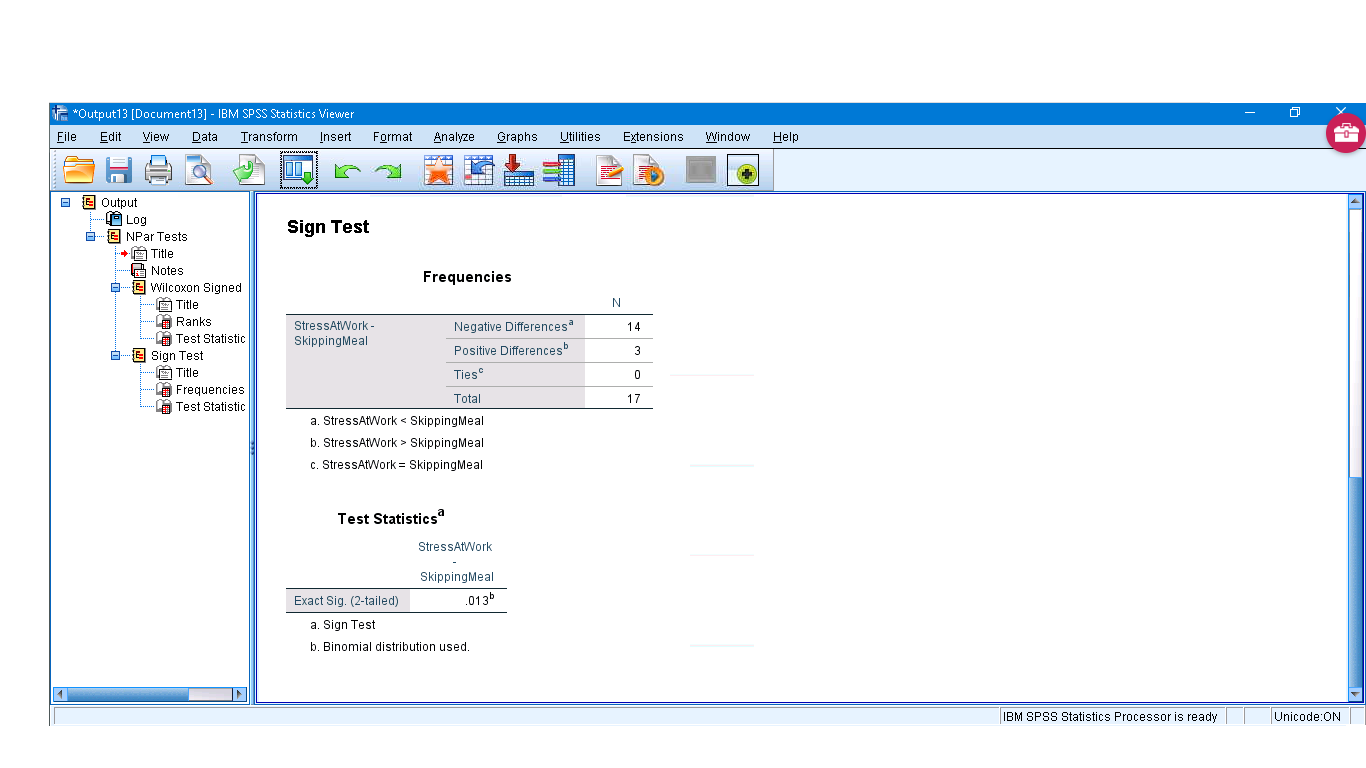
Here we see (remembering the definitions) that  . Since
  we can conclude that “Skipping Meal” is significantly different from “Stress at Work” (more negative differences and the difference is significant).
16.8.3 Kruskal-Wallis Test
Open “CancerTumourReduction.sav” from the textbook Data Sets :
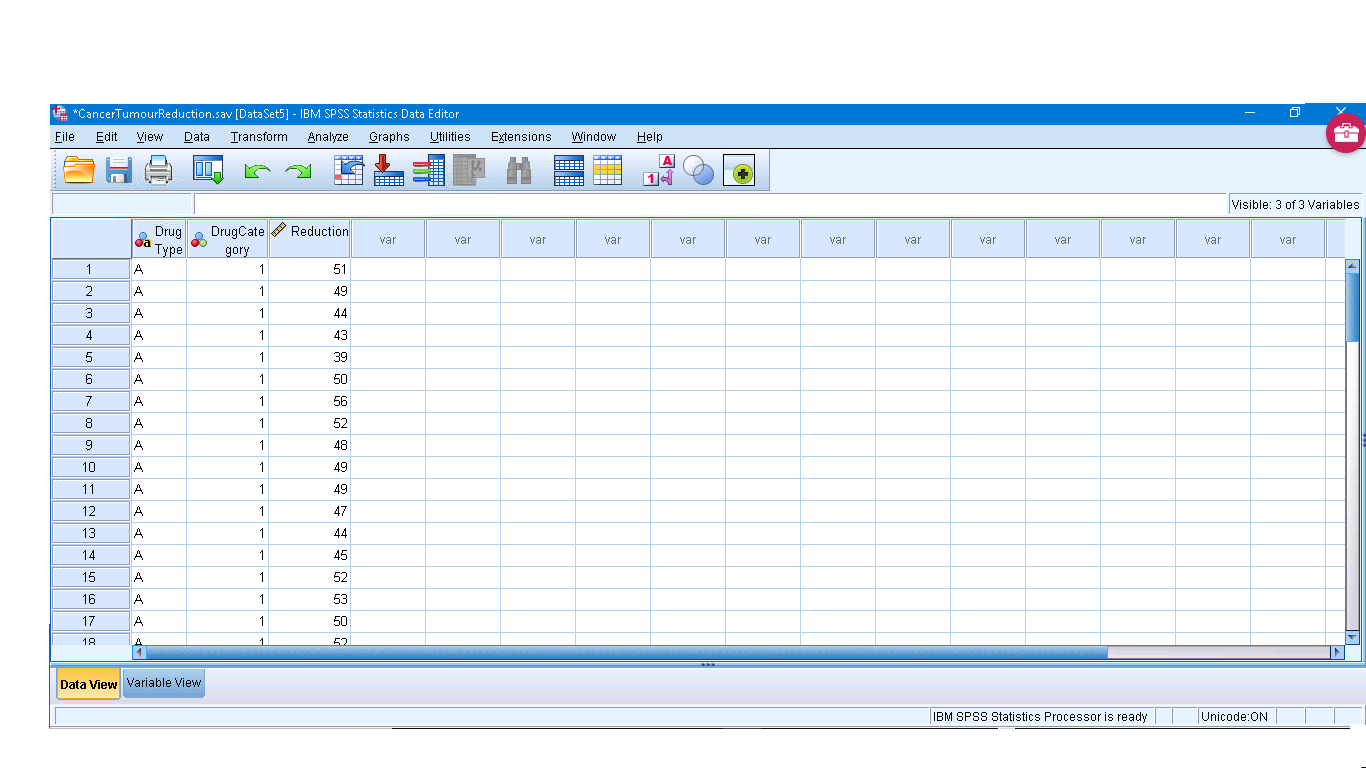
The independent variable, group, has three levels; the dependent variable is diff. Choose Analyze Nonparametric Tests Legacy Dialogues K Independent Samples and set up the dialogue menu this way, with 1 and 3 being the minimum and maximum values defined in the Define Range menu:
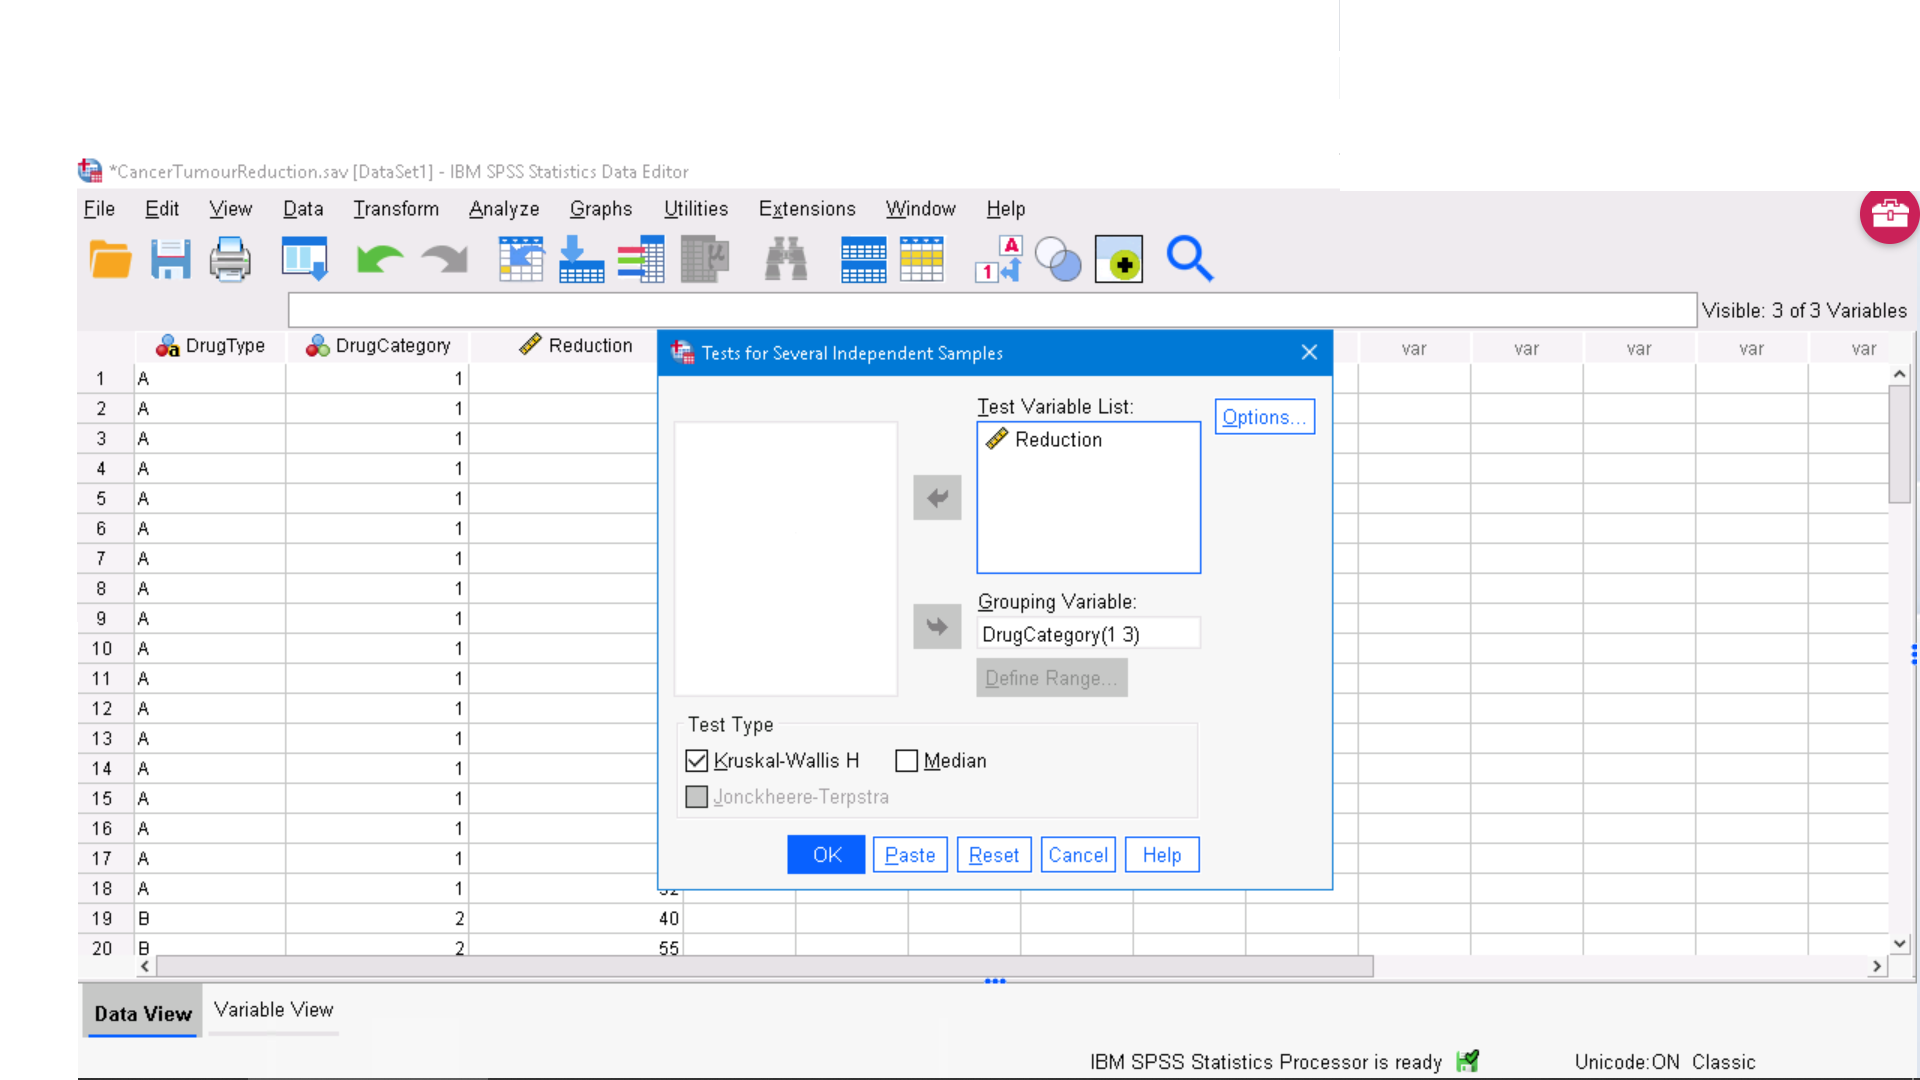
Running the test gives:
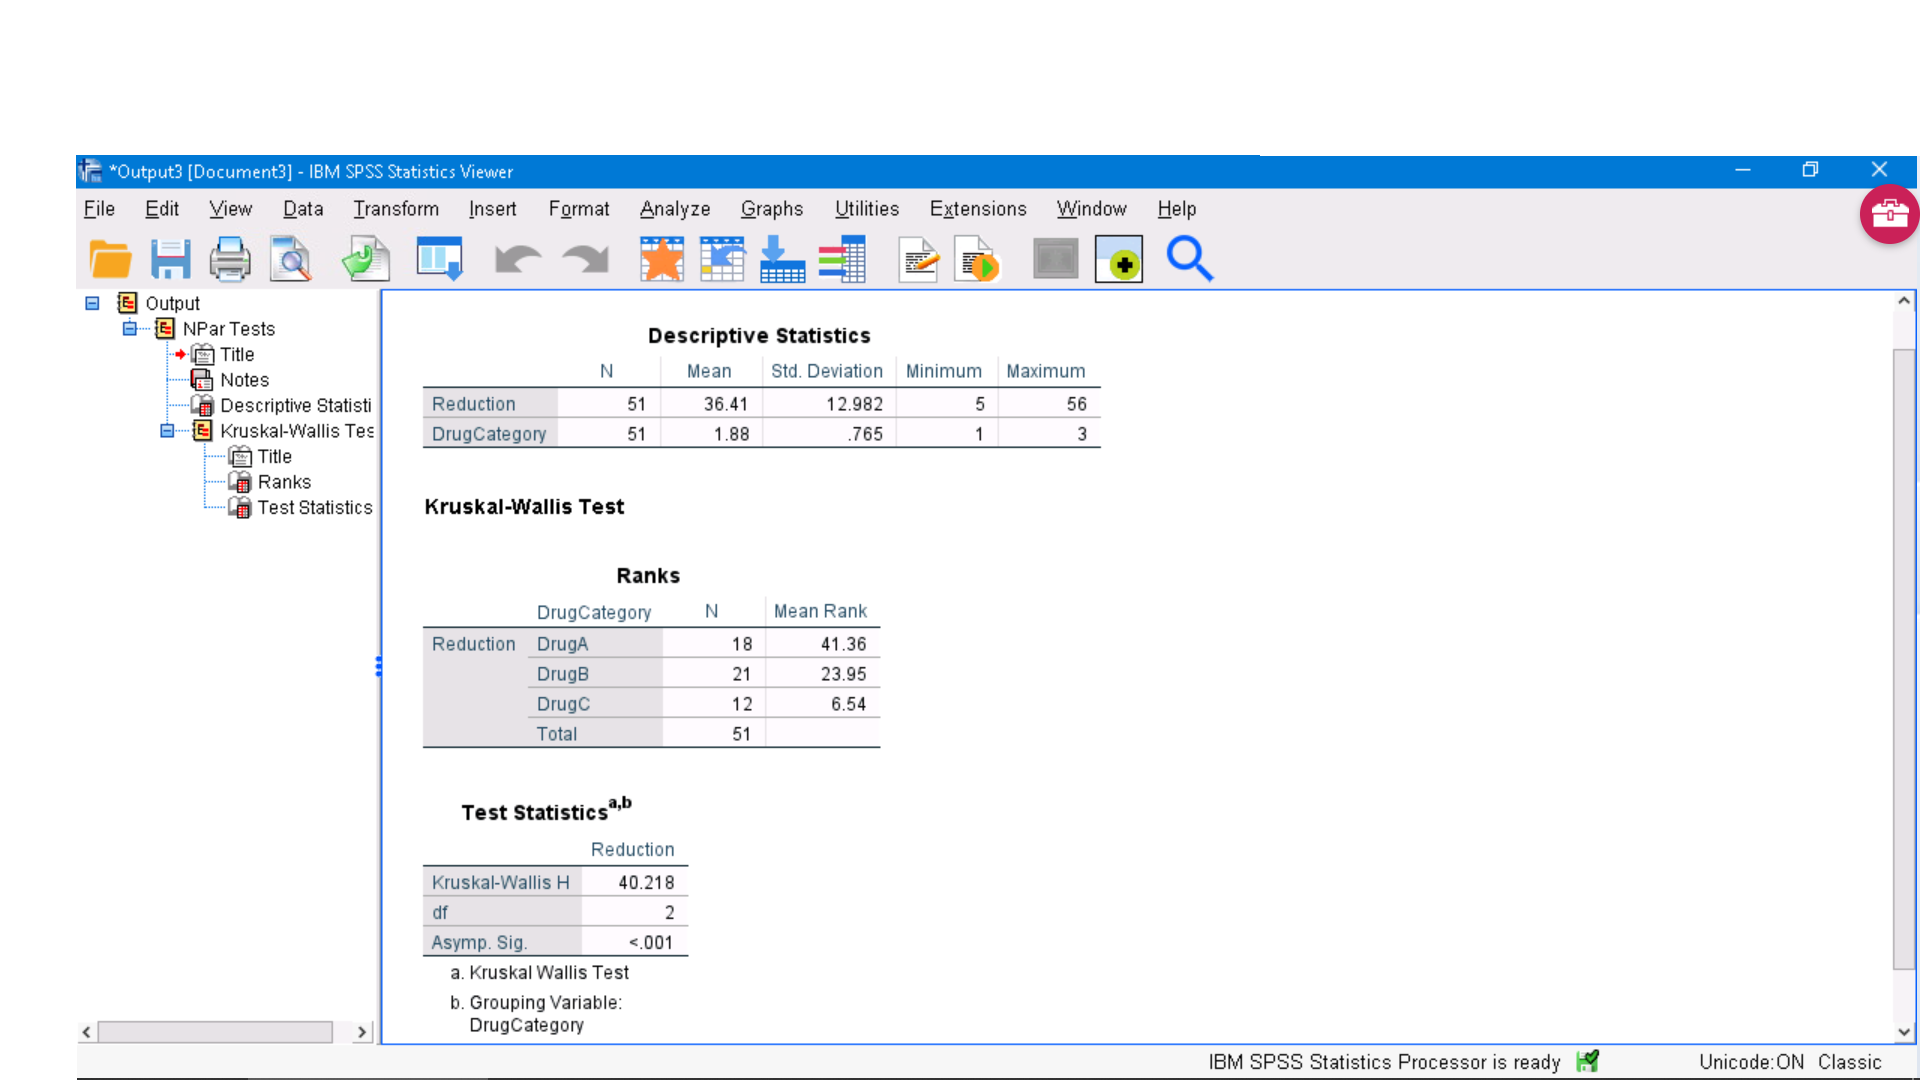
There is enough information to compute the test statistic  which is labeled as Chi-Square in the SPSS output. That is
  and it is significant (
 ) so at least one of the group means is significantly different from the others. Also we see
  . Notice that the sums of the ranks are not given directly but sum of ranks = Mean Rank
  N.
N.
