16. Non-parametric Tests
16.4 Two Sample Wilcoxon Rank Sum Test (Mann-Whitney U Test)
This test is an alternative to the two sample ![]() -test. The test assumes that the population of differences has a symmetric distribution and tests the following hypothesis pair :
-test. The test assumes that the population of differences has a symmetric distribution and tests the following hypothesis pair :
![]() : The means of the two populations are the same.
: The means of the two populations are the same.
![]() : The means of the two populations are the different.
: The means of the two populations are the different.
or
![]() :
: ![]()
![]() :
: ![]()
which is exactly the hypothesis tested by the ![]() -test. The samples are independent (no pairs) and, although this test compares means (parameters) and not medians, it does not use the values of the means to do the comparison — therefore this is a non-parametric test. It is based on a binomial distribution.
-test. The samples are independent (no pairs) and, although this test compares means (parameters) and not medians, it does not use the values of the means to do the comparison — therefore this is a non-parametric test. It is based on a binomial distribution.
The test statistic is
![]()
where
![]()
![]()
![]()
![]()
![]()
Also we need ![]() in order for the
in order for the ![]() distribution to be a good fit to the binomial distribution. This is our first non-parametric test that uses rank. Let’s follow an example to see how it all works.
distribution to be a good fit to the binomial distribution. This is our first non-parametric test that uses rank. Let’s follow an example to see how it all works.
Example 16.6 : Given the following obstacle course times, is the army or marines significantly faster?
Army: 15 18 16 17 13 22 24 17 19 21 26 28
Marines: 14 9 16 19 10 12 11 8 15 18 25
Solution.
0. Data reduction.
We need to assign group 1 to the smaller sample. So let
group 1 = Marines (M) and ![]()
group 2 = Army (A) and ![]()
We don’t need to compute the means to compare them but just out of curiosity we note that ![]() and
and ![]() so if there is a significant difference between the means then the marines are faster.
so if there is a significant difference between the means then the marines are faster.
This is our first rank test so we need to apply the methods of Section 16.1. For this test, we rank the combined data :
| Group | Time | Rank | Count |
| M | 8 | 1 | 1 |
| M | 9 | 2 | 2 |
| M | 10 | 3 | 3 |
| M | 11 | 4 | 4 |
| M | 12 | 5 | 5 |
| A | 13 | 6 | 6 |
| M | 14 | 7 | 7 |
| M | 15 | 8.5 | 8 |
| A | 15 | 8.5 | 9 |
| M | 16 | 10.5 | 10 |
| A | 16 | 10.5 | 11 |
| A | 17 | 12.5 | 12 |
| A | 17 | 12.5 | 13 |
| M | 18 | 14.5 | 14 |
| A | 18 | 14.5 | 15 |
| M | 19 | 16.5 | 16 |
| A | 19 | 16.5 | 17 |
| A | 21 | 18 | 18 |
| A | 22 | 19 | 19 |
| A | 24 | 20 | 20 |
| M | 25 | 21 | 21 |
| A | 26 | 22 | 22 |
| A | 28 | 23 | 23 |
Notice how the last Count column is useful for assigning ranks to the ties. We have also drawn boxes around the marines because they are the smaller group and we need the sum of the ranks of the smaller group :
![]()
1. Hypothesis.
![]()
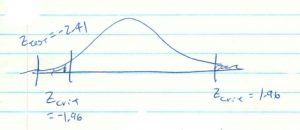
2. Critical statistic.
Using the last (![]() ) line in the t Distribution Table with
) line in the t Distribution Table with ![]() for the two-tailed test we find
for the two-tailed test we find
![]()
3. Test statistic.
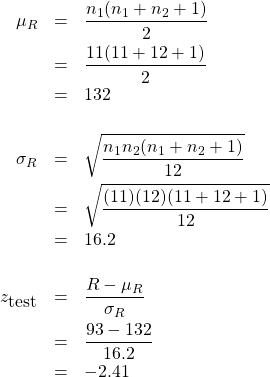
We already have ![]() . Now compute:
. Now compute:

4. Decision.

Reject ![]() .
.
5. Interpretation. The marines are significantly faster.
▢

