16. Non-parametric Tests
16.10 Runs Test
The runs test is a test for randomness. All statistical tests require random samples so this test may be used to check that a sample has been randomly collected.
Definition : A maximal succession of identical (typically letters) in a sequence of values is a run.
Example 16.10 : How many runs are there in each of the following sequences?
F F F M M F F F F M
H H H T T T T
A A B B A A B B A A B B
Count the runs. In this table you can see a bit of highlighting to help visually separate the runs.
| F F F M M F F F F M | 4 runs |
| H H H T T T T | 2 runs |
| A A B B A A B B A A B B | 6 runs |
▢
If there are only 2 possible values for the outcome then the runs test can be used to test :
![]()
The critical statistic is ![]() from the Number of Runs Critical Values Table. We need
from the Number of Runs Critical Values Table. We need ![]() and
and ![]() and
and ![]() which are the number of times value 1 shows up in the sequence and the number of times value 2 shows up in the sequence. There will be two values for
which are the number of times value 1 shows up in the sequence and the number of times value 2 shows up in the sequence. There will be two values for ![]() for each choice of
for each choice of ![]() ,
, ![]() and
and ![]() .
.
The test statistic is ![]() = the number of runs in the sequence.
= the number of runs in the sequence.
Example 16.11 : Determine if the following sequence is random :
F F F M M F F F F M F M M M F F F F M M F F F M M
0. Count the runs.
F F F M M F F F F M F M M M F F F F M M F F F M M
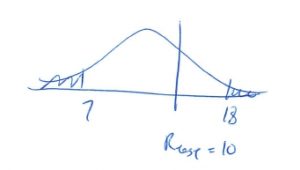
There are 10 runs.
Here ![]() ,
, ![]() (number of F values) and
(number of F values) and ![]() (number of M values). Following the standard hypothesis testing steps :
(number of M values). Following the standard hypothesis testing steps :
1. Hypothesis.
![]() : Sequence is random.
: Sequence is random.
![]() : Sequence is not random.
: Sequence is not random.
2. Critical statistic.
From the Number of Runs Critical Values Table with ![]() ,
, ![]() and
and ![]() find
find
![]()
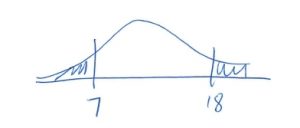
Note that there are 2 values. Think of them this way :

3. Test statistic.
![]() .
.
4. Decision.

Do not reject ![]() .
.
5. Interpretation.
At ![]() we cannot say that the sequence is not random.
we cannot say that the sequence is not random.
▢
We can use the runs test to test if a sample was selected from the population at random. To test if we have a random sample — the fundamental assumption behind every statistical test. Let’s see how that works in the next example.
Example 16.12 : Was the following data collected at random? (Note that in order for this test to work, the data need remain in the order they were collected.)
18, 36, 19, 22, 25, 44, 23, 27, 27, 35, 19, 43, 37, 32, 28, 43, 46, 19, 20, 22
0. Count the runs.
First we need to convert this sequence to one with 2 values. Use the median to do that. The median can be found (by putting the numbers in order as usual) to be 27. Assign a ![]() to the values above the median and a
to the values above the median and a ![]() to those below, discard values equal to the median :
to those below, discard values equal to the median :
– + – – – + – + – + + + + + + – – –
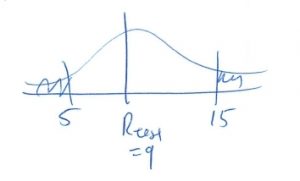
This gives 9 runs.
Now let’s do the hypothesis test :
1. Hypothesis.
![]() : the values came at random.
: the values came at random.
![]() : no they didn’t.
: no they didn’t.
2. Critical statistic.
From the Number of Runs Critical Values Table using ![]() ,
, ![]() (no. of
(no. of ![]() ) and
) and ![]() (no. of
(no. of ![]() ) find
) find
![]()
3. Test statistic.
![]() .
.
4. Decision.

Do not reject ![]() .
.
5. Interpretation.
The sequence appears to be random.
▢

