10. Comparing Two Population Means
10.5 Confidence Intervals for the Difference of Two Means
The form of the confidence interval is
![]()
but, as with hypothesis testing, we have two cases to choose from to get the formula for ![]() :
:
Case 1 : Variances of the 2 populations unequal}
![Rendered by QuickLaTeX.com \[E = t_{\cal{C}} \sqrt{\frac{s^2_1}{n_1} + \frac{s^2_2}{n_2}}\]](https://openpress.usask.ca/app/uploads/quicklatex/quicklatex.com-fa39a008dda4deb4e8d032ac2b8751df_l3.png)
where the degrees of freedom to use when looking up ![]() in the t Distribution Table is
in the t Distribution Table is
![]()
Case 2 : Variances of the 2 populations equal
![Rendered by QuickLaTeX.com \[E = t_{\cal{C}} \sqrt{\frac{(n_1-1)s^2_1 + (n_2-1)s^2_2}{n_1+n_2-2}} \sqrt{\frac{1}{n_1}+ \frac{1}{n_2}}\]](https://openpress.usask.ca/app/uploads/quicklatex/quicklatex.com-eb2c4681146a5ce14612fcd80a92d421_l3.png)
where we use
![]()
when looking up ![]() .
.
To select the appropriate formula for ![]() we need to do a preliminary hypothesis test on
we need to do a preliminary hypothesis test on ![]() . An odd combination of hypothesis test followed by confidence interval calculation.
. An odd combination of hypothesis test followed by confidence interval calculation.
Insight! By now you should have noticed that the formulae for ![]() are just
are just ![]() times standard error of the mean. This whole
times standard error of the mean. This whole ![]() -transformation thing should be becoming somewhat transparent.
-transformation thing should be becoming somewhat transparent.
Example 10.6 : Find the 95![]() confidence interval for
confidence interval for ![]() for the data of Example 10.4 :
for the data of Example 10.4 :
Solution :
First use ![]() -test to see which formula to use. We did this already in Example 10.4 (the data come from that question) and found that we believed
-test to see which formula to use. We did this already in Example 10.4 (the data come from that question) and found that we believed ![]() with
with ![]() .
.
Next, look up ![]() in the t Distribution Table for 95
in the t Distribution Table for 95![]() confidence interval for
confidence interval for ![]() :
:
![]()
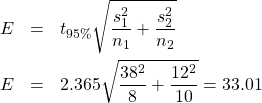
Compute

So

be careful of the order!
▢

