
10. Comparing Two Population Means
10.10 SPSS Lesson 7: Paired Sample t-Test
To follow along, load in the Data Set “Methadone.sav”:
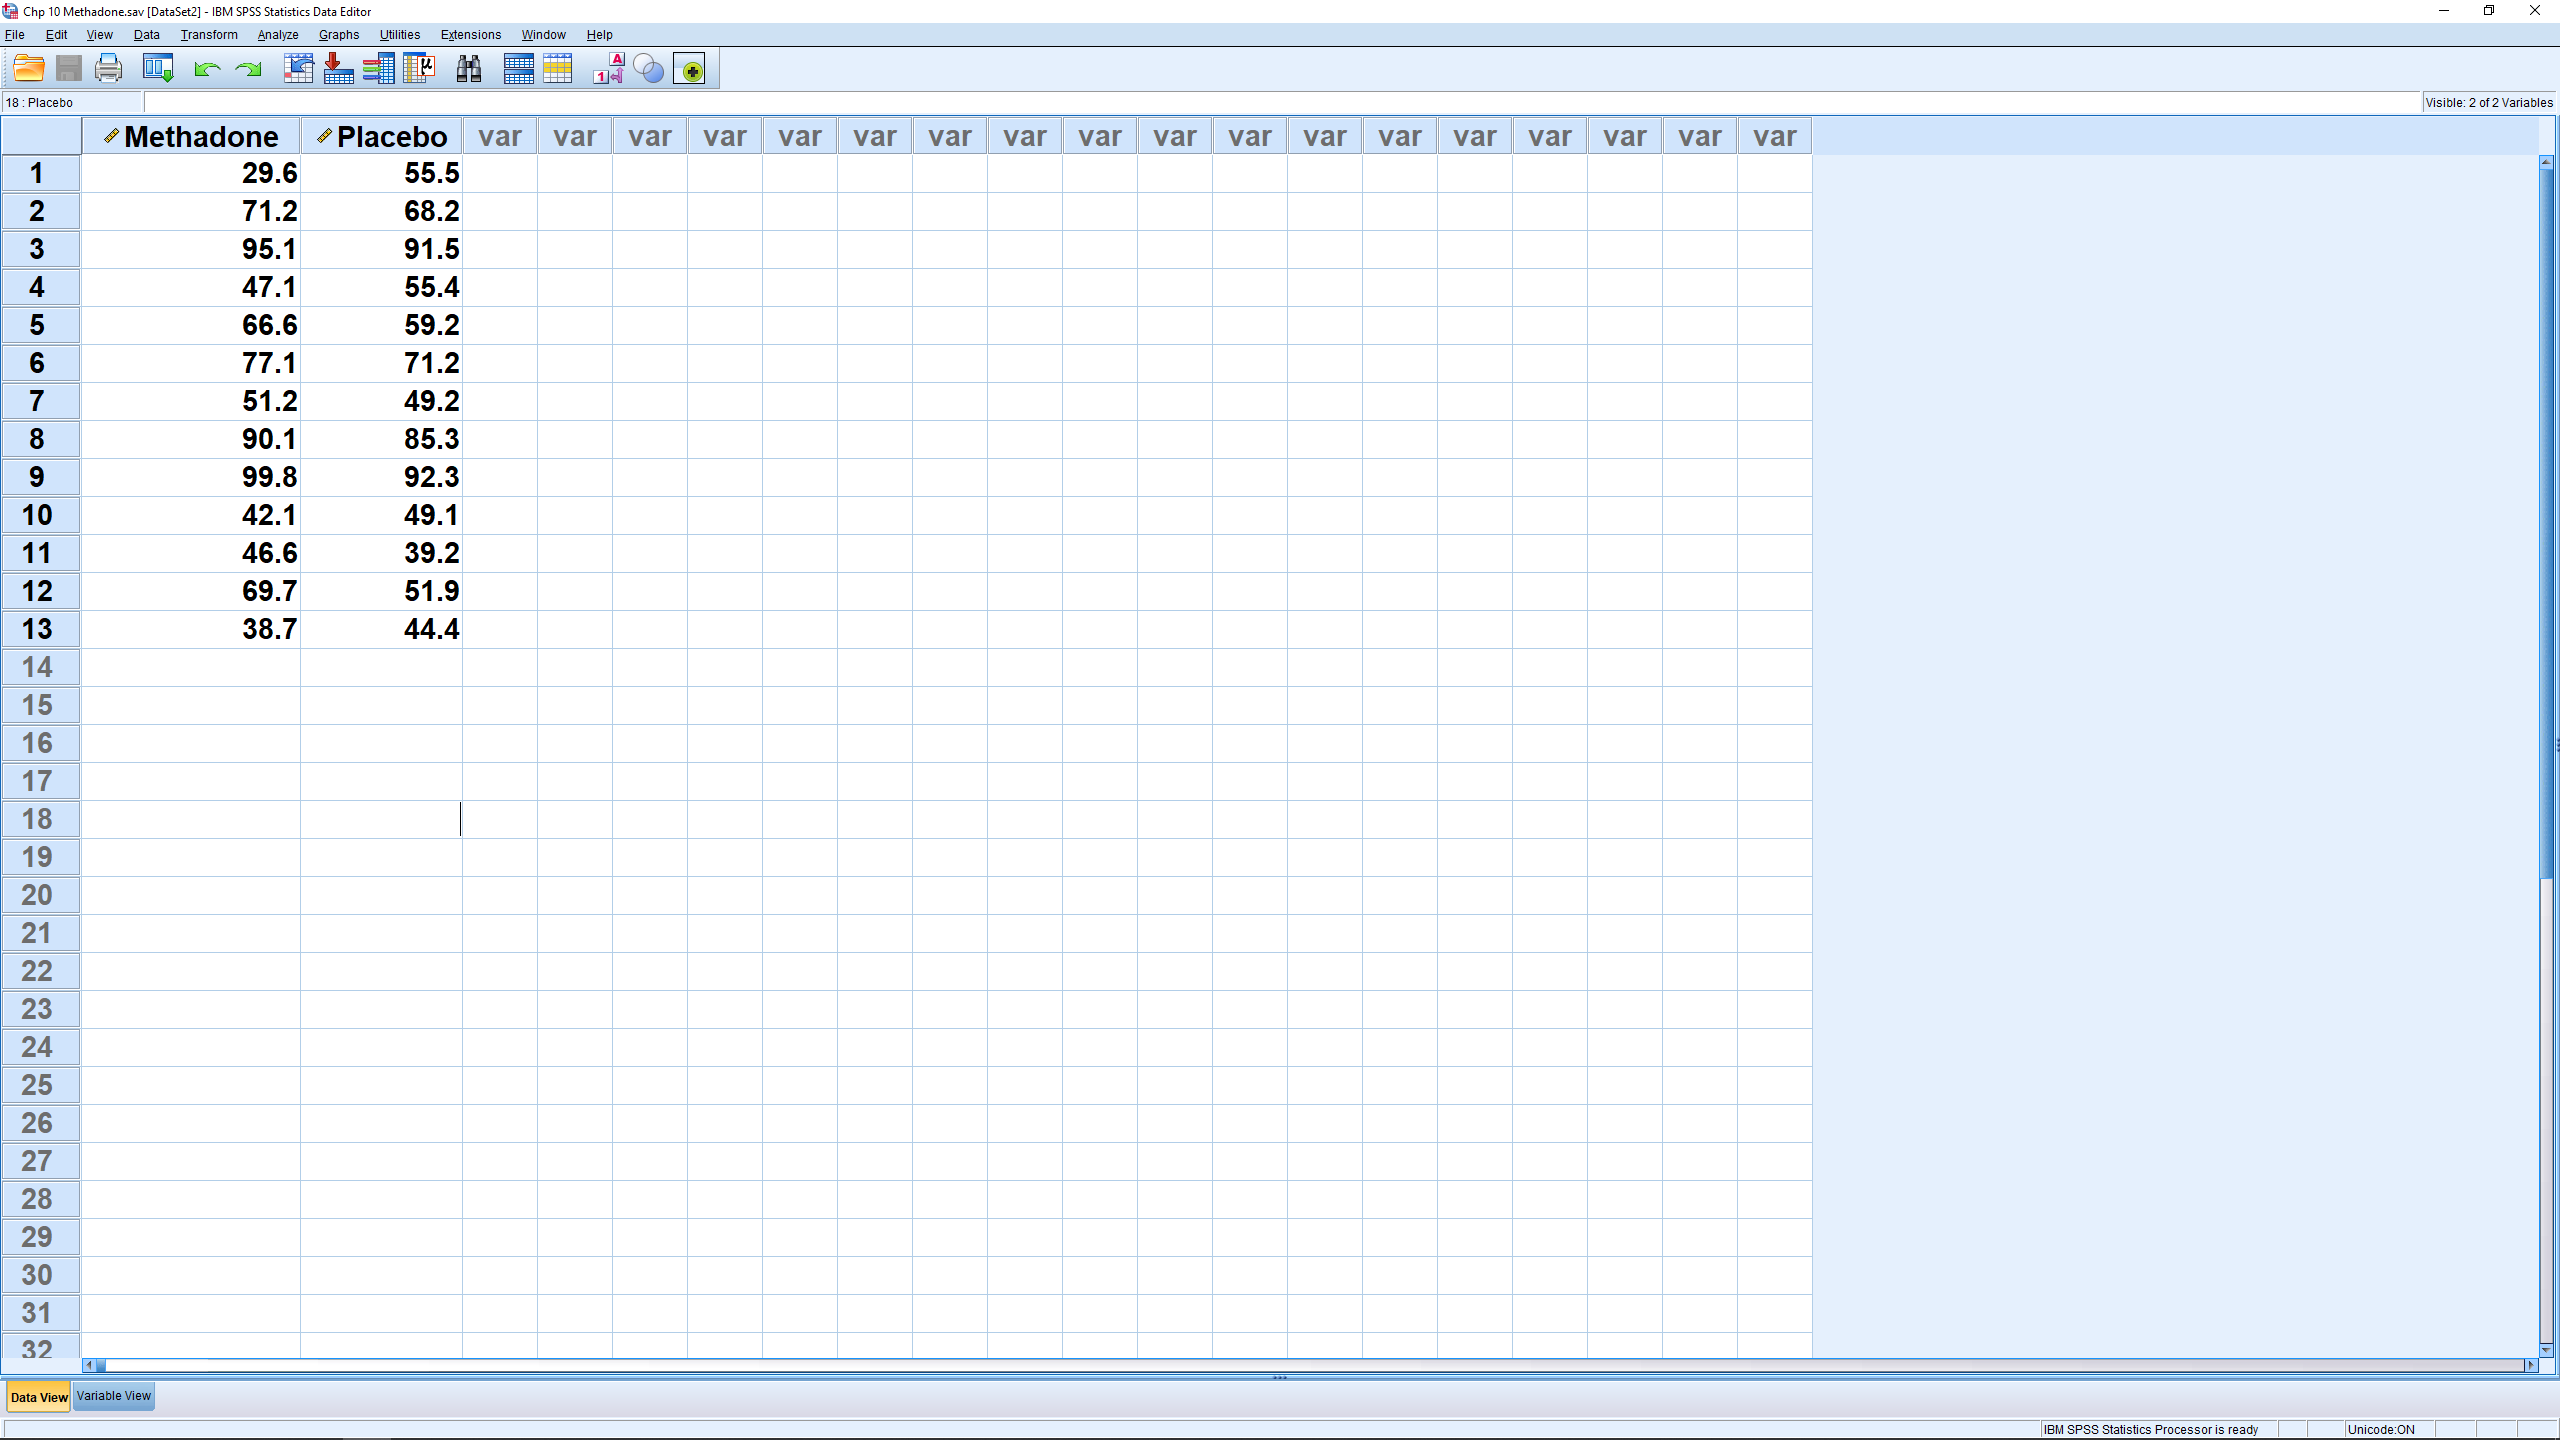
As set up, the file has two dependent variables. This “within subjects” dataset is fundamentally multivariate. When we did the paired  -test by hand we converted the multivariate data to univariate data by taking differences. SPSS will do the differences behind the scene and you won’t actually see them. Run the -test by picking Analyze
  Compare Means Paired -Samples T-Test:

Move the two variables into Pair 1 and hit OK (Options again allows you to specify a confidence intervals percentage):

The output is:
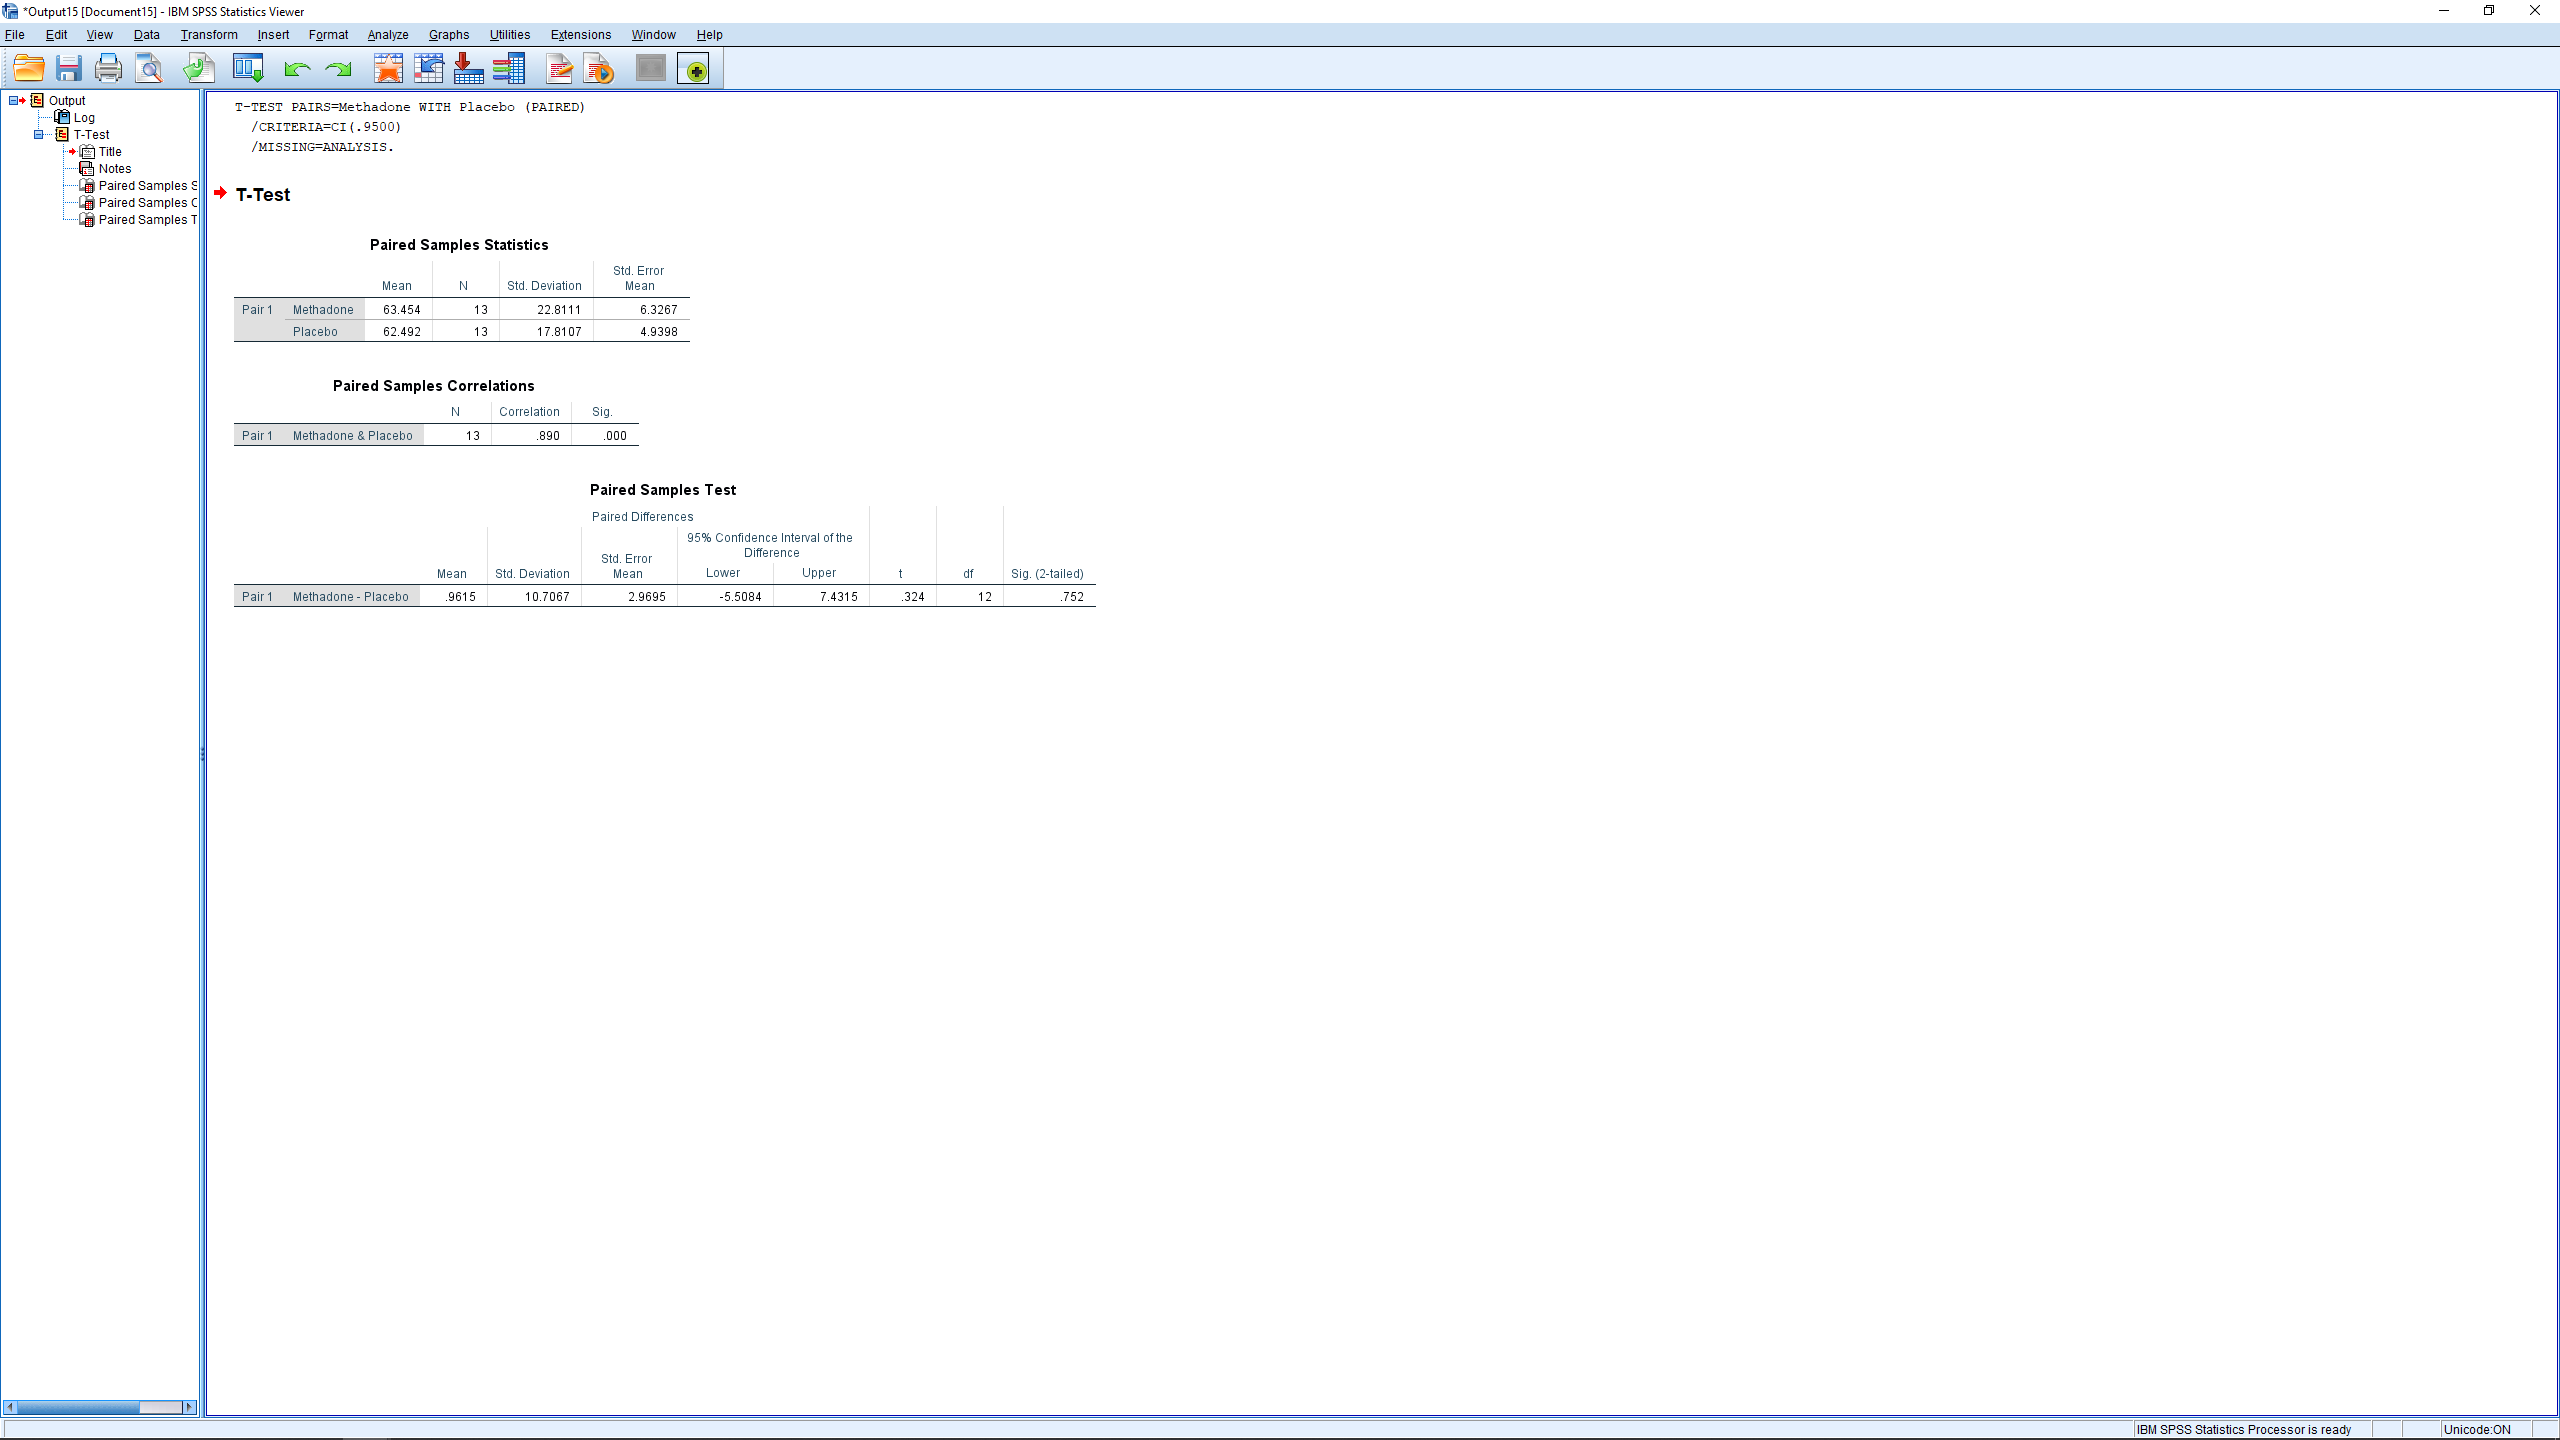
The first two tables are descriptive statistics. The last table gives the stuff we want:  ,
,  , the confidence interval
(10.11) 
 ,
,  and
and  for the two-tailed hypotheses pair
![\[H_{0}: & \mu_{D} = 0 \]](https://openpress.usask.ca/app/uploads/quicklatex/quicklatex.com-4124e5c9d16466482bcb0ee4e39c6e59_l3.png "Rendered by QuickLaTeX.com")
(10.12) 
The very low  -value (0 in this case) and the absence of 0 in the confidence interval guide us to reject
  , the differences are significantly different from zero.
The standardized effect size and strength of association for the paired -test are
(10.13) 
and
(10.14) 
respectively.
