
8. Confidence Intervals
8.5 Chi Squared Distribution
The  (chi squared) distribution is a consequence of a random process based on the normal distribution. It is derived from the normal distribution as the result of the following stochastic process :
- Suppose you have a population that has variance
 and is normally distributed.
 - Take a sample of size
 from the population and compute
  using the sample standard deviation
  from that sample.
 - Put the sample back into the population.
- Take another sample of size from the population and compute
 using the sample standard deviation
  from that sample.
 - etc.
- The distribution of the values of
 values will be a distribution with
  degrees of freedom.
Like the  -distributions, the
  distributions are a family, see Figure 8.10.
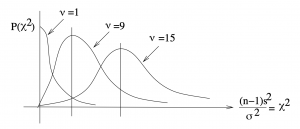 distributions are enumerated by degrees of freedom.
The distribution underlies why  is the best estimate for
  . It mean, or expected value is so the expected value of is . The expected value of
  in a random sample of size is not .
Confidence Intervals on and
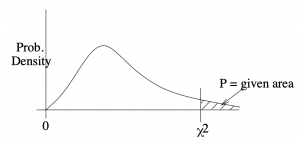
The distribution is already normalized in its definition through including in its definition. Therefore no  -transforms are needed and we can work directly with a table that gives right tail areas under the distribution. That table is the Chi-squared Distribution Table, in the Appendix, and it gives values of for given values of area to the right of , see Figure 8.11.
 associated with given right tail areas.
We’ll need  and
and  such that the tail areas are equal and such that the area between them is
  , see Figure 8.12.
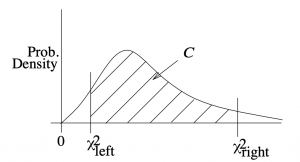 and define the confidence region .
Notation : Let’s call the  in the Chi-squared Distribution Table
  and let
  be the table value that corresponds to
  . In other words is the value that corresponds to a right tail area of .
So given , the appropriate  and
and  are the following values from the Chi-squared Distribution Table:
![\[\chi^{2}_{\rm right} = \chi^2 \left( \frac{1 - {\cal{C}}}{2} \right)\]](https://openpress.usask.ca/app/uploads/quicklatex/quicklatex.com-a1734e6de14ae9c12da279a76b8395f8_l3.png "Rendered by QuickLaTeX.com")
![\[\chi^{2}_{\rm left} = \chi^2 \left( 1- \left[ \frac{1 - {\cal{C}}}{2} \right] \right).\]](https://openpress.usask.ca/app/uploads/quicklatex/quicklatex.com-df8c253c27d7fea930f96679db425f31_l3.png "Rendered by QuickLaTeX.com")
Note the symmetry of the Chi-squared Distribution Table. If comes from the column 3 columns from the right edge of the table then comes from a column 3 columns from the left edge of the table. Only small and large areas appear in the table, there are no intermediate values.
Finally, the confidence interval for  is given by
![\[\frac{(n-1)s^{2}}{\chi^{2}_{\rm right}} < \sigma^2 < \frac{(n-1)s^2}{\chi^{-2}_{\rm left}}\]](https://openpress.usask.ca/app/uploads/quicklatex/quicklatex.com-1238c68e1bf03a2929b08ba84b21d1e1_l3.png "Rendered by QuickLaTeX.com")
and for by:
![\[\sqrt{\frac{(n-1)s^2}{\chi^2_{\rm right}}} < \sigma < \sqrt{\frac{(n-1)s^2}{\chi^2_{\rm left}}}\]](https://openpress.usask.ca/app/uploads/quicklatex/quicklatex.com-f400d471088b5911f912d9f49cca956e_l3.png "Rendered by QuickLaTeX.com")
Where the distribution with degrees of freedom (giving the line to use in the Chi-squared Distribution Table) is used.
Example 8.5 : Find the 90 confidence interval on and for the following data
![\[59, 54, 53, 52, 51, 39, 49, 46, 49, 48\]](https://openpress.usask.ca/app/uploads/quicklatex/quicklatex.com-cd679f6cf34ce039055faddc164bf358_l3.png "Rendered by QuickLaTeX.com")
Solution : Compute, using your calculator :
![\[s^2 = 28.2\]](https://openpress.usask.ca/app/uploads/quicklatex/quicklatex.com-cf625f9ed2eff03be5f85cb9bfc74f0c_l3.png "Rendered by QuickLaTeX.com")
![\[\nu =n-1 = 9.\]](https://openpress.usask.ca/app/uploads/quicklatex/quicklatex.com-9f32d72888ef03fabf6839b12ecae7ad_l3.png "Rendered by QuickLaTeX.com")
From the Chi-squared Distribution Table, in the  line, find :
![\[\chi^2_{\rm right} = \chi^2 \left( \frac{1-0.90}{2}\right) = \chi^2(0.05) = 16.919\]](https://openpress.usask.ca/app/uploads/quicklatex/quicklatex.com-d0629ebf03cae1495a6abeb69269cbbd_l3.png "Rendered by QuickLaTeX.com")
and
![\[\chi^2_{\rm left} = \chi^2 (1-0.05) = \chi^2(0.95) = 3.325\]](https://openpress.usask.ca/app/uploads/quicklatex/quicklatex.com-3cddf8421f94af78dab368c1ab150330_l3.png "Rendered by QuickLaTeX.com")
So

Taking square roots:
![\[3.87 < \sigma < 8.73 \hspace{1in} \mbox{with 90\% confidence.}\]](https://openpress.usask.ca/app/uploads/quicklatex/quicklatex.com-bd37f7aba320b2491b0a8c828681240d_l3.png "Rendered by QuickLaTeX.com")
▢
