
16.3 Methods for Studying Past Climate
Whereas weather refers to day-to-day variations in temperature, precipitation, winds, and so on, climate refers to long-term trends in weather patterns (over decades or more). The term paleoclimate refers to Earth’s climate in the past. The information we have about Earth’s past climates can be classified as direct data or proxy data. Direct data are information derived from first-hand observations of climate. Direct data can be instrumental data, derived from tools designed to quantify observations, or from qualitative descriptions.
Proxy data are information derived from natural materials with characteristics that are affected by climate in a systematic way. This could also be said of some instrumental data: an alcohol thermometer uses the fact that the volume of alcohol changes in a consistent way in response to temperature. Proxy data rely on relationships that are also as systematic and consistent, but there are important differences:
- Instruments are designed so that the response of the instrument reflects only one characteristic of the environment (e.g., an alcohol thermometer is sealed so that only temperature affects the level of alcohol, not air pressure or evaporation), but proxy data may need to be carefully analyzed to account for other processes.
- Data from instruments are lost if observations are not made and recorded. A thermometer is constantly changing in response to temperature, and will not stay in a particular state once conditions change. Proxy records capture information about the environment in a way that can persist over the long term, for as long as the materials last in usable form. Some proxy records preserve information from billions of years ago.
- Instruments transform characteristics of the environment into information that we can access immediately (e.g., you can read a temperature directly from a thermometer), but materials from which we derive proxy data require processing, often with specialized laboratory equipment, to get data we can use.
- Instruments measure only what we design them to measure, and measure only as well as we design them to do so. Because proxy data come from materials that persist through time, it is possible to improve the techniques used to analyze materials, and redo earlier measurements. Discovering new proxies is an ongoing area of research, and regularly reveals ways to determine characteristics of past states of the Earth system that we didn’t think were knowable.
- Instrumental records and other direct observations can be well constrained in time. In other words, we often know the exact dates the observations were made. Proxy data may come from materials that are difficult to pin down to an exact date, and additional information may be required to determine when the records were formed. Sometimes proxy data can only be extracted as an average over a number of years. The relevant question becomes whether the resolution of the record (how detailed it is) is high enough for the time frame of interest. For example, an annual average would be no use at all to understand monthly climate variations, but would provide exceptionally high resolution for geological processes operating over tens of thousands of years.
Types of Direct Data
Instrumental records of climate are those derived from tools such as thermometers, rain gauges, or satellite measurements of the extent of ice sheets. Instrumental records are a recent development, as the history of the Earth system goes. The oldest known temperature measurements cover the period from 1654 to 1670, and were made by monks and Jesuit priests who operated stations within a meteorological network supported by the Medici family of Florence.
Non-instrumental historical records of climate also exist, and cover periods of human history prior to the development of the climate-measuring tools we have now. With detective work, these can be used to paint a detailed picture of past climates. Non-instrumental historical records include written records about how long ice and snow were present in a particular year, when harvests occurred, when floods happened, and shipping records that report the extent of sea ice. Paintings of alpine glaciers give information about how far the ice extended, and this can be used to reconstruct temperatures.
The Challenges of Getting Climate Information from Historical Records
In their paper Historical Climate Records in China and Reconstruction of Past Climates, Jiacheng Zhang and Thomas Crowley used official Chinese records extending as far back as 1000 CE to get a detailed picture of climate. This involved transforming descriptions of weather events into a systematic scale. One challenge is defining the scale, but another is deciding what individual accounts actually mean. The authors point out that records of rain or drought can reflect the perceptions and generalizations of the people who wrote about the weather, rather than what actually happened. Consider the following description of rainfall in 1644 from Diary of Qi Zongmin:
“in Wyzhong there is no rain for six months from May”
Does this mean there was no rain at all prior to May, or just very little? Was it actually six months since there had been rain, or is that an approximation? How do we reliably translate different systems of time measurement into durations and dates, like “six months” or “May?” How can we tell for sure where a location is if place names or political boundaries change?
As the authors caution, “a great deal of cross-checking [is required] in order to arrive at a useful descriptive account of climate anomalies.”
Sources of Proxy Data
Tree Rings
The study of tree growth rings for the purpose of understanding past states of the Earth system is called dendroclimatology. Temperatures and a history of drought or wet periods can be reconstructed from the widths of tree rings. Because tree rings form annually, these records can also be well constrained in time. The widths of tree rings reflect how fast the tree grows in a given season. There are factors other than temperature and moisture that affect growth rate, so a sampling strategy must be carefully designed to ensure confidence in climate reconstructions.
Stable Isotopes
Atoms have a nucleus made of protons and neutrons. The number of protons in the nucleus determines what element the atom is, and will always be the same for a given element. In contrast, the number of neutrons can vary for an element. Versions an element having different numbers of neutrons are the isotopes of that element.
Sometimes an atom has a number of neutrons that makes it unstable. Those atoms eventually break apart, releasing energy, and are called radioactive isotopes. The decay rate of radioactive isotopes is known, making it possible to use them to find the ages of natural materials. For example, carbon-14 dating makes use of the radioactive isotope of carbon, 14C, which has eight neutrons instead of the usual number, six (the 14 refers to 6 protons + 8 neutrons).
For investigating Earth’s past climate, stable isotopes, which do not decay, are used instead. Stable isotopes of the same element are measured in natural materials, and their ratios compared. Both isotopes are involved in the same chemical reactions and physical processes, but the slight difference in mass caused by one or two extra neutrons means that those processes are more likely to take up the lighter isotope than the heavier one. Some processes do this in such a particular way that evidence of their occurrence is left behind as a distinctive fingerprint in the stable isotope composition of materials formed in their environment.
The pair of isotopes used to reconstruct past temperatures are the oxygen isotopes 16O and 18O. The ratio of 18O to 16O in water is reflected in the calcium carbonate of shells that form in the water. The shells may remain in the geologic record long after the water is gone, making it possible to know the oxygen isotope compositions, and thus temperatures, of water bodies that existed in the distant past.
Ice Cores
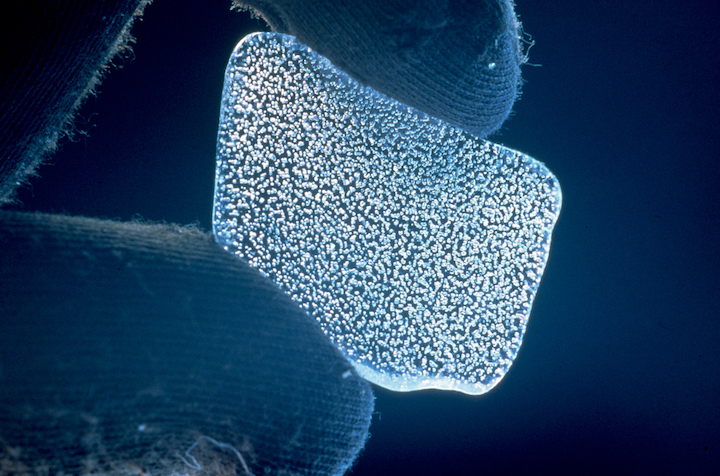
The ice in polar glaciers and mountain glaciers preserves a detailed snapshot of Earth’s atmosphere and climate. A sample of Earth’s atmosphere, including gases and particles, is captured and held within the ice, and buried beneath subsequent ice layers. The annual layers in the ice can be used to determine a timescale for the data. The gases in air bubbles trapped within ice (Figure 16.23) are analyzed to determine the chemical composition of the atmosphere at the time the gasses were trapped.
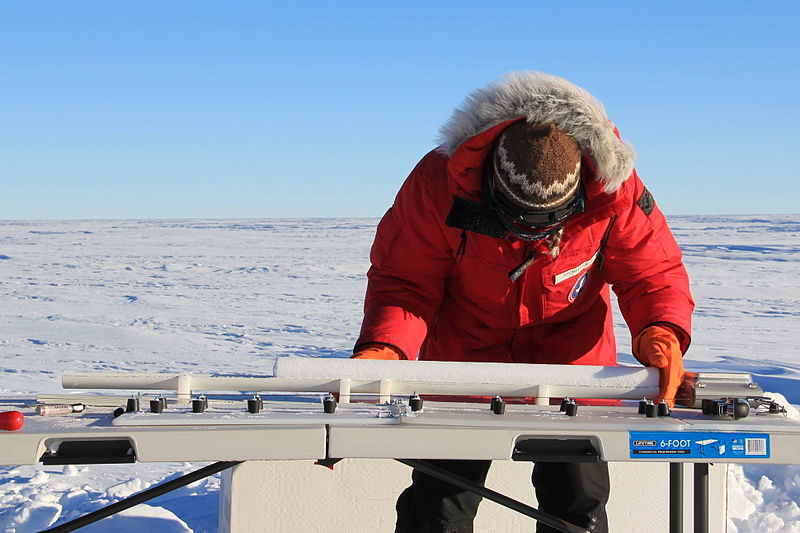
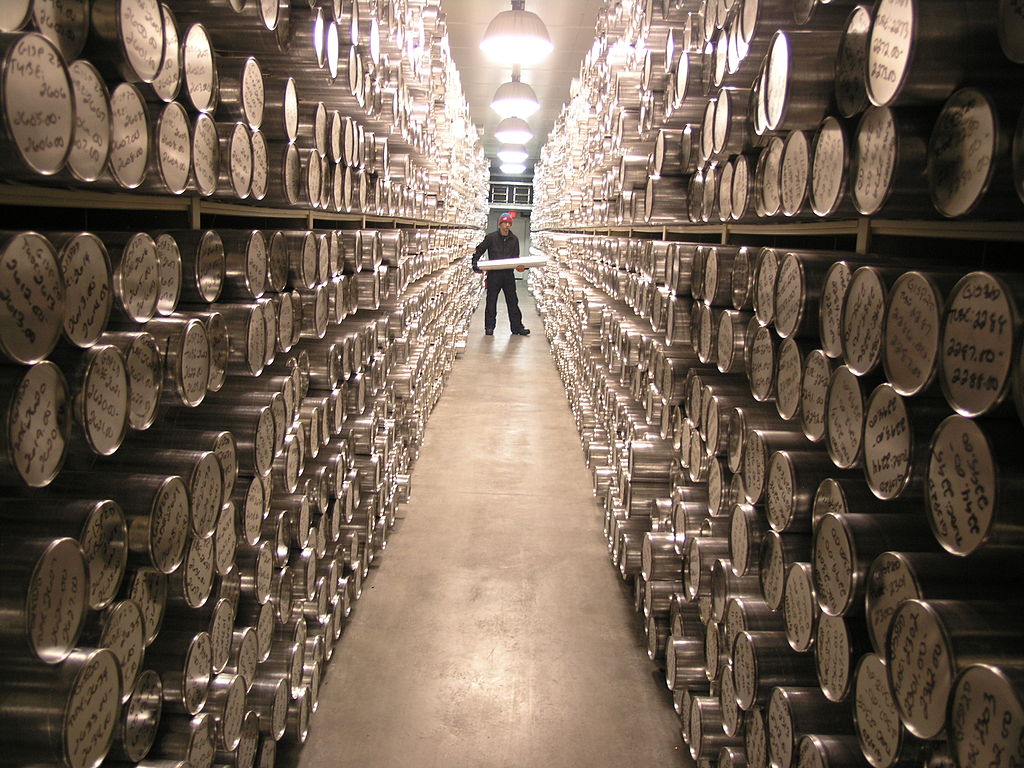
Ice cores (Figure 16.24) are cylinders of ice retrieved using a specialized drill bit. The cores are carefully packaged and stored in specially designed facilities (Figure 16.25) until they are analyzed.
Rock and Fossil Distributions
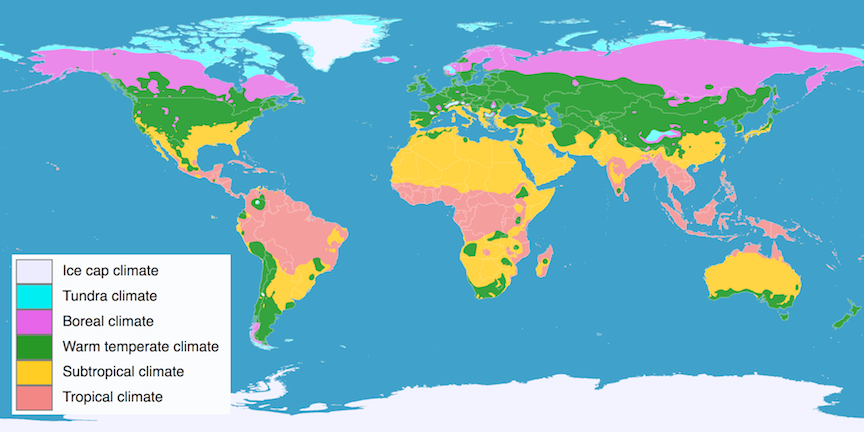
Earth can be divided into six main climate zones (Figure 16.26). The zones run roughly along lines of latitude, so that the climate zone changes as you move north or south of the equator. When the climate warms, the zones shift away from the equator; an area now in the boreal climate zone might have been in the warm temperate climate zone when Earth’s climate was warmer. When the climate cools, the zones shift toward the equator.
Some rock types are characteristic of particular climate zones. For example, coal deposits are characteristic of a subtropical climate. Limestone with coral reef fossils is characteristic of a tropical climate. If a rock type is found outside of its climate zone, that might indicate a change in climate. Coal can be found near Estevan, Saskatchewan, now in the warm temperate climate zone. This suggests that at one time, a warmer climate resulted in a northward shift of the subtropical climate zone. Some of the oil in western Canada is present in pore spaces within ancient coral reefs. The warm temperate climate zone cannot have been at its present location when those reefs formed.
Fossils can be used similarly. If an organism lives in a habitat with a particular climate, then evidence that the organism has migrated away from the equator could indicate warming. Migration toward the equator could indicate cooling.
The study of pollen and plant spores, called palynology, is very helpful for determining the distribution of plants when evidence of larger plant parts (e.g., fossil leaves and bark) is absent. Pollen and spores are very tough, and will survive in the environment when other plant materials do not. A detailed record of pollen and spores, and hence of the climate zones in a particular location, can be derived from lake sediments. Lakes in climates with strong seasonality (a distinct difference in temperature as seasons progress) can accumulate distinct annual sediment layers, called varves (Figure 16.27). Each year is represented by a light layer and a dark layer. The light layers consist of sand and silt from spring runoff. The darker layers include organic matter accumulated during the year.
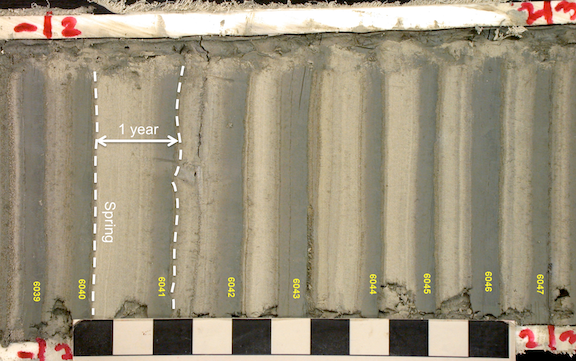
Varves can be counted to determine the age of the sediment, and the pollen and spores within the sediment can be extracted to see what types of vegetation were present at different times.
References
Ridge, J.C. (2008) The North American Glacial Varve Project. Retrieved from http://eos.tufts.edu/varves
Zhang, J., & Crowley, T. (1989). Historical Climate Records in China and Reconstruction of Past Climates. Journal of Climate 2(8), 833-849. https://doi.org/10.1175/1520-0442(1989)002<0833:HCRICA>2.0.CO;2 Full text
