
2.1 Starting with a Big Bang
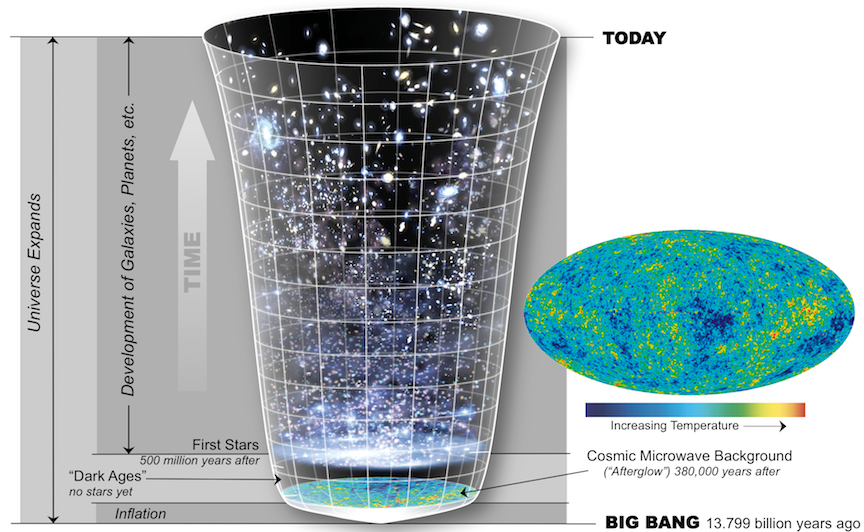
According to the big bang theory, the universe blinked violently into existence 13.8 billion years ago. The big bang is often described as an explosion, but imagining it as an enormous fireball isn’t accurate. The big bang started with a sudden expansion of energy and space from a single point. The kind of Hollywood explosion that might come to mind involves expansion of matter and energy within space, but during the big bang, energy, space, and matter were created. In Figure 2.2 the pointed base of the universe “vessel” represents the big bang. Time advances moving up the diagram. The vessel gets wider as time progresses, reflecting the expansion of the universe.
You might wonder how a universe can be created out of nothing. Creating a universe out of nothing is mostly beyond the scope of this chapter, but there is a way to think about it. The particles that make up the universe have opposites that cancel each other out, similar to the way that we can add the numbers 1 and -1 to get zero (also known as “nothing”). As far as the math goes, having zero is exactly the same as having a 1 and a -1. It is also exactly the same as having a 2 and a -2, a 3 and a -3, two -1s and a 2, and so on. In other words, nothing is really the potential for something if you divide it into its opposite parts.
Composition of the Universe
In Figure 2.2, the “contents” of the vessel change as time progresses. A few minutes after the big bang, the universe was still too hot and dense to be anything but a sizzle of particles smaller than atoms. But as it expanded, it also cooled. Eventually particles that collided were able to stick together to form atoms, rather than being smashed apart again when other particles crashed into them. Those collisions produced hydrogen and helium, the most common elements in the universe.
For a long time after the big bang, clouds of hydrogen and helium atoms drifted about a dark universe. The “dark ages” (bottom of Figure 2.2) were a time when the ingredients for stars existed, but stars themselves did not. It took approximately 500 million years for enough hydrogen atoms to clump together in clouds to allow the first stars to form and begin to shine.
Looking Back to the Early Stages of the Big Bang
The notion of seeing the past is often used metaphorically when we talk about ancient events, but in this case it is meant literally. In our everyday experience, when we watch an event take place, we perceive that we are watching it as it unfolds in real time. In fact, this isn’t true. To see the event, light from that event must travel to our eyes. Light travels very rapidly, but it does not travel instantly. If we were watching a digital clock 1 m away from us change from 11:59 a.m. to 12:00 p.m., we would actually see it turn to 12:00 p.m. three billionths of a second after it happened.
This isn’t enough of a delay to cause us to be late for an appointment, but the universe is a very big place, and the “digital clock” in question is often much, much farther away. In fact, the universe is so big that it is convenient to describe distances in terms of light years, or the distance light travels in one year. What this means is that light from distant objects takes so long to get to us that we see those objects as they were at some considerable time in the past. For example, the star Proxima Centauri is 4.24 light years from the sun. If you viewed Proxima Centauri from Earth on January 1, 2018, you would actually see it as it appeared in early October 2013.
We now have tools that are powerful enough to look deep into space and see the arrival of light from early in the universe’s history. Astronomers can detect light from approximately 380,000 years after the big bang is thought to have occurred. Physicists tell us that if the big bang happened, then particles within the universe would still be very close together at this time. They would be so close that light wouldn’t be able to travel far without bumping into another particle and getting scattered in another direction. The effect would be to fill the sky with glowing fog, the “afterglow” from the formation of the universe.
In fact, this is exactly what we see when we look at light from 380,000 years after the big bang. The fog is referred to as the cosmic microwave background (or CMB), and it has been carefully mapped throughout the sky. In Figure 2.2, the colourful patch at the base of the diagram represents the fog that is measured today as the CMB. Figure 2.2 (right) is a CMB map of the universe in Mollweide projection. This is a projection that is used to show Earth’s geography on a flat surface. In this case, the map of the CMB represents a sphere surrounding Earth rather than what’s beneath our feet.
Colour variations in the CMB map represent temperature variations. These variations translate to differences in the density at which matter was distributed in the early universe. The red patches are the highest density regions and the blue patches are the lowest density. Higher density regions represent the eventual beginnings of stars and planets. The CMB map in Figure 2.2 has been likened to a baby picture of the universe.
The Universe is Still Expanding
The expansion that started with the big bang never stopped. It continues today, and we can see it happen by observing that large clusters of billions of stars, called galaxies, are moving away from us. (An exception is the Andromeda galaxy with which we are on a collision course.) The astronomer Edwin Hubble came to this conclusion when he observed that the light from other galaxies was red-shifted. The red shift is a consequence of the Doppler effect. This refers to how we see waves when the object that is creating the waves is moving toward us or away from us.
Before looking at the Doppler effect as it pertains to light, it can be useful to see how it works on something more tangible. The duckling swimming in Figure 2.3 is generating waves as it moves through the water. It is generating waves that move forward as well as back, but notice that the ripples ahead of the duckling are closer to each other than the ripples behind the duckling. The distance from one ripple to the next is called the wavelength. The wavelength is shorter in the direction that the duckling is moving, and longer as the duckling moves away.

When waves are in air as sound waves rather than in water as ripples, the different wavelengths manifest as sounds with different pitches — the short wavelengths have a higher pitch, and the long wavelengths have a lower pitch. This is why an observer will hear a change in the pitch of a car’s engine as the car races past.
For light waves, wavelength translates to colour. In the spectrum of light that we can see, shorter wavelengths are on the blue end of the spectrum, and longer wavelengths are on the red end of the spectrum. In Figure 2.4, the longer or shorter wavelengths of the water ripples at the top of the diagram reflect the longer or shorter wavelengths of light in the visible spectra below. Does this mean that galaxies look red because they are moving away from us? No, but the colour we see is shifted toward the red end of the spectrum and longer wavelengths.
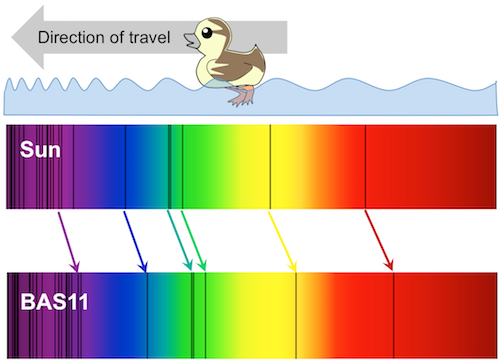
Notice that the sun’s spectrum in the upper part of Figure 2.4 has black lines in it. The black lines are there because some colours are missing from the sun’s light that reaches Earth. Different elements absorb light of specific wavelengths, and many of the black lines in Figure 2.4 represent colours that are absorbed by hydrogen and helium within the sun. This means the black lines are like a bar code that can tell us what a star is made of.
The lower spectrum in Figure 2.4 is the light coming from BAS11, an enormous cluster of approximately 10,000 galaxies located 1 billion light years away. The black lines represent the same elements as in the sun’s spectrum, but they are shifted to the right toward the red end of the spectrum, because BAS11 is moving away from us as the universe continues to expand. To summarize, because almost all of the galaxies we can see have light that is red-shifted, it means they are all moving away from us. In fact, the farther away they are, the faster they are going. This is evidence that the universe is still expanding.
References
European Space Agency (2015). Planck reveals first stars were born late. Visit website
Knop, R. (2010). The History of the Universe. Visit blog
Lawrence, C. R. (2015, March). Planck 2015 Results. Paper presented to the Astrophysics Subcommittee, NASA HQ. View slides
