
12.4 The Impacts of Earthquakes
Earthquakes can have direct impacts, such as structural damage to buildings from shaking, and secondary impacts, such as triggering landslides, fires, and tsunami. The types and extent of impacts will depend on local conditions where the earthquake strikes. The geological materials in the area matter, as does the type of terrain, and whether the region is near the coast or not. The extent of impact and type of damage will depend on whether the area is predominantly urban or rural, densely or sparsely populated, highly developed or underdeveloped. It will depend on whether the infrastructure has been designed to withstand shaking.
Damage to Structures from Shaking
As with the example of the 1985 Mexico earthquake, the geological foundations on which structures are built will affect the amount of shaking that occurs. Earthquakes produce seismic waves that vibrate at different rates, or frequencies. Waves with rapid vibrations have a high frequency, and waves with slower vibrations have lower frequencies.
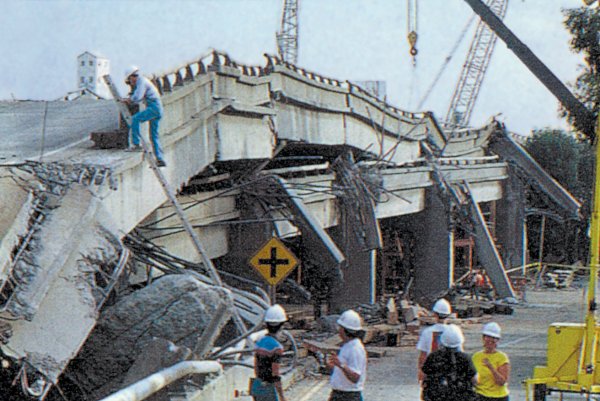
The energy of the higher frequency waves tends to be absorbed by solid rock. Lower frequency waves pass through solid rock without being absorbed, but are absorbed and amplified by soft sediments. It is therefore very common to see much worse earthquake damage in areas underlain by soft sediments than in areas of solid rock. During the 1989 Loma Prieta earthquake, parts of a two-layer highway in the Oakland area near San Francisco collapsed where they were built on soft sediments (Figure 12.24).
Building damage is also greatest in areas of soft sediments, and multi-storey buildings tend to be more seriously damaged than smaller ones. Buildings can be designed to withstand most earthquakes, and this practice is increasingly applied in earthquake-prone regions. Turkey is one such region, but even though Turkey had a relatively strong building code in the 1990s, adherence to the code was poor. Builders did whatever they could to save costs, including using inappropriate materials in concrete, and reducing the amount of steel reinforcing. The result was more than 17,000 deaths in the 1999 M7.6 Izmit earthquake (Figure 12.25). After two devastating earthquakes that year, Turkish authorities strengthened the building code further, but the new code has been applied only in a few regions, and enforcement of the code is still weak, as revealed by the amount of damage from a M7.1 earthquake in eastern Turkey in 2011.

Structures underlain by sediments may be at risk of another hazard, called liquefaction, in which sediment is transformed into a fluid. When water-saturated sediments are shaken, the grains may lose contact with each other, and no longer support one another. Water between the grains holds them apart, causing the sediment to turn to mud and flow. The loss of support can lead to the collapse of buildings or other structures that might otherwise have sustained little damage. During the 1964 M7.6 earthquake in Niigata, Japan, liquefaction caused buildings to sink into the sediments (Figure 12.26).

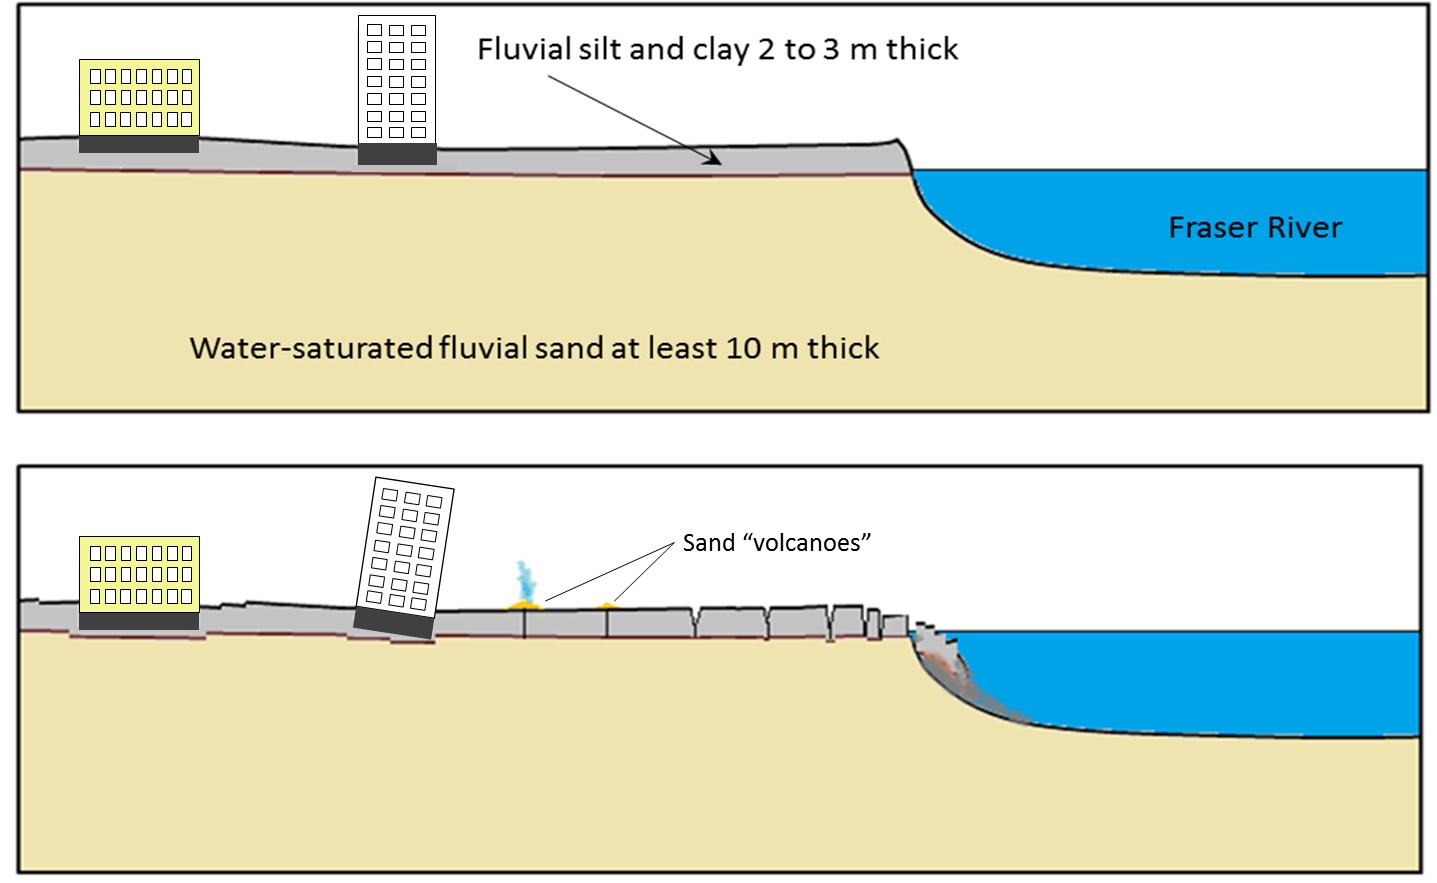
Parts of the Fraser River delta are also prone to liquefaction-related damage. The region is characterized by a 2 m to 3 m thick layer of fluvial silt and clay above a layer of water-saturated fluvial sand that is at least 10 m thick (Figure 12.27). Under these conditions, seismic shaking can be amplified, and the sandy sediments will liquefy. This could lead to subsidence and tilting of buildings. Liquefaction can also contribute to slope failures and to fountains of sandy mud (sand volcanoes) in areas where there is loose saturated sand beneath a layer of more cohesive clay. Current building-code regulations in the Fraser delta area require that measures be taken to strengthen the ground beneath multi-story buildings prior to construction.
Experiments with Liquefaction
To see liquefaction for yourself, go to a sandy beach and find a place near the water’s edge where the sand is wet. While standing in one place on a wet part of the beach, start moving your feet up and down at a frequency of about once per second. Within a few seconds the previously firm sand will start to lose strength, and you’ll gradually sink in up to your ankles.
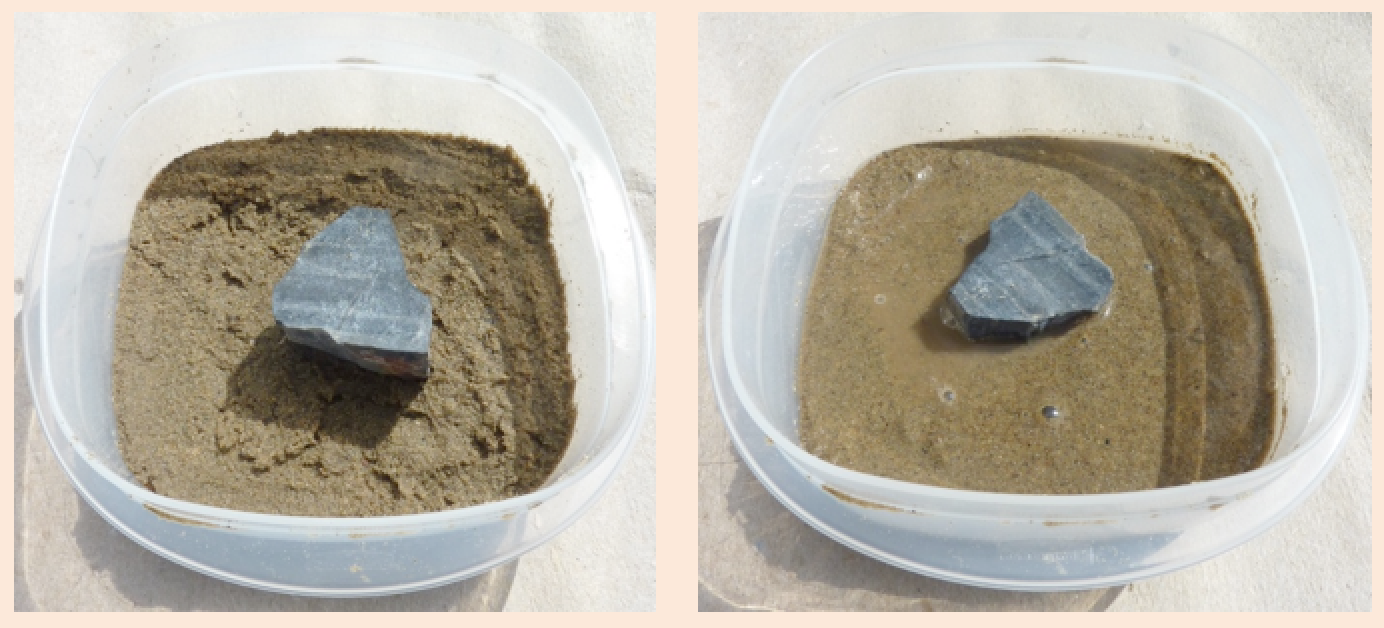
If you can’t get to a beach, put some sand into a small container, saturate it with water, and then pour the excess water off. Shake the container gently to get the water to separate and then pour the excess water away. You may have to do this more than once. Place a small rock on the surface of the sand. It should sit there for hours without sinking in. Now, holding the container in one hand gently thump the side or the bottom with your other hand, about twice a second. The rock should gradually sink in as the sand around it becomes liquefied.
As you were moving your feet up and down or thumping the container, it’s likely that you soon discovered the most effective rate for getting the sand to liquefy. Stepping up and down as fast as you can (several times per second) on the wet beach would not have been effective, nor would you have achieved much by stepping once every several seconds. The body of sand vibrates most readily in response to shaking that is close to its natural harmonic frequency, and liquefaction is also most likely to occur at that frequency.
Slope Failure
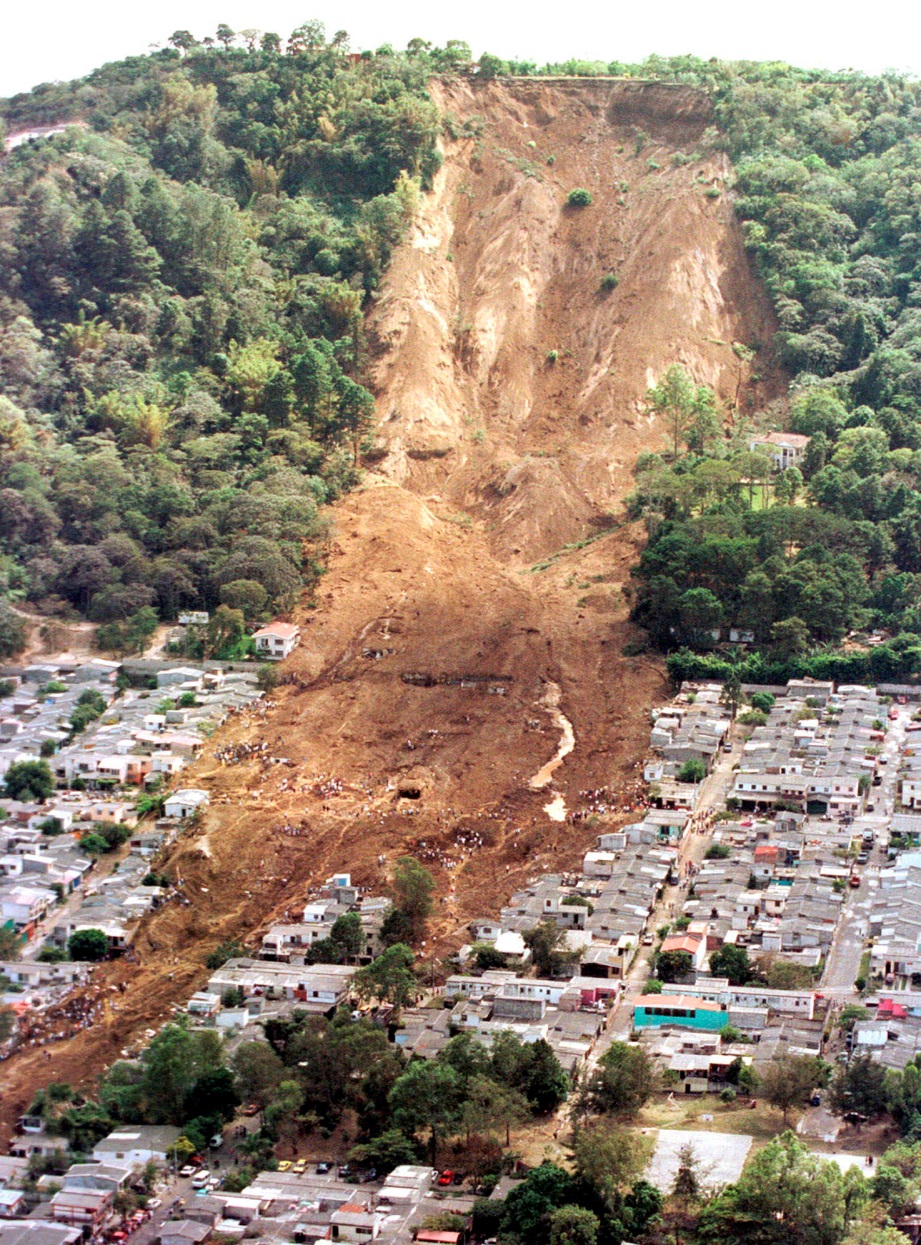
Ground shaking during an earthquake can be enough to weaken rock and loose materials to the point of failure. Earthquakes can also trigger failures on slopes that are already weak. In January of 2011 a M7.6 earthquake offshore of El Salvador triggered slope failures that killed nearly 600 people (Figure 12.29).
Fires
Fires are commonly associated with earthquakes because gas lines rupture and electrical lines are damaged when the ground shakes. Most of the damage in the great 1906 San Francisco earthquake was caused by massive fires in the downtown area of the city (Figure 12.30). Some 25,000 buildings were destroyed by those fires, which were fueled by gas leaking from broken pipes. Fighting the fires was difficult because water mains had also ruptured. Today the risk of fires can be reduced through P-wave early warning systems if utility operators can decrease pipeline pressure and break electrical circuits.

Tsunami
Large earthquakes that take place beneath the ocean have the potential to displace large volumes of water. In a subduction zone, for example, the overriding plate becomes distorted by elastic deformation. It is squeezed laterally and pushed up (Figure 12.31 top). When an earthquake happens, the plate rebounds over an area of thousands of square kilometres, generating waves- a tsunami (Figure 12.31, middle). The waves spread across the ocean at velocities of several hundred kilometres per hour. Tsunami can make it to the far side of an ocean in about the same time as a passenger jet.
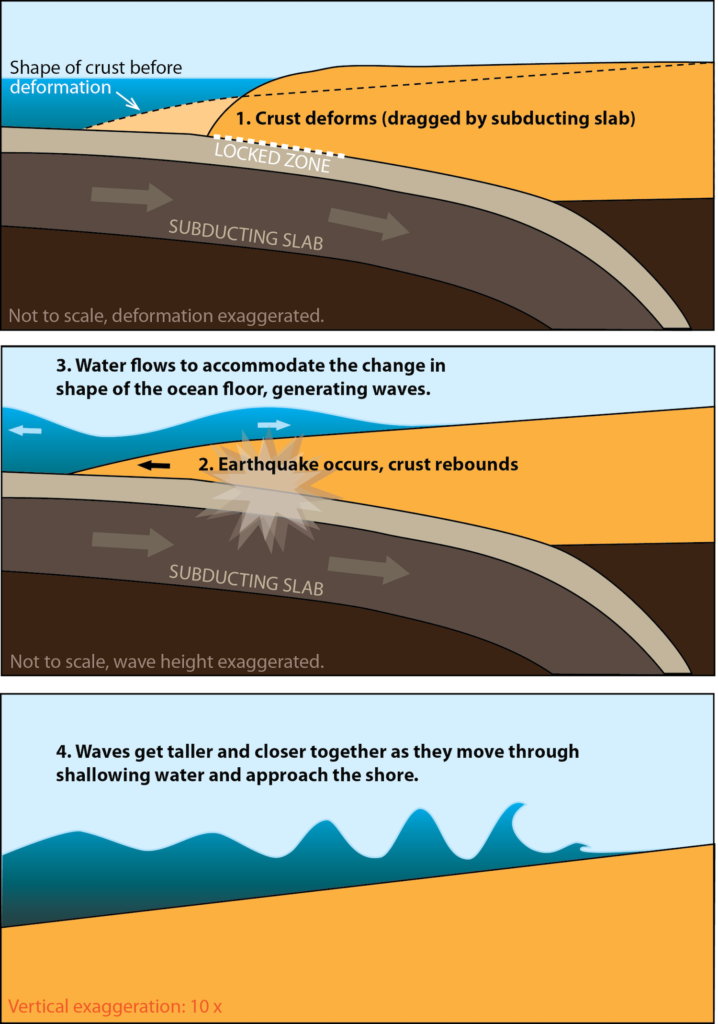
Tsunami waves gain their height as they travel through shallower waters. In the deep ocean, the waves may be so small as to go undetected by ships, but when they are slowed down by interacting with the ocean floor, they can become much taller (Figure 12.31, bottom). In the tsunami following the 2004 Sumatra earthquake, the tallest waves were more than 30 m high.
Subduction earthquakes must be large to generate significant tsunami. Earthquakes with magnitude less than 7 do not typically generate significant tsunami because the amount of vertical displacement of the sea floor is minimal. Sea-floor transform earthquakes, even large ones (M7 to M8), don’t typically generate tsunami either, because the motion is mostly side to side, not vertical.
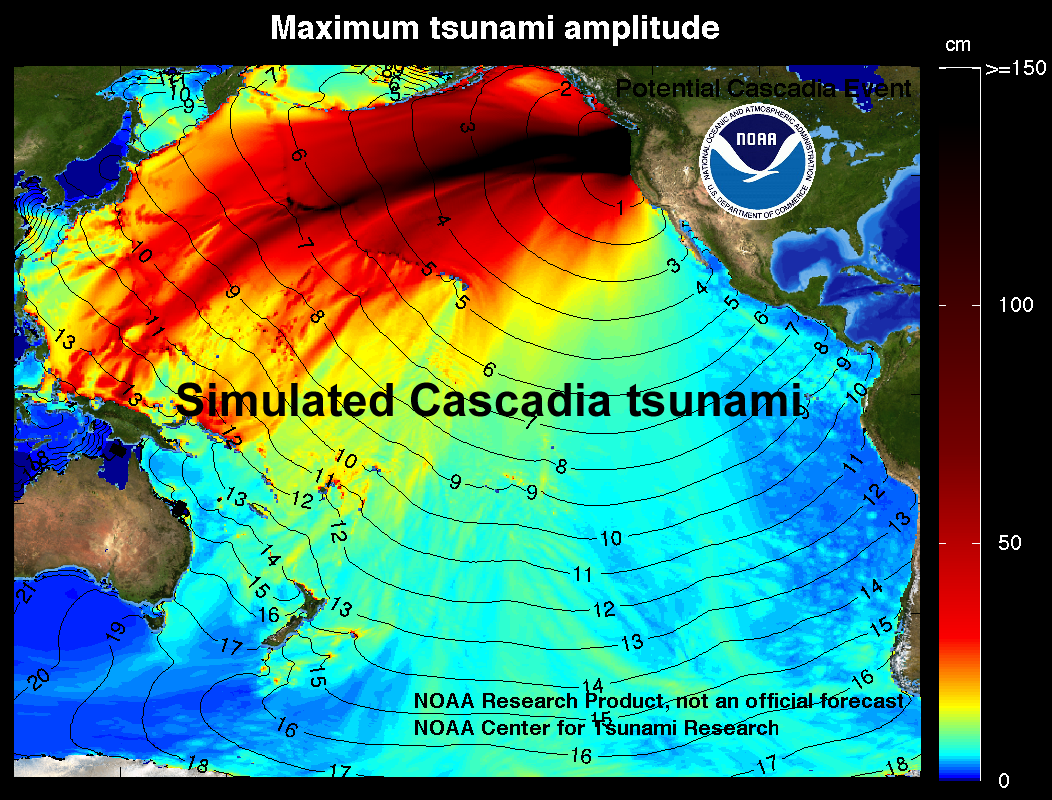
Tsunami can have an impact across an entire ocean basin. They spread across the ocean at velocities of several hundred kilometres per hour, and can make it to the far side of an ocean in about the same time as a passenger jet. In 1700 a rupture along the Cascadia thrust fault running from Vancouver Island to northern California resulted in a M9 earthquake. It generated a tsunami that travelled across the Pacific Ocean, and was recorded in Japan nine hours later. A computer simulation of the tsunami (Figure 12.32) shows how long it took tsunami waves from the Cascadia earthquake to travel across the Pacific Ocean, and how high the waves were. Notice that over all, the waves decrease in height moving away from the rupture, but they increase in height again as they reach the opposite side of the Pacific Ocean.
References
Earthquakes Canada, Natural Resources Canada (2016). The M9 Cascadia Megathrust Earthquake of January 26, 1700. Visit website
University Corporation for Atmospheric Research (2010). Propagation. Tsunamis. Visit website
U. S. Geological Survey (2014). Indian Ocean Tsunami Remembered — Scientists reflect on the 2004 Indian Ocean that killed thousands. Visit website
