
3.2 Imaging Earth’s Interior
Seismology is the study of vibrations within Earth. These vibrations are caused by events such as earthquakes, extraterrestrial impacts, explosions, storm waves hitting the shore, and tides. Seismology is applied to the detection and study of earthquakes, but seismic waves also provide important information about Earth’s interior.
Seismic waves travel through different materials at different speeds, and we can apply knowledge of how they interact with different materials to understand Earth’s layers and internal structures. Similar to the way that ultrasound is used to image the human body, we can measure how long it takes for seismic waves to travel from their source to a recording station.
Another feature of seismic waves is that some, called P-waves, can travel rapidly though both liquids and solids, but others, called S-waves, can only travel though solids, and are slower than P-waves. Observing where P-waves travel, and S-waves do not, allows us to identify regions within Earth that are melted.
Seismic Wave Paths
Seismic waves travel in all directions from their source, but it is convenient to imagine the path traced by one point on the wave front, and represent that path as a seismic ray (arrows, Figure 3.6).
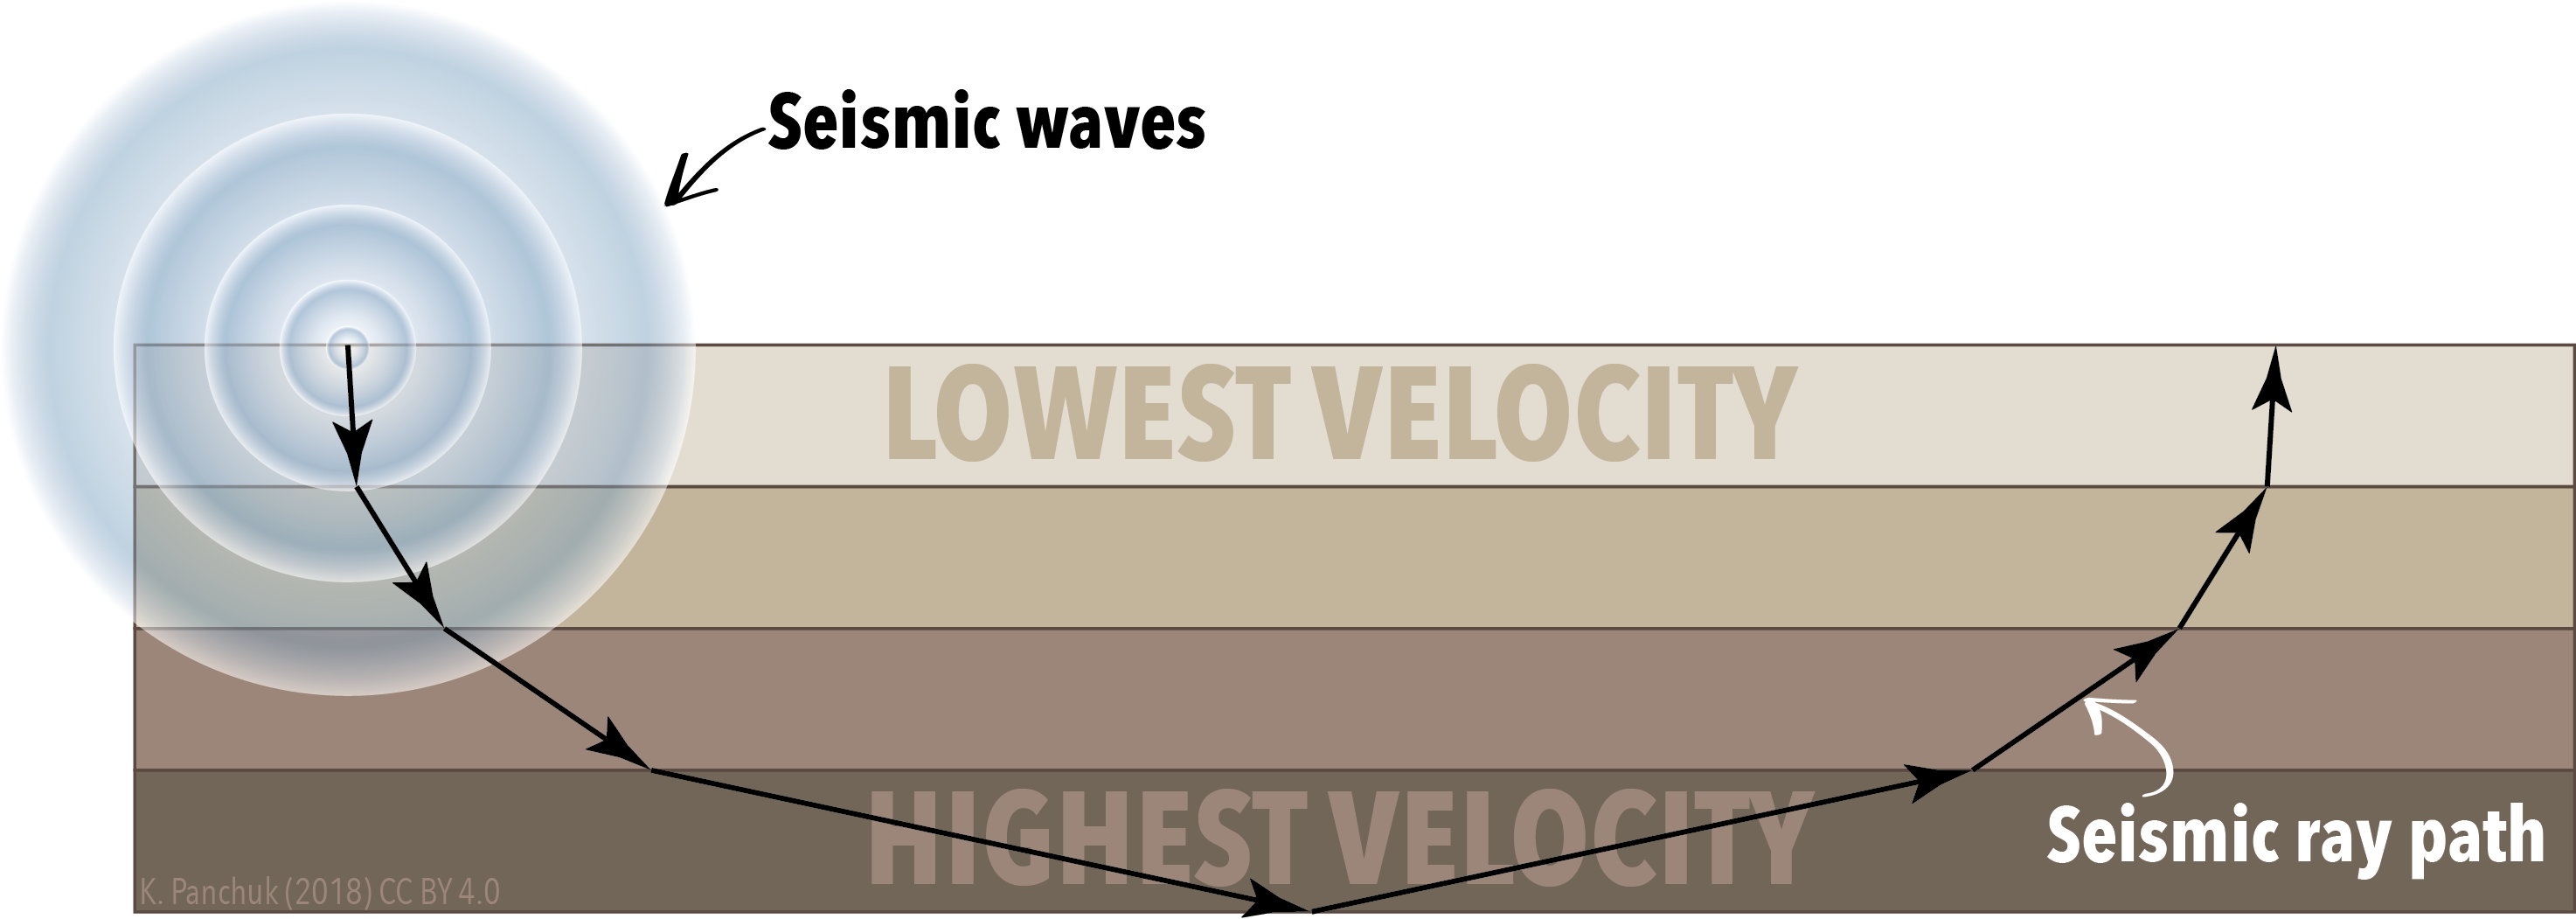
When seismic waves encounter a different rock layer, some might bounce off the layer, or reflect, as in the bottom layer of Figure 3.6. But some waves will travel through the layer. If the wave travels at a different speed in the new layer, its path will be bent, or refracted, as it crosses into the new layer. If the wave can travel faster in the new layer, it will be bent slightly toward the contact between the two layers. In Figure 3.6, the ray can travel progressively faster in each layer as it goes down through the layers, and it is bent slightly upward each time it crosses into the next layer. The reverse happens if the wave slows down. On the right side of the diagram, the wave is moving upward through slower and slower layers. It is bent away from the faster layer each time, causing it to take a more direct path to the surface.
Seismic velocities are higher in more rigid layers, so broadly speaking, they get faster deeper within Earth, because higher pressures make layers more rigid. They tend to take curved paths through the Earth because refraction bends their path until they are reflected and directed upward again, as in Figure 3.6.
Discoveries with Seismic Waves
The Moho: Where Crust Meets Mantle
One of the first discoveries about Earth’s interior made through seismology was in the early 1900s by Croatian seismologist Andrija Mohorovičić (pronounced Moho-ro-vi-chich). He noticed that sometimes, seismic waves arrived at seismic stations (measuring locations) farther from an earthquake before they arrived at closer ones. He reasoned that the waves that traveled farther were faster because they bent down and traveled faster through different rocks (those of the mantle) before being bent upward back into the crust (Figure 3.7).
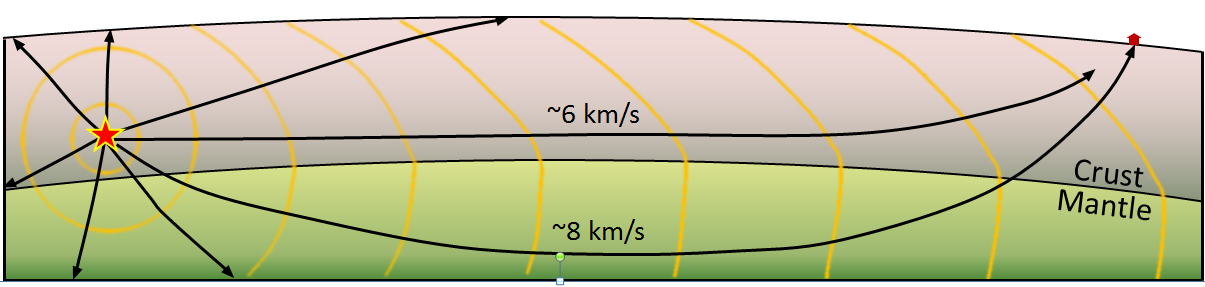
The boundary between the crust and the mantle is now known as the Mohorovičić discontinuity (or Moho). Its depth is between 60 – 80 km beneath major mountain ranges, 30 – 50 km beneath most of the continental crust, and 5 – 10 km beneath ocean crust.
The Core-Mantle Boundary
Arguments for a liquid outer core were supported by a distinctive signature in the global distribution of seismic waves from earthquakes. When an earthquake occurs, there is a zone on the opposite side of Earth where S-waves are not measured. This S-wave shadow zone begins 103° on either side of the earthquake, for a total angular distance of 154° (Figure 3.8, left). There is also a P-wave shadow zone on either side of the earthquake, from 103° to 150° (Figure 3.8, right).
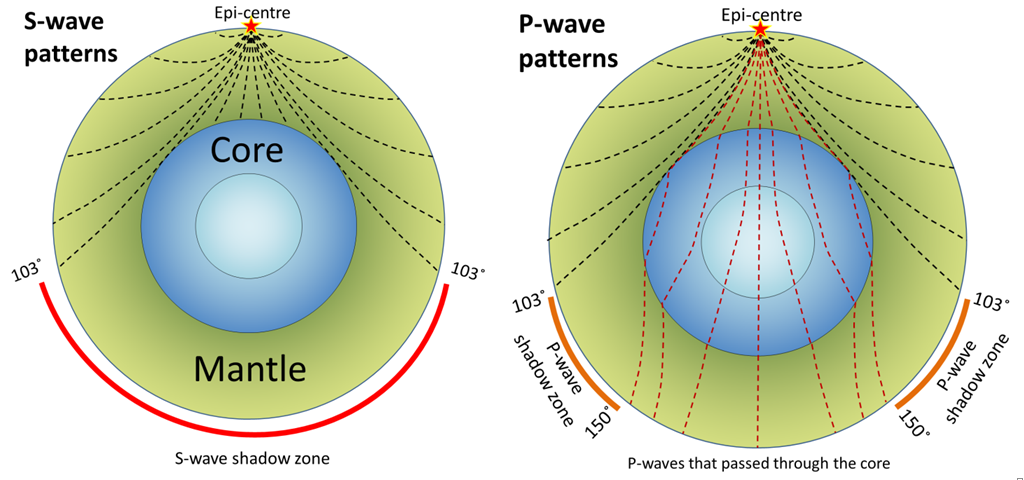
The S-wave shadow zone occurs because S-waves cannot travel through the liquid outer core. The P-wave shadow zone occurs because seismic velocities are much lower in the liquid outer core than in the overlying mantle, and the P-waves are refracted in a way that leaves a gap. Not only do the shadow zones tell us that the outer core is liquid, the size of the shadow zones allows us to calculate the size of the core, and the location of the core-mantle boundary.
Seismic Portrait of Earth’s Layers
The change seismic wave velocity with depth in Earth (Figure 3.9) has been determined over the past several decades by analyzing seismic signals from large earthquakes all around the world. Earth’s layers are detectable as changes in velocity with depth. The asthenosphere is visible as a low velocity zone within the upper mantle (Figure 3.9, left). There is an abrupt increase in P-wave velocity at 420 km, showing the depth at which minerals transform into structures that are more stable at higher pressures and temperatures.
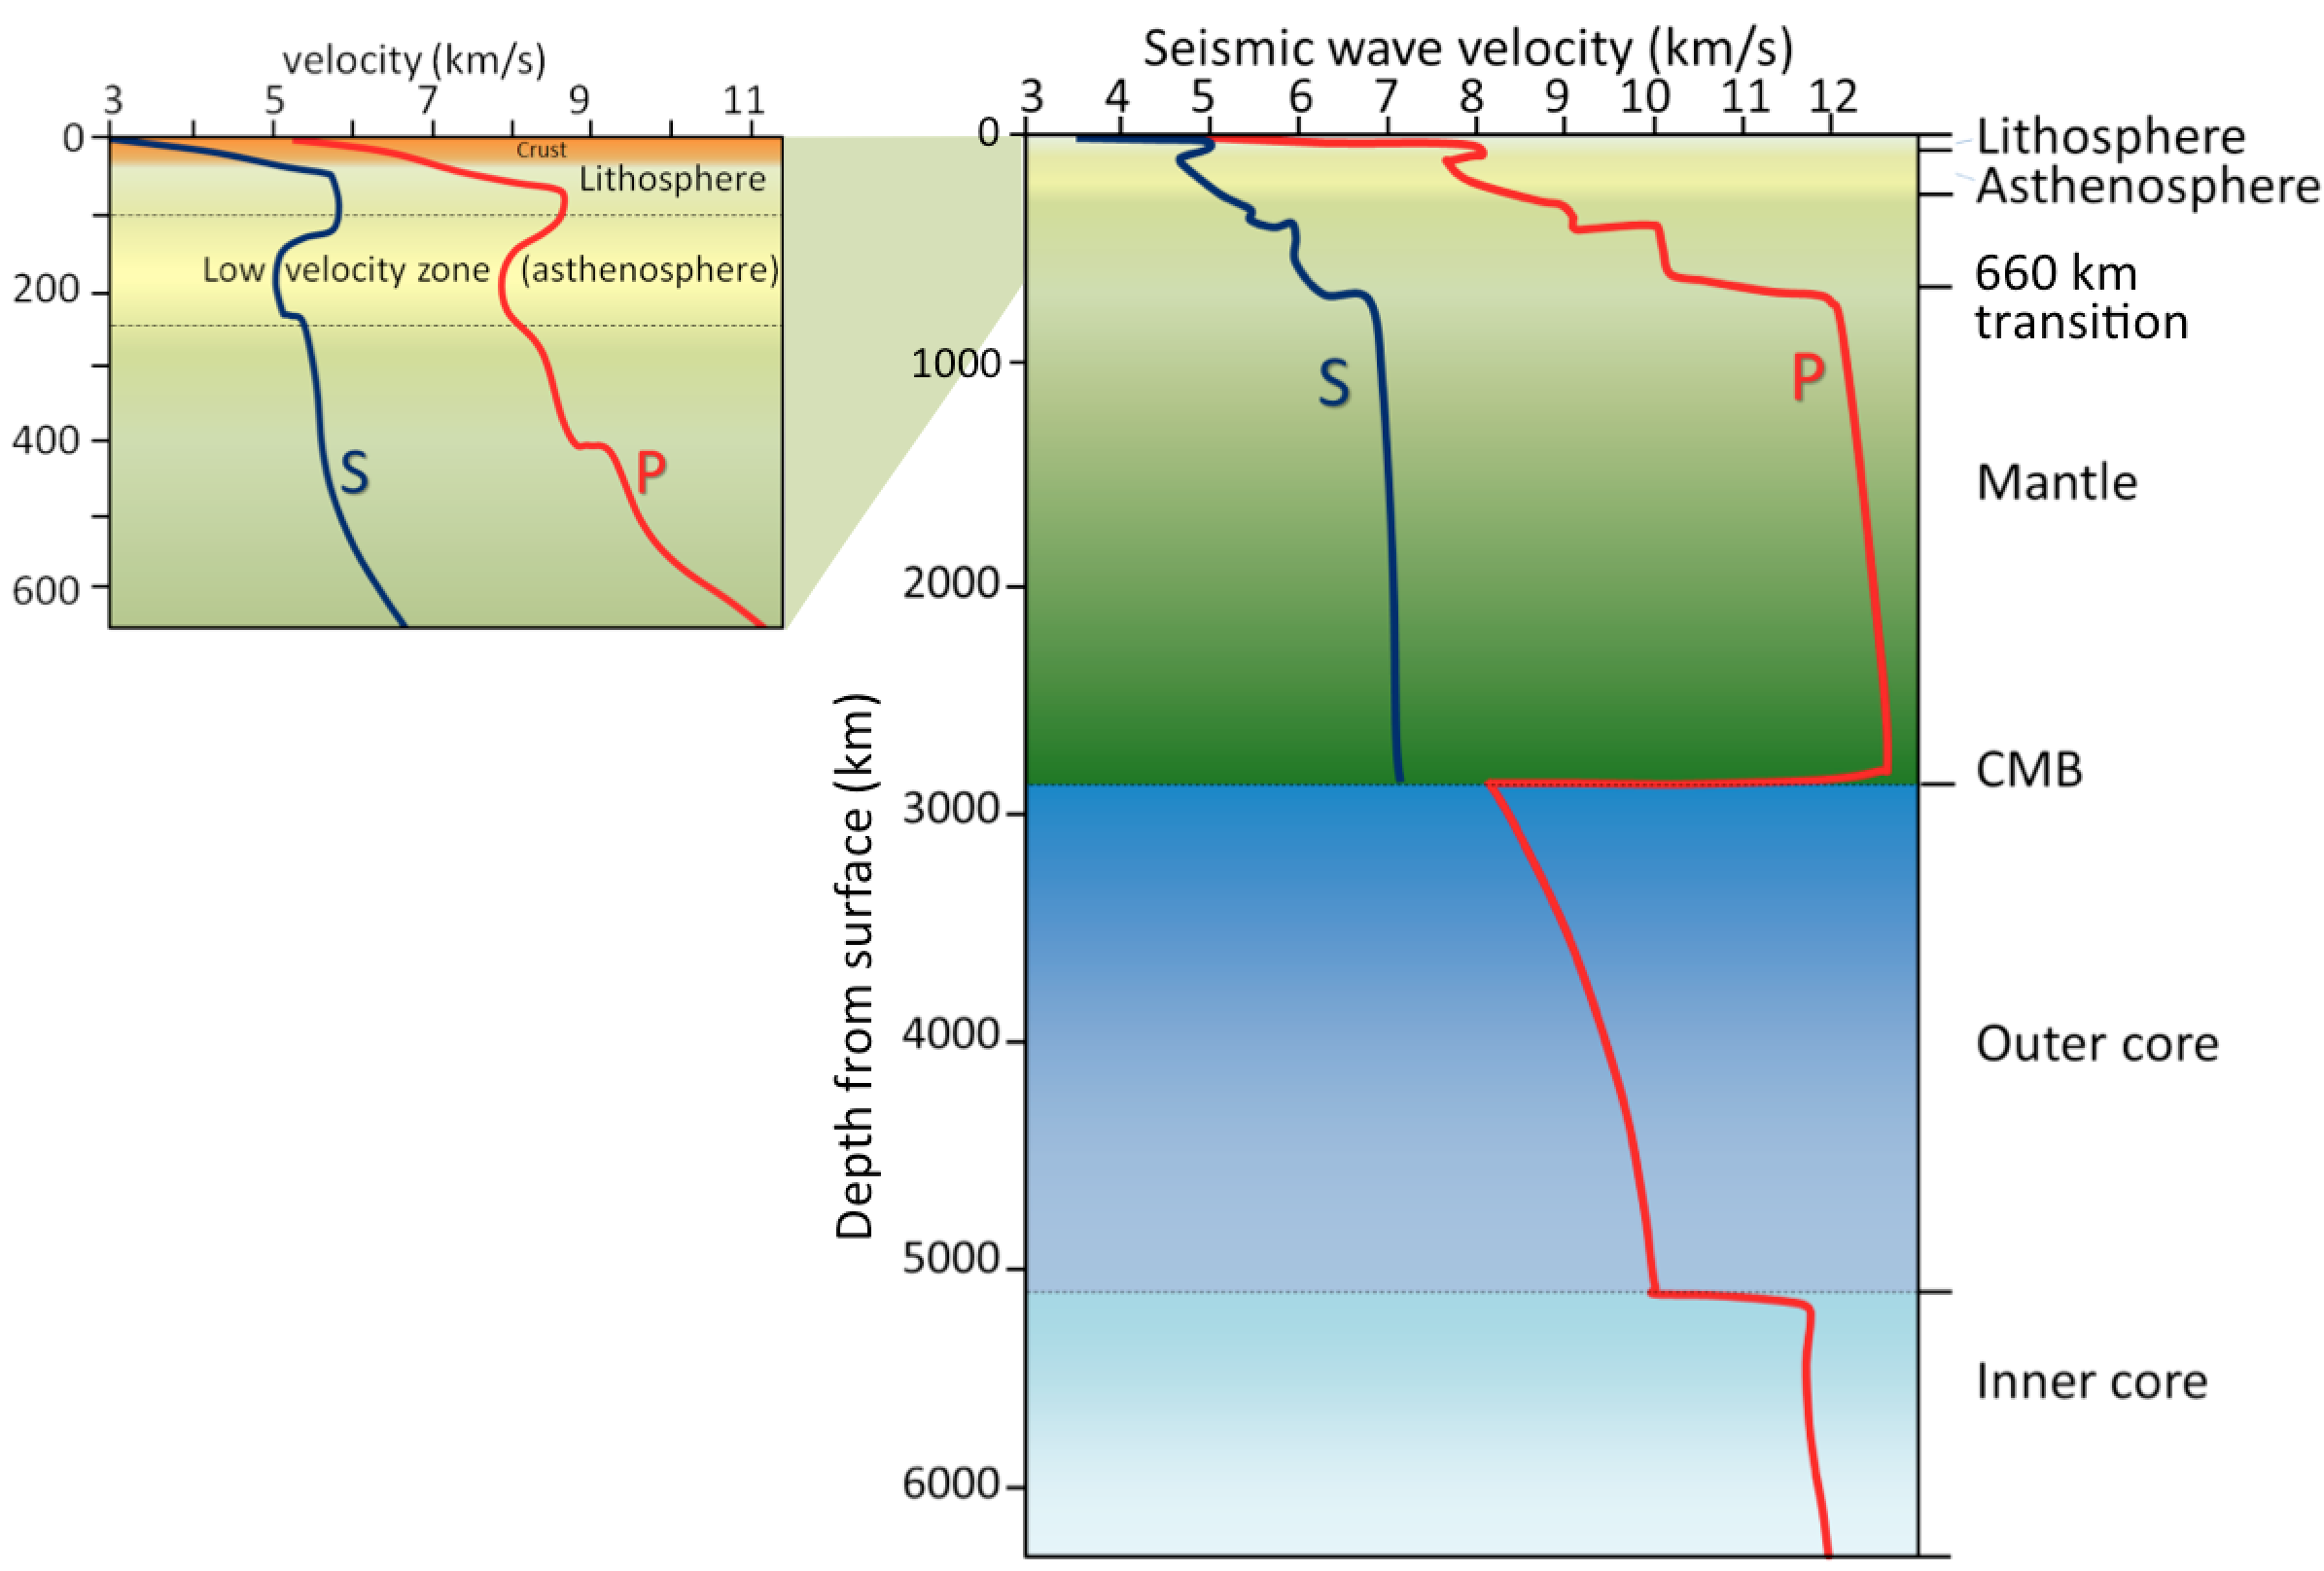
The boundary between the upper and lower mantle is visible at 660 km as a sudden change from rapidly increasing P- and S-wave velocities to slow or no change in P-wave and S-wave velocities (Figure 3.9, right). The core-mantle boundary (CMB in Figure 3.9) is apparent as a sudden drop in P-wave velocities, where seismic waves move from solid mantle to liquid outer core. The boundary between the outer core and inner core is marked by a sudden increase in P-wave velocity after 5000 km, where seismic waves move from a liquid back into a solid again.
Seismic Images of Plate Tectonic Structures
Using data from many seismometers and hundreds of earthquakes, it is possible to create images from the seismic properties of the mantle. This technique is known as seismic tomography. Tomography can be used to map out slabs of lithosphere that are entering the mantle, or have disappeared within it. Those slabs are cooler, and therefore more rigid than surrounding mantle rocks, so seismic waves travel through them faster. In Figure 3.10, higher-than-average seismic velocities in cool slabs are indicated in dark blue.
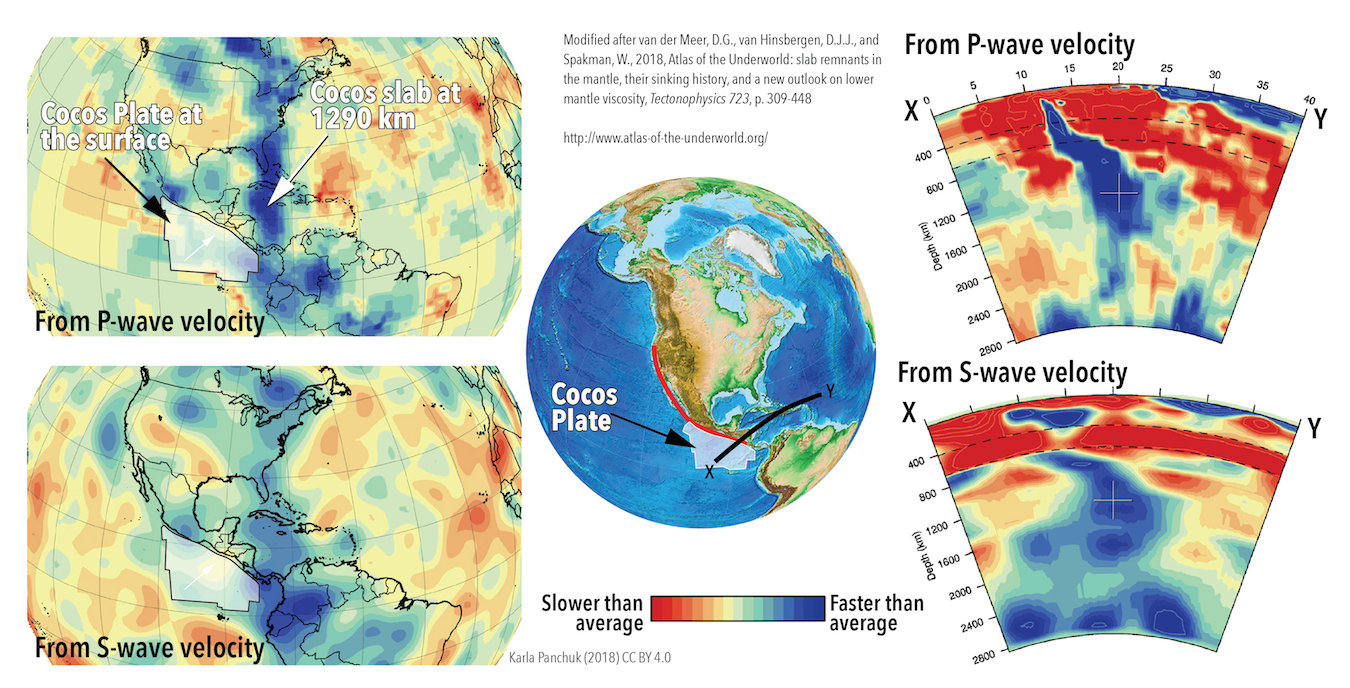
Thanks to the tomograms, we can see that the Cocos plate, which is colliding with Central America, is part of a much larger slab of lithosphere that has already settled onto the mantle. Tomograms representing a surface at 1290 km depth (Figure 3.10, left) show that at that level, the Cocos slab is beneath the Caribbean Sea. The tomograms on the right show a vertical view along the line X-Y marked on the globe. The vertical tomograms show us that the Cocos slab extends all the way down to the core-mantle boundary.
Visit the Underworld
What is the Atlas of the Underworld?
The Atlas of the Underworld is a catalog of more than 90 slabs of lithosphere that have been imaged within the mantle using seismic tomography. The Atlas includes tomographic images, locator maps, and geological histories for each slab. The catalog can be searched online at http://www.atlas-of-the-underworld.org/ or viewed in the original publication by van der Meer et al. (2018). The Atlas of the Underworld is an open-access resource. Visit the Atlas of the Underworld
The HADES Underworld Explorer
Create your own tomographic cross-sections for locations anywhere in the world by using this intuitive drag-and-drop tool. Visit the HADES Underworld Explorer
References
van der Meer, D.G., van Hinsbergen, D.J.J., and Spakman, W., (2018). Atlas of the Underworld: slab remnants in the mantle, their sinking history, and a new outlook on lower mantle viscosity. Tectonophysics 723, p. 309-448. https://doi.org/10.1016/j.tecto.2017.10.004
