
16.6 Welcome to the Anthropocene
Geologists still have not agreed on an official start date for the Anthropocene Epoch, but it is unlikely that they would disagree that we are presently in it. What this means in practical terms is that humans today are experiencing the results of past human influence on the Earth system, and humans in the future will experience the results of decisions made today.
Data on Key Sources of Radiative Forcing
The Intergovernmental Panel on Climate Change (IPCC) was established by the United Nations in 1988 to help with those decisions. Is responsible for reviewing the scientific literature on climate change and issuing periodic reports on several topics, including the scientific basis for understanding climate change, our vulnerability to observed and predicted climate changes, and what we can do to limit climate change and minimize its impacts.
In their Fifth Assessment Report, Summary for Policy Makers, the IPCC identified the main contributions to heating or cooling our atmosphere, and the impact they had in 2011 compared to 1750, before the industrial age (Figure 16.39). The main natural source of radiative forcing is the sun, but it contributes relatively little compared to anthropogenic sources. The greatest contribution over all comes from anthropogenic CO2 (top row). Note that the bar sizes indicate the relative contribution, and correspond to the scale at the bottom of the diagram. Bars to the left of the zero line indicate cooling of the atmosphere, and bars to the right indicate warming. The column on the far right indicates how confident scientists are in their assessment of radiative forcing for each source (VH = very high; H = high; M = medium; L = low).
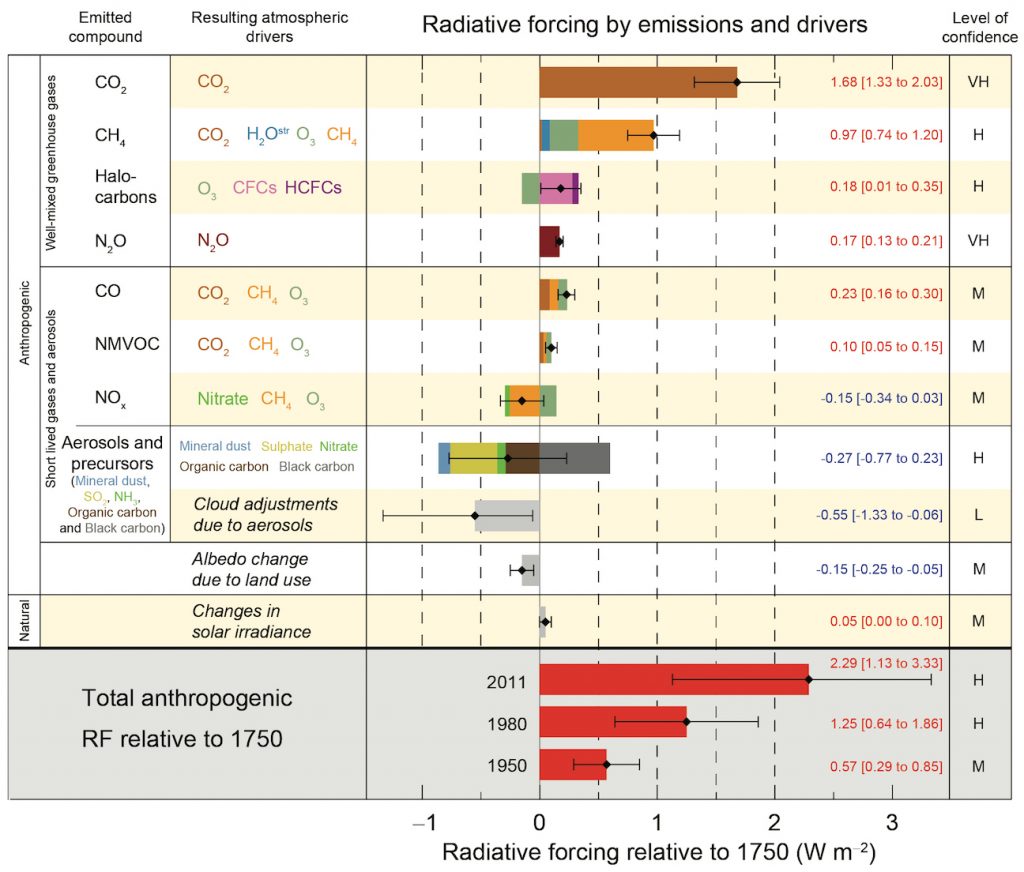
The biggest anthropogenic contributor to warming, CO2, accounts for 50% of positive forcing. CH4 and its atmospheric derivatives (CO2, H2O, and O3) account for 29%, and the halocarbon gases (mostly leaked from air-conditioning appliances) and nitrous oxide (N2O, from burning fossils fuels) account for 5% each. Carbon monoxide (CO, also produced by burning fossil fuels) accounts for 7%, and the volatile organic compounds other than methane (NMVOC) account for 3%.
CO2 emissions come mostly from coal- and gas-fired power stations, motorized vehicles (cars, trucks, and aircraft), and industrial operations (e.g., smelting), and indirectly from forestry. CH4 emissions come from production of fossil fuels (escape from coal mining and from gas and oil production), livestock farming (mostly beef), landfills, and wetland rice farming. N2O and CO come mostly from the combustion of fossil fuels. In summary, close to 70% of current anthropogenic GHG emissions come from fossil fuel production and use, while most of the rest comes from agriculture and landfills.
Projected Warming
The IPCC projects future warming by using scenarios that represent different possible paths that take into account global population, economic development, and global co-operation. In their best-case scenario, called RCP2.6 (RCP stands for representative concentration pathway, and 2.6 refers to a radiative forcing of 2.6 W/m2), global CO2 emissions begin to decline after 2020, and go to zero by 2080. Their worst-case scenario is RCP8.5, in which global CO2 emissions continue to rise rapidly. Intermediate scenarios reflect cases where global CO2 emissions eventually peak, but do not go to zero.
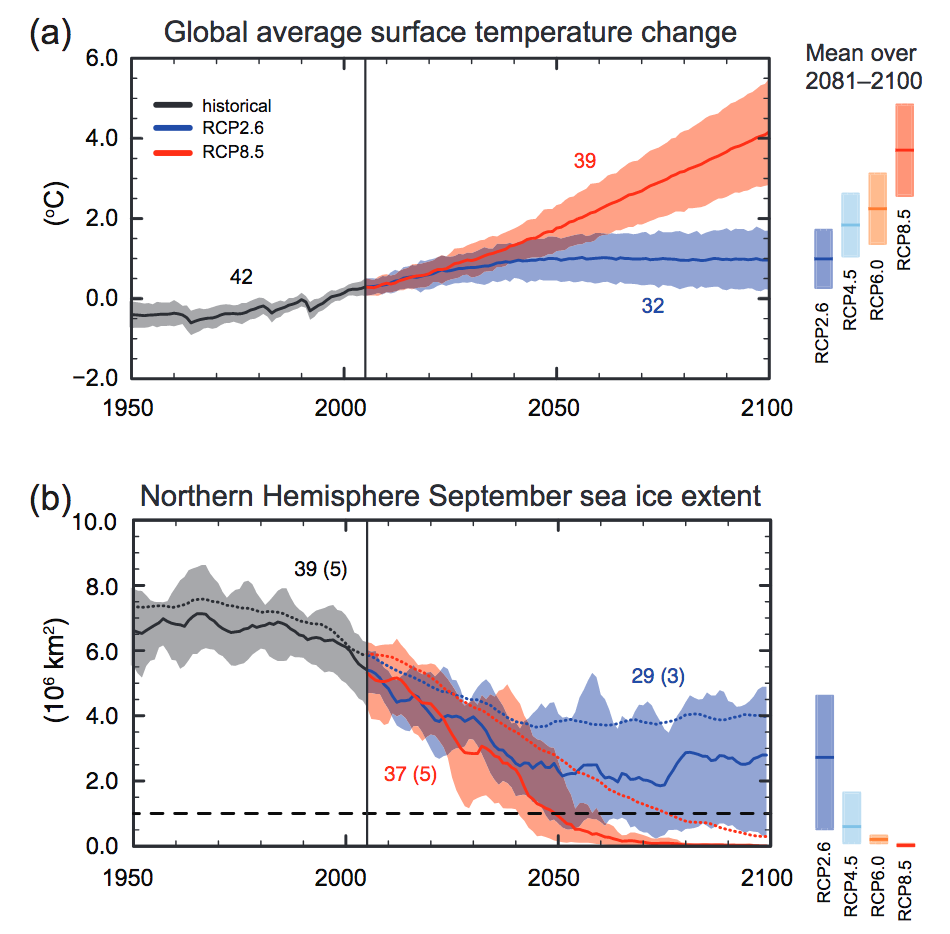
In the best-case scenario, temperatures stabilize at approximately 1 ºC above 1996 temperatures by the end of the century. As of 2018 there is no global plan in place that will meet the timeline of RCP2.6, and cause emissions to decline after 2020. For sea ice, all but the best-case scenario have the average sea ice extent beneath the dashed line, which effectively means the northern hemisphere would be ice-free.
Extreme Climate-System Events
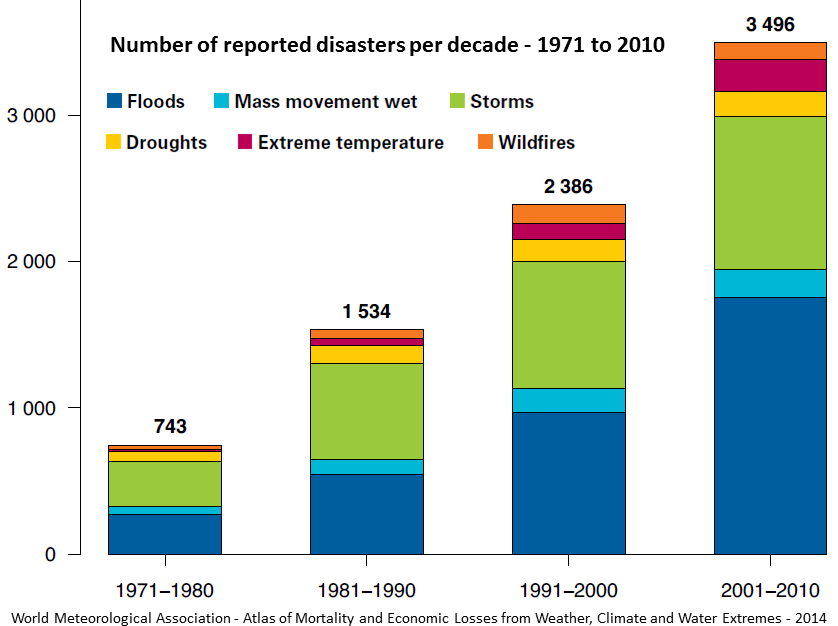
In 2015 the World Meteorological Organization (WMO) published an analysis of extreme climate-system events, and showed that the number of such events globally was almost 5 times higher in the decade 2001-2010 than in the decade 1971-1980 (Figure 16.41).
Analyses of natural disasters and extreme weather events by the European Academies’ Science Advisory Council (EASAC) showed that from 1980 to 2010, extreme weather, floods, and mass movement related to floods increased by more than three-fold in Europe. In the same study, analyses of insurance-industry data showed that globally, Europe and South America are the least affected. The number of events has been more than twice as great in Asia, Australia/Oceania, and North America (EASAC, 2013). The EASAC recently published an updat to their study, to include data up to 2016. They now say that floods and mass movement events have increased in Europe by more than 4 times from 1980 levels (EASAC, 2018).
Extreme Temperatures
The major types of disasters reported by the WMO report are related to climate are floods and storms, but the health implications of extreme temperatures are also becoming a great concern. In the decade 1971 to 1980, extreme temperatures were the fifth most common natural disasters; by 2001 to 2010, they were the third most common.
For several weeks in July and August of 2010, a massive heat wave affected western Russia, especially the area southeast of Moscow. Temperatures soared to over 40°C, as much as 12°C above normal over a wide area, and wildfires raged in many parts of the country. Over 55,000 deaths are attributed to the heat and to respiratory problems associated with the fires (Figure 16.42).

A clue to explaining the heatwave was simultaneous flooding in Pakistan: in July, rainfalls were 70% higher than normal, and in August rainfalls were 102% above normal. Flooding from heavy rains combined with a burst dam impacted 18 million people, killing 1,985. These events were linked by a change in atmospheric circulation that caused weather patterns to stall out over Russia and Pakistan. The change itself was due in part to a decrease in the temperature differences between high and low latitudes, caused by warming in the north.
Sea-Level Rise and Tropical Storm Impacts
Projections for sea-level rise to the end of this century vary widely (Figure 16.36), however it is already the case that low-lying coastal regions are experiencing increased flooding during storm events. Flood defenses designed decades ago are or will soon be insufficient in the face of increasingly frequent and more extreme storm events. In a 2008 report, the Organisation for Economic Co-operation and Development (OECD) estimated that by 2070 approximately 150 million people living in coastal areas could be at risk of flooding due to the combined effects of sea-level rise, increased storm intensity, and land subsidence. The assets at risk (buildings, roads, bridges, ports, etc.) are on the order of $35 trillion ($35,000,000,000,000). Countries with the greatest exposure of population to flooding are China, India, Bangladesh, Vietnam, U.S.A., Japan, and Thailand. Some of the major cities at risk include Shanghai, Guangzhou, Mumbai, Kolkata, Dhaka, Ho Chi Minh City, Tokyo, Miami, and New York.
One of the other risks for coastal populations, besides sea-level rise, is that climate warming is also associated with an increase in the intensity of tropical storms (e.g., hurricanes or typhoons), which almost always bring serious flooding from intense rain and storm surges. It is difficult for climatologists to ascribe all of the characteristics of a particular tropical storm to climate change, but it is much easier to make a case for why tropical storms in general would become stronger, and have more of an impact on coastal regions.
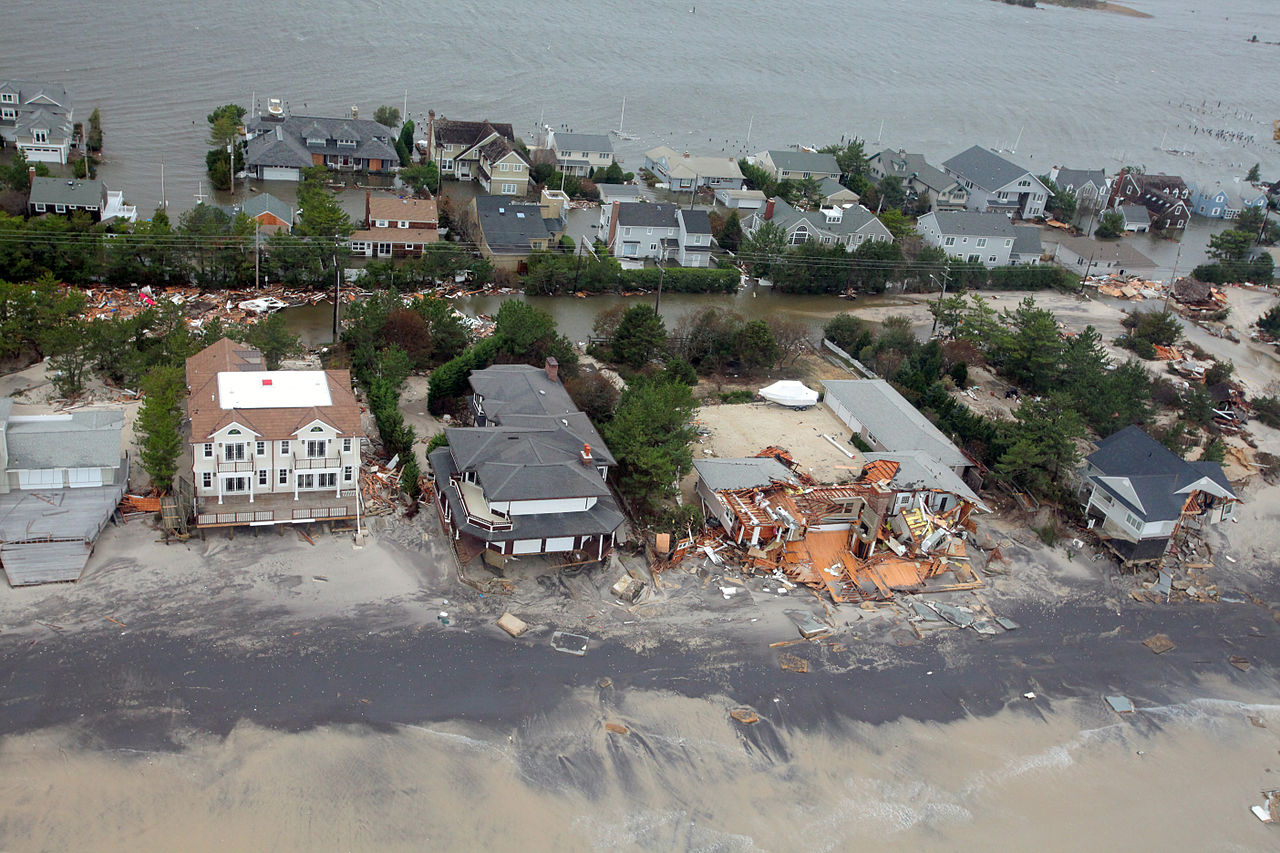
When Hurricane Sandy hit New Jersey and New York in 2012 (Figure 16.43), it had a devastating impact in part because it smashed into the coast directly rather than moving parallel to the coast. There was some speculation that the unusual path was the result of changes in atmospheric circulation that were related to climate change. We can’t say for certain whether climate change caused Sandy to move the way it did, but we can say with confidence that climate change worsened the impact of Sandy through sea-level rise. Consider that, over the previous 100 years, sea level had risen a foot at the southern-most tip of Manhattan Island. The island was hit by a 14-foot storm-surge, higher than it would have been without sea-level rise.
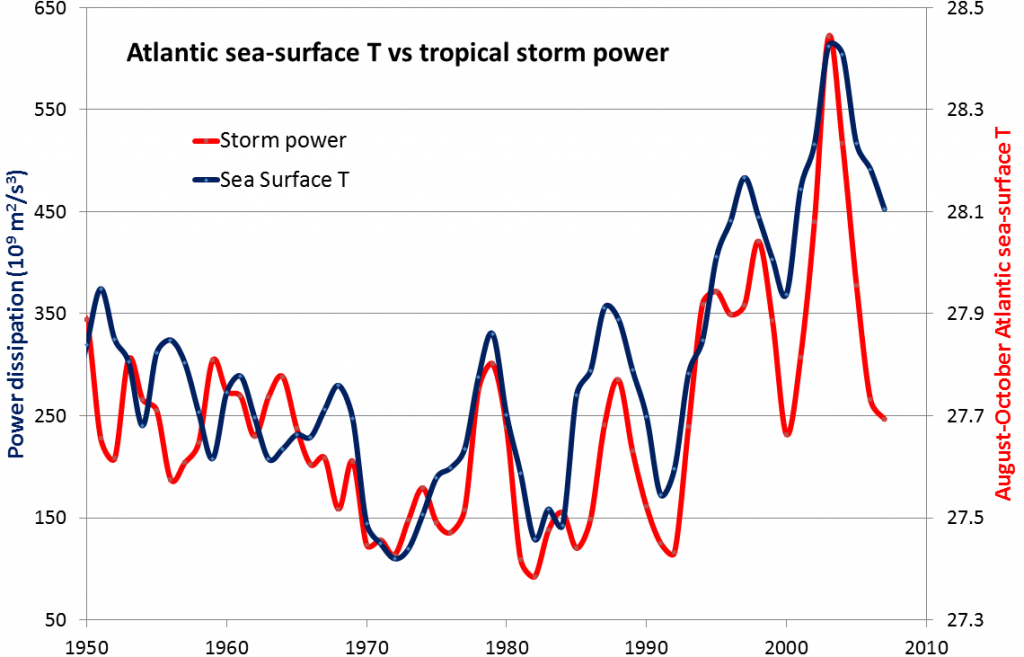
Tropical Storm Intensity
Tropical storms get their energy from the evaporation of warm seawater in tropical regions. In the Atlantic Ocean, this takes place between 8° and 20° N in the summer. A correlation has been observed between variations in the sea-surface temperature (SST) of the tropical Atlantic Ocean (Figure 16.44, red) and the amount of power represented by Atlantic hurricanes between 1950 and 2008 (blue). Not only has the overall intensity of Atlantic hurricanes increased with the warming since 1975, but the correlation between hurricanes and sea-surface temperatures is very strong over that time period.
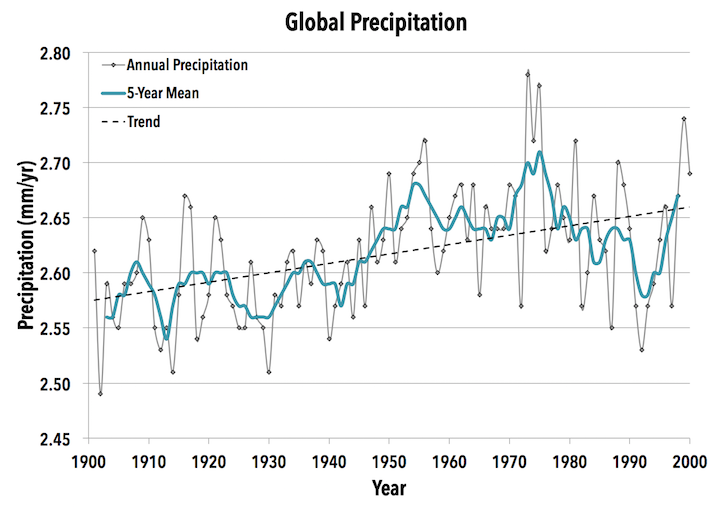
Because warm air is able to hold more water than cold air, the general global trend over the past century has been one of increasing precipitation (Figure 16.45). Note that this does not mean that precipitation has increased everywhere in the world. It means that even taking into account regions that have become drier, there is still more precipitation over all.
Thawing Permafrost
Most of northern Canada has a layer of permafrost that ranges from a few centimetres to hundreds of metres in thickness. The same is true in Alaska, Russia, and Scandinavia. One problem that northern communities are currently dealing with is that thawing permafrost is weakening sediments that were previously solid and stable. This can cause structures to settle, or even to sustain serious damage. Another problem with the weakening that occurs when permafrost thaws is that mass wasting can occur (Figure 16.46). This is particularly dangerous for northern communities along coastlines, where homes may be near the shore and the slopes beneath them further weakened by strong wave action during severe storms.

A longer-term issue with thawing permafrost is that micro-organisms begin to decompose organic matter within the newly thawed sediments, releasing CO2 and CH4. The amount of these greenhouse gases released by decomposing organic matter could be enough to generate a significant positive feedback, accelerating warming further. In some polar regions, including northern Canada, permafrost also includes methane hydrate, a highly concentrated form of CH4 trapped in solid form. Breakdown of permafrost releases this CH4 as well.
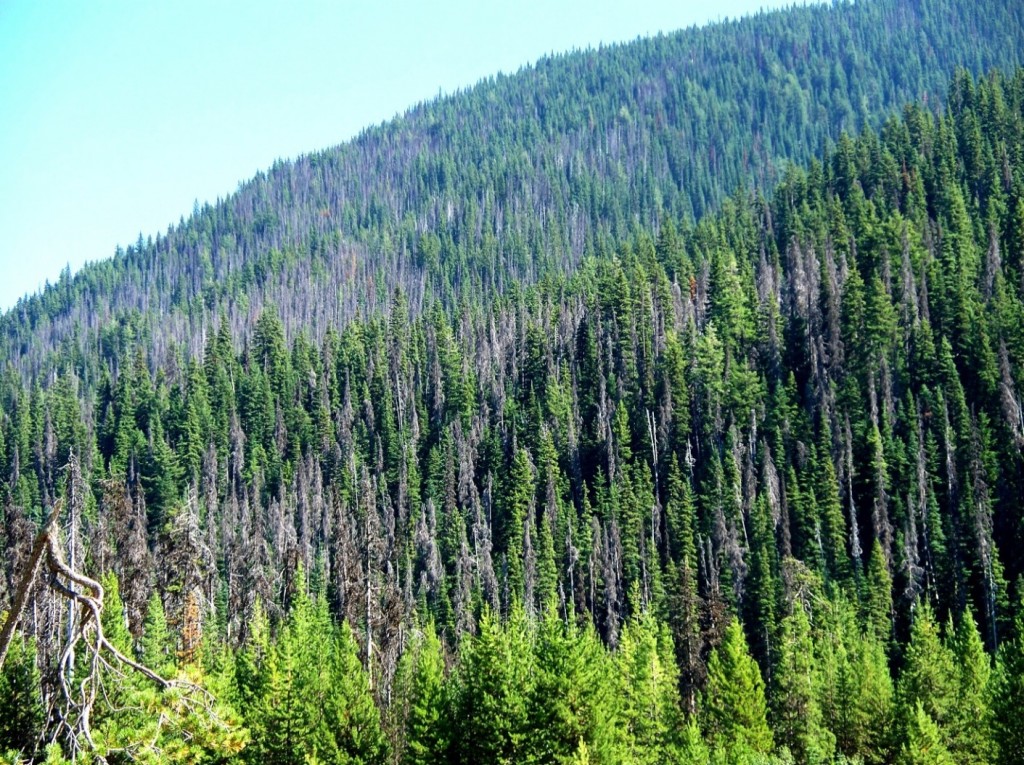
Pests and Disease
The geographical ranges of diseases and pests, especially those caused or transmitted by insects, have been shown to extend toward temperate regions because of climate change. West Nile virus and Lyme disease are two examples that already directly affect Canadians, while dengue fever could be an issue in the future. Canadians are also indirectly affected by the increase in populations of pests such as the mountain pine beetle (Figure 16.47).
References
Berwyn, B. (2017, 27 March). Climate Change-Fueled Jet Stream Linked to Brutal Floods and Heatwaves, Says Study. View at Inside Climate News
Charley, S. (2013, 13 June). Hurricane Sandy took highly unusual path, but climate change doesn’t get the blame – yet. View at GeoSpace
European Academies’ Science Advisory Council. (2013). Trends in Extreme Weather Events in Europe: Implications for National and European Union Adaptation Strategies. Halle (Saale), Germany: German National Academy of Sciences. Full text
European Academies’ Science Advisory Council. (2018). Extreme weather events in Europe. Preparing for climate change adaptation: An update on EASAC’s 2013 study. Halle (Saale), Germany: German National Academy of Sciences. Full text
Furphy, D. (2013, 28 September). What on earth is an RCP? A quick guide to carbon dioxide emissions scenarios used by the IPCC Assessment Report 5. View at Medium
Intergovernmental Panel on Climate Change. (2013). Summary for Policymakers. In: Climate Change 2013: The Physical Science Basis. Contribution of Working Group I to the Fifth Assessment Report of the Intergovernmental Panel on Climate Change [Stocker,T.F., D. Qin, G.-K. Plattner, M. Tignor, S.K. Allen, J. Boschung, A. Nauels, Y. Xia, V. Bex and P.M. Midgley (eds.)]. Cambridge University Press, Cambridge, United Kingdom and New York, NY, USA. Full text
Scott, M. (2011, 6 April). Heavy Rains and Dry Lands Don’t Mix: Reflections on the 2010 Pakistan Flood. View at Earth Observatory
World Meteorological Organization. (2014). Atlas of Mortality and Economic Losses from Weather, Climate, and Water Extremes (1970-2012). Geneva, Switzerland: World Meteorological Association. Full text
