
12.3. Earthquakes – Review Questions
- How does energy that builds up in the Earth’s crust relate to earthquakes?
- If a magnitude 4.0 earthquake occurred directly under Saskatoon due to a collapse of a potash mining tunnel, where would you locate seismometers to use to pinpoint the epicentre? Note: there are many answers you could give for this question. What is the minimum number of seismometers you would need to pinpoint the epicentre?
- How do P waves differ from S waves? Which one moves the fastest through rock? If you are located a few hundred kilometers from an earthquake epicenter, which seismic waves arrive last in a seismogram?
- How do the magnitudes and depths of earthquakes tend to vary with tectonic environments?
- What causes intraplate earthquakes? Give a few examples of places where intraplate earthquakes occur.
- Name some primary and secondary hazards of earthquakes. Describe each.
- Describe the process that generates a tsunami.
-
Draw and describe a cross-section of an earthquake on a fault, labelling the key descriptive features of the earthquake (e.g., epicentre, focus). To test yourself you can draw versions for different kinds of faults and earthquake environments (e.g., subduction zone, transform fault).
-
Draw and describe the different kinds of seismic waves.

![]()
- Draw picture(s) to help show how the size of the tsunami wave varies between the source of the tsunami and when it hits land. Label the drawings.
-
Highlight areas on the map of the lower mainland of BC below (Figure 12.3.1) that are at high risk if a megathrust earthquake occurs along the subduction zone below the coast of BC.
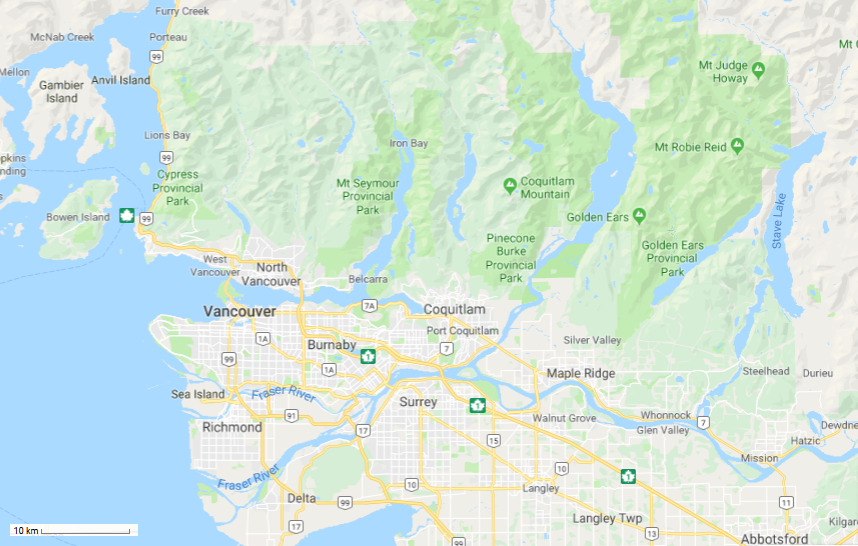
- Label and annotate the diagram to indicate why these areas are at higher risk than others. Where would you chose to buy a house and why? Note: some people choose to live in riskier areas because they sometimes have a better view, or are prettier – it’s up to you!
Extra review questions that may be covered in lecture (depending on your professor) that are not completely covered in the the textbook readings:
- How do we use seismic waves to monitor nuclear testing?
- The 2010 Haiti earthquake resulted in far more deaths and infrastructure damage than the 2001 Seattle earthquake. Discuss why this was the case. Consider differences in tectonic environment, geology, the earthquake magnitudes, and human considerations such as population density and building codes.
- In which tectonic environment would you find a Wadati-Benioff zone? Where are some specific locations around the globe where you would expect to find this pattern of earthquakes?
- Examine Figure 12.3.2 (below) showing the Wadati-Benioff zone under the Andes Mountains in South America.
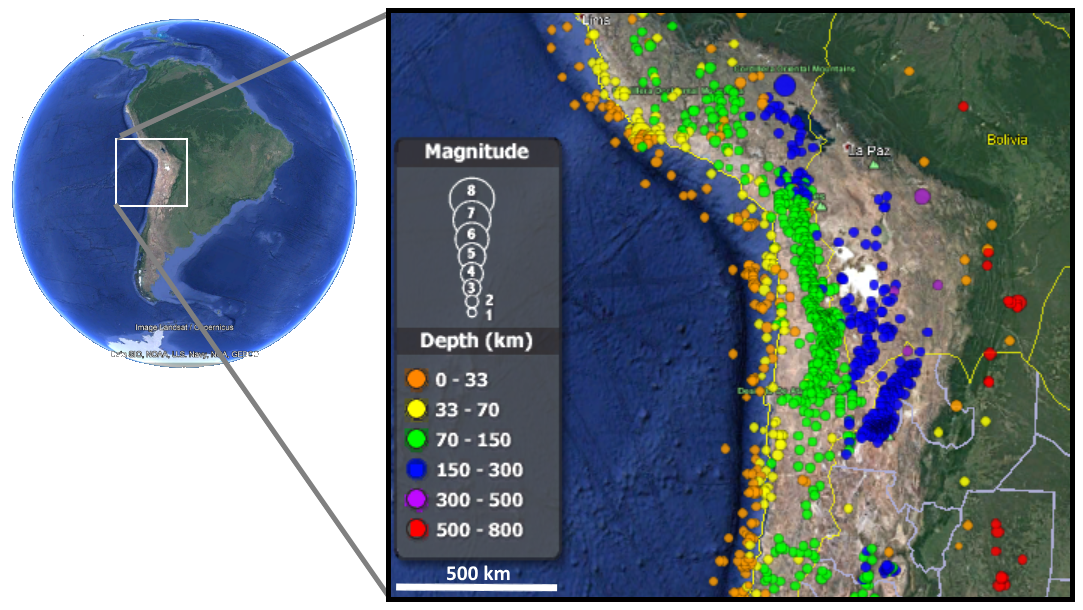
- Sketch a cross-section across the map area represented in Figure 12.3.2 from west to east in the box below. Plot the earthquakes (and their depths) on the cross-section. Using this information, reconstruct the position of the subduction zone under the Andes Mountains. Which direction is the subduction zone dipping in?

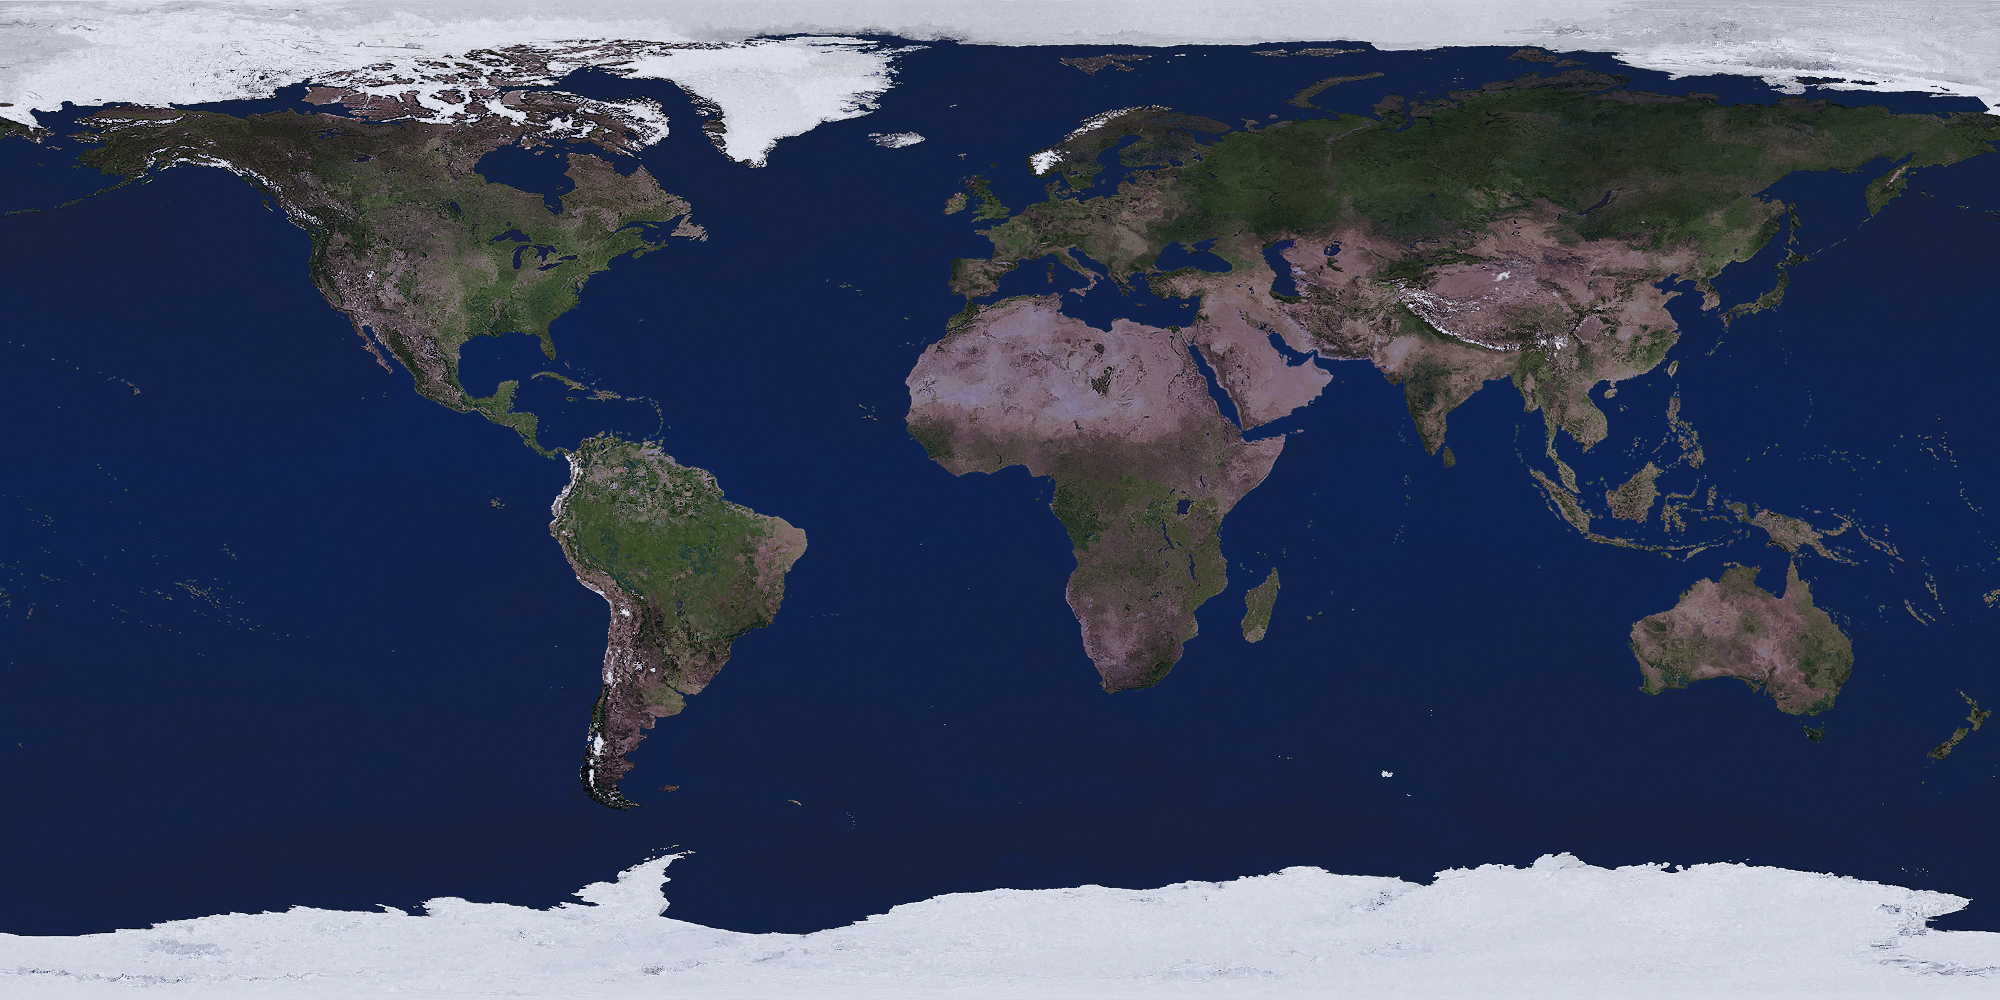
- Mark locations where Earthquakes commonly occur on the map below with asterisks. Tip: if you aren’t sure where earthquakes commonly occur, you can look at the USGS Earthquakes website for a real-time map of earthquakes that have happened recently.
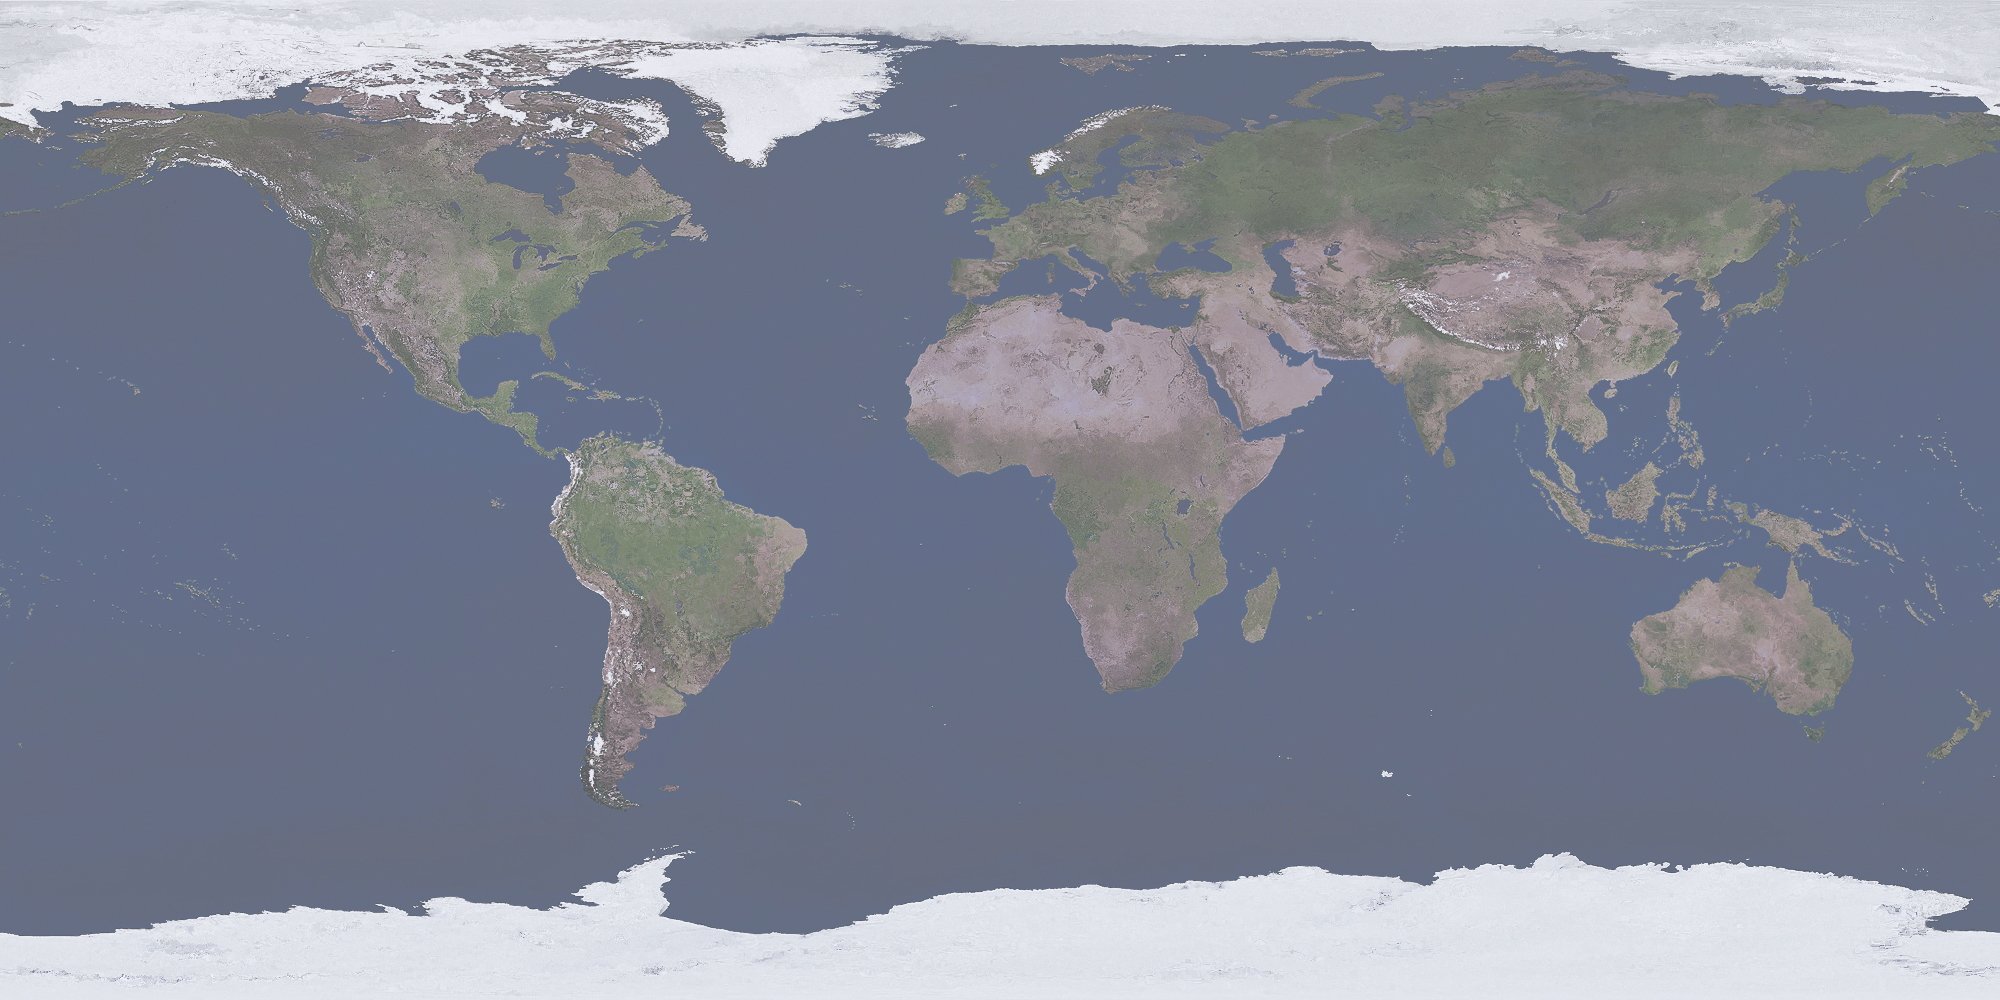
- describe how earthquakes are distributed over the surface of the Earth.
- Draw and describe how earthquake clusters occur around a major earthquake event (before, during, after, using the boxes below. How do the locations of the clusters differ before and after an earthquake?
- Draw a graph showing the distribution of cluster earthquakes through time and how their magnitudes vary over time using the x-y diagram below (don’t forget to label your axes!).
![]()
- Draw a cross-section diagram of the Earth’s crust with a low density rock layer overlying a high density rock layer.
- Label the layers.
- Draw an earthquake focus and epicentre on your diagram in the low density upper layer.
- If a P wave moves from the focus of the earthquake through the low density rock layer and into the high density rock layer, how does the direction of the P wave change? What is this phenomenon called?
