6 Thematic Maps
Thematic maps are intended to communicate a single theme or narrow set of themes. It is important to remember that thematic maps are different from reference maps. The primary purpose of a reference map is to deliver location information to the map user. Geographic features and map elements on a reference map tend to be treated and represented equally. In other words, no single aspect of a reference map takes precedent over any other aspect. Moreover, reference maps generally represent geographic reality accurately. Examples of some common types of reference maps include topographic maps such as those created by the United States Geological Survey and Canada National Topographic Series (NTS) and image maps obtained from satellites or aircraft that are available through online mapping services.
Thematic Map Types
Dot Density Maps
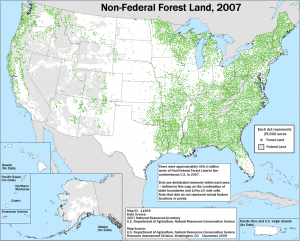
A dot density map is a map in which small symbols of uniform size are used to emphasize the spatial pattern of a phenomena. Each dot is equivalent to the same quantity. Dot density maps can be made multivariate (display data associated with more than one variable but using colour; different colours correspond to categories associated with a second variable, hence “multivariate”).
Map symbol is the dot.
Dots are placed randomly within an enumeration zone and are only used to indicate that a specified value of some variable exists in the general area. This type of map is dangerous as it may lead the map interpreter (reader) to believe that an actual occurrence of some variables exists at the point in space occupied by the dot.
Compare the distribution of dots on the accompanying figures.
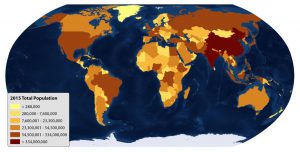
Choropleth Maps
A choropleth map is a map in which enumeration units (or data collection units) are shaded with an intensity proportional to the data values associated with those units. For instance, darker colours on the map might mean a higher value for the variable be represented. It is important that a choropleth map have clear titles and legends, so the viewer can understand what is being communicated.
Map symbol is the enumeration area.
In this usage, the term enumeration area is used generically, despite the use of the term in the past by Statistics Canada to refer to what is now called a Dissemination Area. Enumeration area is also, and has been, used by other countries to refer to specifically defined areas. For choropleth mapping enumeration areas are the areas with boundaries for which a single value for a mapped variable is available.
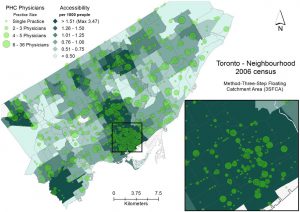
Proportional Symbol Map
Proportional symbol maps have points that are scaled in proportion to the magnitude of data occurring at point locations, such as using circles of varying sizes to represent urban population.
Symbol varies in size and can be of any type the map maker wishes, often a circle.
The size of the symbol (most often it is a circle, but it can be almost anything) is an important consideration for the cartographer. Some mapping packages will use the area as the proportional variable, but some use other values, such as the diameter of the circle (hmmm, how might that be turned into an exam question?). In the most common GIS software there is often a distinction for this kind of map between a continuous scaling of symbol size in accordance with the value for the variable being mapped and a categorized scaling of the symbol. When scaling is continuous there are as many symbol sizes as there are unique values for the variable being mapped; when scaling is categorical, there are as many symbol sizes as their are categories (as with choropleth maps).
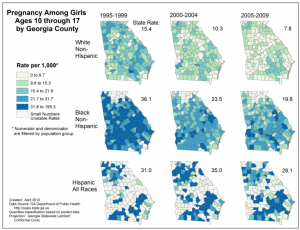
Small Multiples
When a theme or map objective requires the presentation of multiple variables and there are too many to fit on a single map, small multiples can be employed. Small multiples are repeated versions of the same geographic extent the only variation between each map being the variable mapped.