
13 Making Earth Flat: Map Projections
Introduction
Maps are flat representations of Earth. As we’ve learned, Earth is large and complicated, but we can simplify it so the information we want to display can be preserved, represented, and analyzed. An important step in the simplification is taking the surface of Earth and presenting it on a flat (planar) surface. When Earth’s surface is converted (projected) from 3 dimensions to 2 dimensions, there are trade-offs. In addition to going from round (and 3-D) to flat, the representation must be reduced in size. This is the map’s scale (see and Scale chapter for a definition of cartographic scale). All maps are projections, but only on small scale maps (remember representational fraction) does the distortion of the projection become readily apparent to anyone but a keen observer (like a student of geomatics). Maps of countries, continents, and the world, show their map projection distortions readily.
Organization of Chapter and Key Aspects of Map Projections
When projecting Earth’s surface onto a planar (flat) surface something is lost, or given up. A map project can preserve the accuracy of some aspects of the arrangement and characteristics of features, but at the cost of something else. That which is preserved is one way to classifying map projection.
What Can be Preserved, and What is Lost
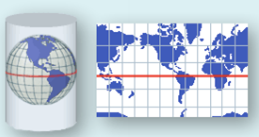
Shape: A map that preserve shape are called Conformal. The trade-off is that area is exaggerated. On a conformal map the shapes (of countries, islands, continents, etc.) are the same as they are on Earth’s surface or a globe. That area is distorted means that we can’t visually compare the size of different places on the map. On the map below compare (approximately) Alaska and Brazil. They might look similar in size, but Brazil is 5 times the area of Alaska. This is an example of a conformal map that minimizes distortion at the equator and preserves shape, necessarily exaggerating area as the distance from the equator increases.
Area: A map projection that preserves area is called an Equal Area projection. Like the conformal, there is a trade-off. That trade off is that shapes are distorted. Compare Alaska, or any place far from the equator, on this and the previous map.
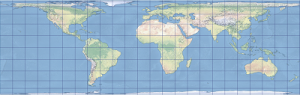
In the two maps above (and the “unprojected” perspective image of a globe, on the left in the top image) the arrangement of the lines of Latitude and Longitude are an indicator of the nature of the distortion resulting from the projection. Lines (parallels) of Latitude and (meridians of) Longitude are lines that intersect one another at 90 degrees on Earth. Lines of longitude meet at the poles, lines of latitude are a constant distance apart and, other than the equator, are shorter than lines of longitude. A great circle is a line that bisects a sphere; all lines of longitude are great circles, the only line of latitude that is a great circle is the equator. Both lines of latitude and longitude follow a direction consistent with a compass bearing, and those respective compass bearings are orthogonal to one another (I believe this is a complicated concept being communicated in some precise language, readers should sit back and ponder what these words mean).
Graticule and Grid
A graticule is an arrangement of lines intersecting at 90 degrees ON A SPHERE. A grid is an arrangement of lines intersection at 90 degrees ON A PLANE (a flat surface). So, if you are using a projected coordinate system, then locations are specified on a grid. If you are using an unprojected coordinate system (“geographic coordinate system” in Pro/ESRI) then you are specifying locations on a graticule.
Steps to a Projection
In order to get to a flat map projection there are a few steps.
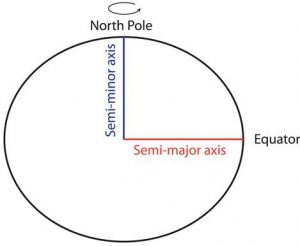
- Establish the size and shape for the model of Earth (and an orientation). Earth is big. Earth is Earth-shaped. However, to map it we simplify it to either a Spheroid or an Ellipsoid. A Spheroid is defined by a single diameter, all locations on the surface are the same distance from the centre of the sphere. An Ellipsoid is defined by two diameters, one for the poles and one for the equator. This results in a constantly (and smoothly) changing diameter from the equator to the poles. Earth is fatter at the equator than the from pole to pole. So, if we make the north pole the top, Earth is an oblate (“laying down”) ellipsoid. With the size and shape defined this is a Geodetic Datum.

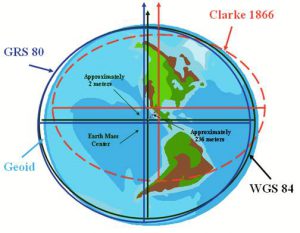
2. Once we have established a Geodetic Datum, the coordination of that shape with Earth can be set. This is similar to how the standard line for map projections established where on of the map (at a point or along a line, or lines) the scale is the same as the Geodetic Datum and is an undistorted representation of that point or line(s). Perhaps imagining trying to get two ellipsoids that are slight different into as close alignment with one another is a useful thought experiment. While different coordinate systems or projections might use the same geodetic datum (just the size and shape), it can be differently coordinated with Earth. For instance, WGS84 and NAD83 use the same geodetic datum (model for Earth’s size and shape), BUT they differ in where they are placed in relationship with Earth, where they touch Earth. Why? WGS stands for World Geodetic System, NAD stands for North American Datum, so the names offer a clue. WGS places the Datum so that errors are minimized globally, NAD places the Datum so that errors are minimized for place on or near North America (at the cost of accuracy elsewhere).
3. Projection of the surface of the Geodetic Datum from its 3-D surface to a 2-D plane
Making accurate maps of places requires a projection of Earth’s surface to a plane (flat surface). For this treatment a projection is a mathematical statement (algorithm) that defines the relationship between what is being represented (the surface of the geodetic datum) and the representation (the 2-D version of the surface). In order to portray the Earth’s surface, data must have a recording of the Geodetic Datum and its relationship with the Earth object (itself a type of representation). This relationship includes how they are associated (explaining where they come into contact with each other), the origin for the coordinate system, and the nature of the coordinate system. In the case of a Projected map, the coordinate system is also projected and therefore rectangular, consisting of lines intersecting at right angles.
