
4 Introduction: What is Geomatics?
Geomatics is a subset of study in the discipline of Geography. Geography is the study of the arrangement, interaction, and change of both physical/natural features and human activity on and near Earth’s surface. Human activity affects, and is affected by, the environment; geography is interested in these interactions, but also individual features or distributions of features. Geomatics involves a wide range of methods and technologies for collecting, managing, and analyzing data about Earth and the phenomena arranged on and near its surface. An important component of Geomatics is Geographic Information Systems (GIS); GIS uses spatial data to explore geographic phenomena. GIS includes communicating and visualizing spatial data; these aspects of GIS are commonly (and historically) associated with the field of cartography (the art and science of map making).
This text will cover many topics related to Geomatics, GIS, and Cartography. In addition to Geomatics, GIS, and Cartography, some of the topics that will be covered include:
Geodesy: The study of Earth’s size and shape, one goal of which is the definition of geodetic datums (models of Earth size and shape).
Remote Sensing & Aerial Photography: Making physical observations without direct contact or touch; aerial photography is limited to those observations made with photographic technology, while remote sensing is often associated with digital images, although the two share many common concepts and methods.
Global Position System (GPS): A system composed of earth orbiting satellites that produce accurate time signals that are used to determine precise and accurate location on Earth’s surface using a mathematical technique called trilateration (not to be confused with triangulation). see https://gisgeography.com/trilateration-triangulation-gps/
Geographic Information Science: The study and extension of GIS capabilities. While this topic emerged in the 1990s, GIS could not exist without the various advances in what we know about Earth as an object of study, how to systematically simplify it, and how we might examine the patterns that emerge from presenting reality using models (simplified representations).
First “Law” of Geography
In 1970, the geographer and cartographer Waldo Tobler coined the 1st law of geography (Tobler, 1970); the “1st Law” states: Everything is related to everything, but near things are more related. In many ways this pithy statement summarizes why GIS, geomatics, and mapping are possible. In geography, because the world is so large and the physical and social landscapes are so complicated, it is necessary to model and represent what we know. One of the first steps toward mapping is making models of Earth that simplify its size and shape. When we want to map phenomena that are arranged across Earth’s surface, we need to generalize and combine individual observations. Given the fact that the physical landscape varies continuously, and not abruptly, we can make maps that simplify the complexity of the real world. Similarly, when summarizing social phenomena on maps, such as income, voting, residential style, race, ethnicity, etc. we often give areas occupied by many people a single value.
For instance, in the three figures below, income in Saskatoon, SK has been displayed by taking the average income of three different types of areas (neighbourhoods, census tracts, and census dissemination areas). Each “area,” or unit of analysis, has a single value that value is used to determine what shade of green it is assigned. The value might be the average, total, median, or mode; independent of how we numerically (statistically) summarize the many individual values, the fact that we can simplify reality in such a way. The resulting maps display the geographic trend of income across Saskatoon (the area of study). This type of map is called a choropleth map (and will be covered in the third part of the Maps and Mapmaking section). By comparing the three maps you should be able to see that the general trend of income is similar, but that each is different in subtle ways. The advantage of generalizing income by taking an average is that the map reader can see the geographic pattern; the disadvantage is that we can’t determine the income of any single resident or the specific average income for a neighbourhood. However, if we did place the incomes of each household on the map, the pattern would be lost.
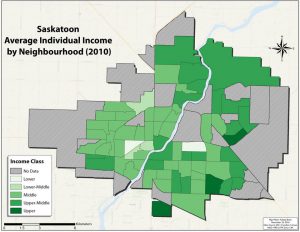
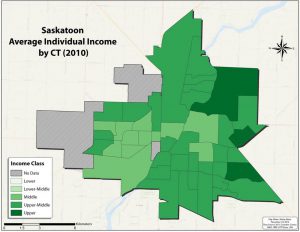
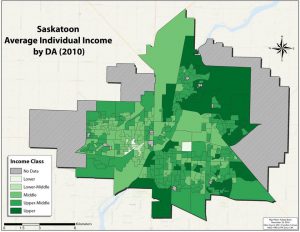
That we accept such maps as reasonable representations of the pattern of income variation in Saskatoon is an example of what can be achieved as a result of the 1st “law” of geography. A final comment of the 1st “law” is my own choice to put the word law in quotation marks. This suggests that the word law should not be take literally. In this case, it is important to accept that the principle of the 1st “law” of geography holds for many phenomena and under many conditions, it is not a physical or immutable law. Even for a pattern like the one above, there are low income residents in high income neighbourhoods and vice versa. Furthermore, we should not assume that everyone who lives in a high income neighbourhood is a high income individual or has an income at or near the value assigned to that neighbourhood (through mathematical or statistical calculation). To draw a conclusion about an individual based on the group to which they belong (in this case an individual residing in a high income neighbourhood) is an example of the ecological fallacy, and is a common risk when making thematic maps, such as these choropleth maps.
Geographic Information Systems exist as a tool for geographic exploration and investigation. GIS support a digital representation of geography and as such rely on aspects of data, databases, computation, and abstraction. Because their essence is digital, GIS representations have difficulty portraying aspects of reality that cannot be measured or assigned a value. This includes emotions, feelings, or other qualitatively assessed phenomena. In portraying geography digitally, GIS relies on storing information as data. GIS data generally falls first into two categories: Spatial and Non-Spatial data. Spatial data provides the spatial structure to which non-spatial data is assigned. The spatial structure must accommodate both geography (political units, physical features, locations, roads, cities, etc.) and cartography (be something that can be “drawn,” such as points, lines, and areas). If a line represents a road, and a string of Latitude and Longitude coordinates define the line’s position and extent, then the combination of spatial data (string of coordinates) and non-spatial data (categorized as road) makes it geographic information.
Tobler W., (1970) “A computer movie simulating urban growth in the Detroit region”. Economic Geography, 46(2): 234-240.
