Chapter 3 – Principles of Imaging Techniques
Ultrasound (US)
This modality relies upon high frequency, inaudible, sound arising from a piezoelectric crystal, in a hand-held transducer, for the creation of images. Hence the nomenclature of “ultrasound”. The ultrasound transducer emits sound roughly 5% of the time and then listens for the returning echoes 95% of the time. Ultrasound transmission is facilitated by acoustic gel that is applied to the probe and to the patient’s skin to minimize the air-gap.
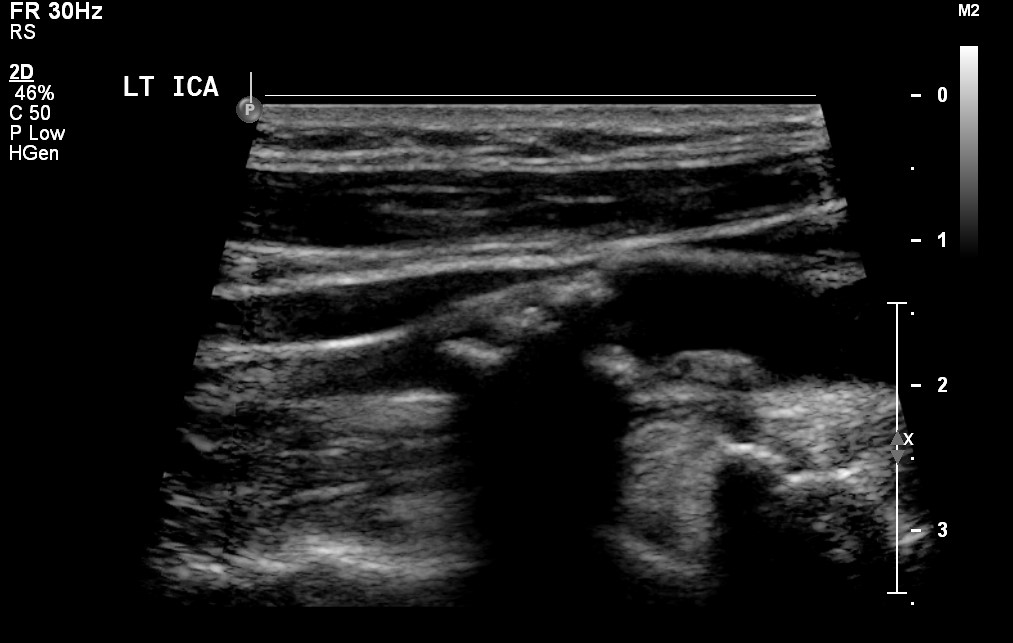
The returning sound is altered in wavelength and intensity and arrives back to the probe after being reflected from tissues of different depths beneath the skin. Based upon the absorptive or reflective properties of the anatomy being assessed, the ultrasound machine assigns a pixel brightness to that particular tissue. A complex, computer driven, algorithm determines the characteristics of the returning echoes and displays the sound on a gray scale. No echoes returning to the transducer is represented as black, while areas that return a larger proportion of the sound to the transducer are white. The image displayed on the ultrasound machine monitor is a real-time, constantly refreshing, image that actively displays the changing location of the ultrasound probe. Images stored for future review in PACS are screen captures from the real-time imaging feed and are stored to preserve images that become part of the patients’ medical record. These images are called B-mode. (Figure 3.31)
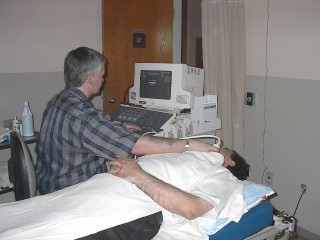
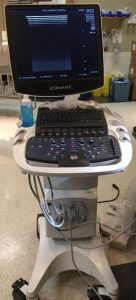
The patient lies in anatomic position for the most part but may be asked to roll to different positions to determine if entities such as calculi or fluid move with change in patient position. Ultrasound is the most difficult modality to understand from an anatomic standpoint as ultrasound images are not acquired with a standardized position of the ultrasound transducer in reference to anatomic position, or in reference to the patient’s anatomy. Also, as the patient moves during the ultrasound examination this introduces further variability in the appearance of the acquired images that is not a factor for other imaging modalities. Figure 3.32A depicts standard fixed location ultrasound machine, while Figure 3.32B demonstrates a smaller, mobile unit.
Static Ultrasound Machine
Mobile Ultrasound
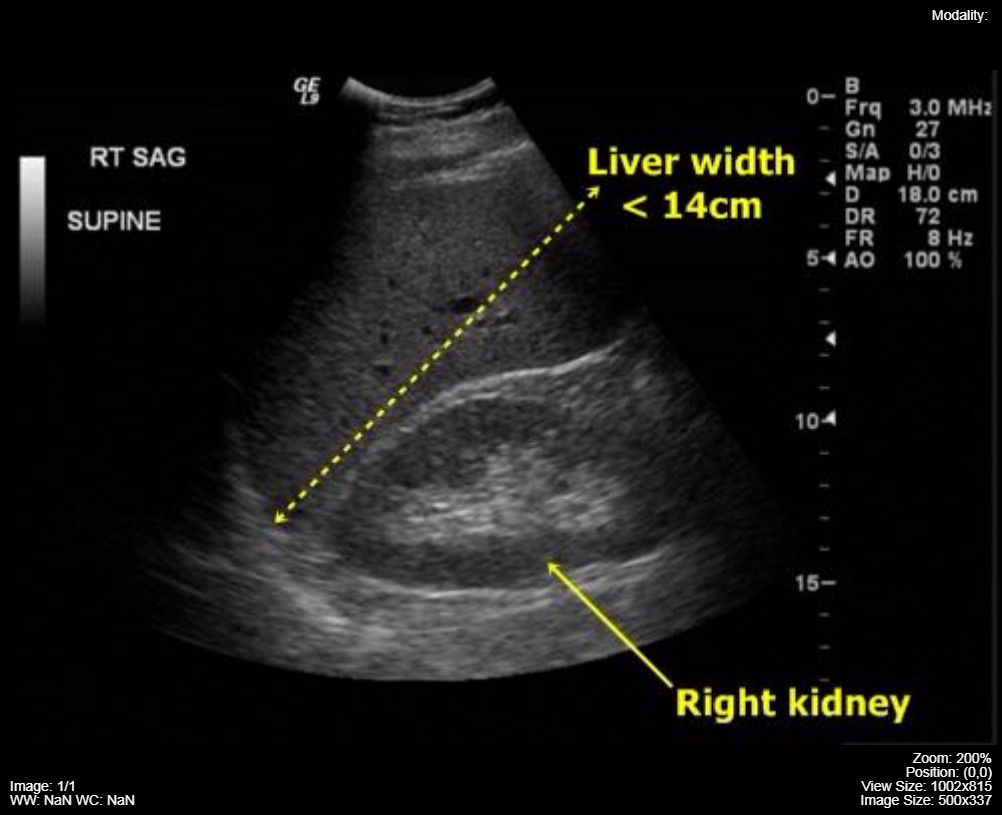
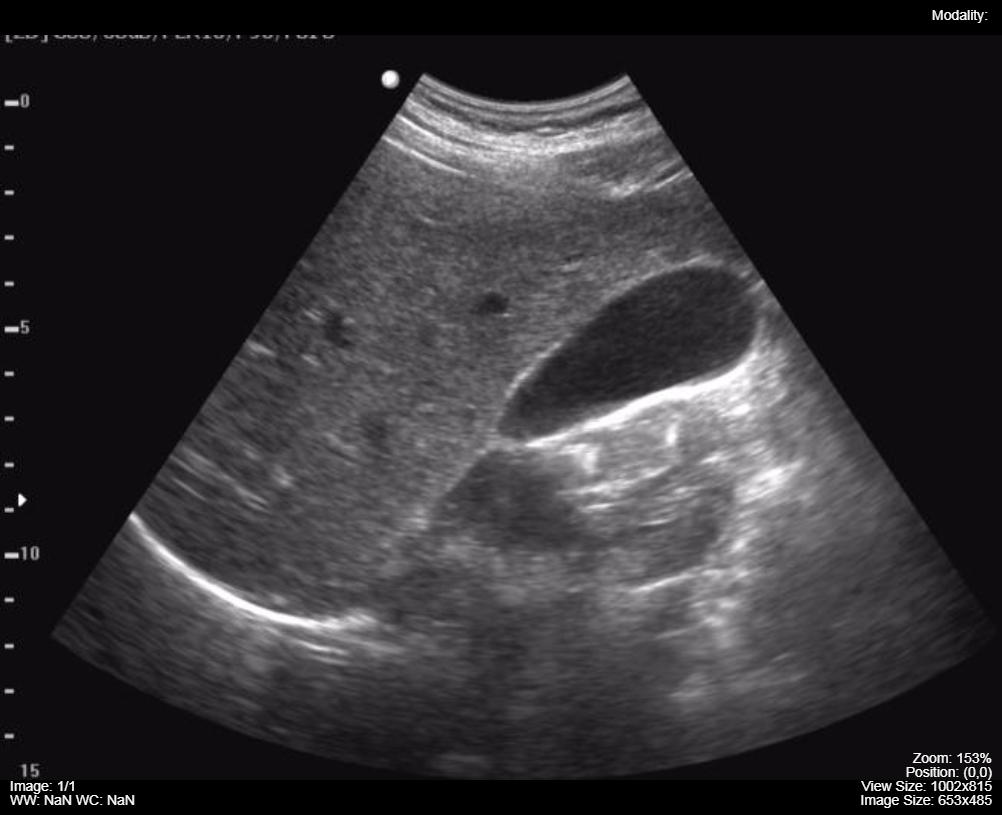
Ultrasound images are described in terms of their relative echogenicity. Water is the least complex structure seen on ultrasound and it returns very few echoes back to the transducer, therefore, it has very low echogenicity (anechoic) and is seen as a black structure on the image. An example, of a low echogenicity anatomic structure is a renal cyst or bile in the gallbladder. More complex anatomy results in more sound being echoed back to the ultrasound transducer for conversion to image pixels and is described as being echogenic (brighter) on ultrasound. The liver is an echogenic anatomic structure and is usually more echogenic than the renal cortex. See Figure 3.33.
Note the much lower echogenicity of the normal gallbladder contents in Figure 3.34:
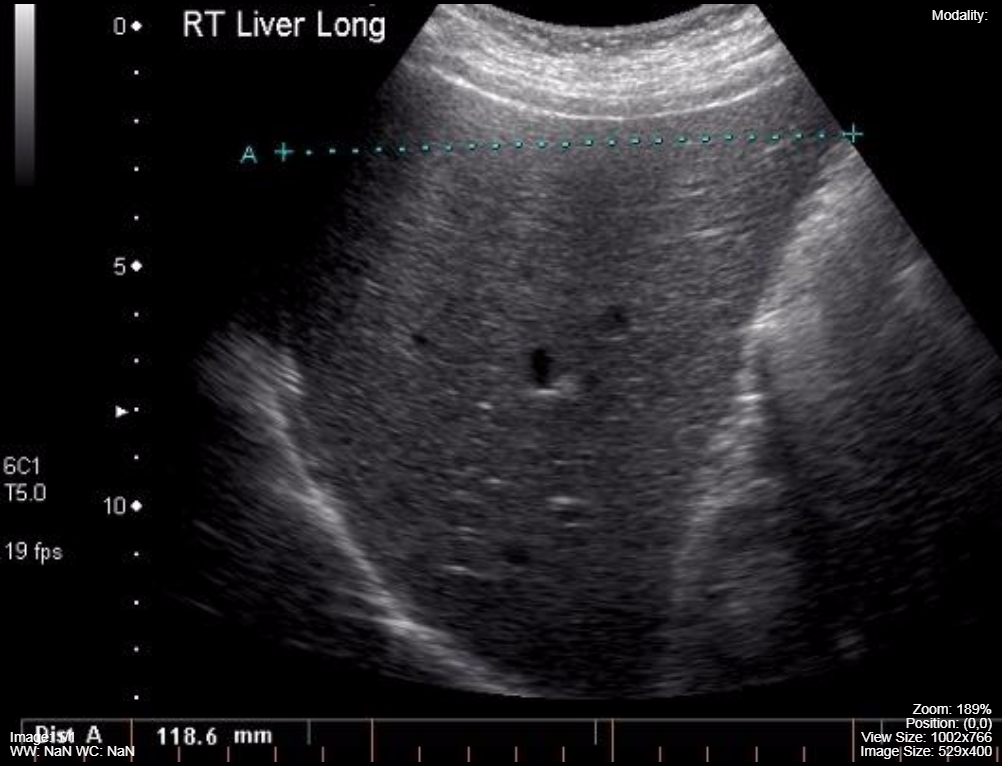
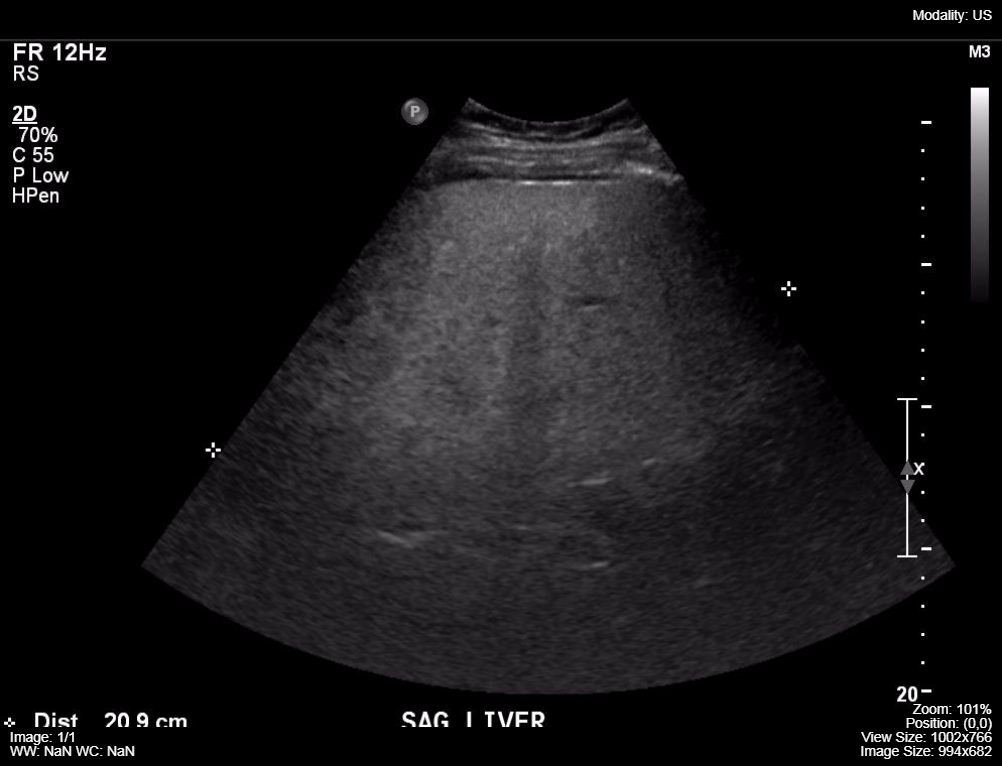
The echogenicity of an organ can change dependent upon the infiltration of tissues with lipid. Hepatosteatosis (fatty liver) is an abnormal increase in lipid within the hepatocytes of the liver. It is often associated with an enlarged liver. Figure 3.35 demonstrates an image of a normal liver and then an enlarged liver (20.9 cm cranial-caudal, normal < 15 cm) with a very increased liver echogenicity and absorption of the ultrasound beam leading to loss of anatomic detail in the deep liver.
Normal
Hepatomegaly and Hepatosteatosis
Ultrasound:
- Anatomy appears black when sound waves are not reflected back to the ultrasound transducer
- Anatomy appears white when sound waves are reflected back to the ultrasound transducer
- Anatomy is described by its relative echogenicity i.e. liver is more echogenic than normal bile and the renal cortex is less echogenic than liver parenchyma
Terminology
Echoic: Sound is reflected back from the tissue to be measured by the ultrasound machine.
Anechoic: Sound is not reflected back to the ultrasound probe from this tissue.
Hypoechoic: The sound reflected back to the ultrasound probe is decreased in comparison to some other tissue in the anatomy being assessed i.e. the bile in the gallbladder is hypoechoic in comparison to the liver.
Hyperechoic: The sound reflected back is increased in comparison to some other tissue in the anatomy being assessed i.e. the liver is hyperechoic compared to the bile in the gallbladder.
Doppler Ultrasound
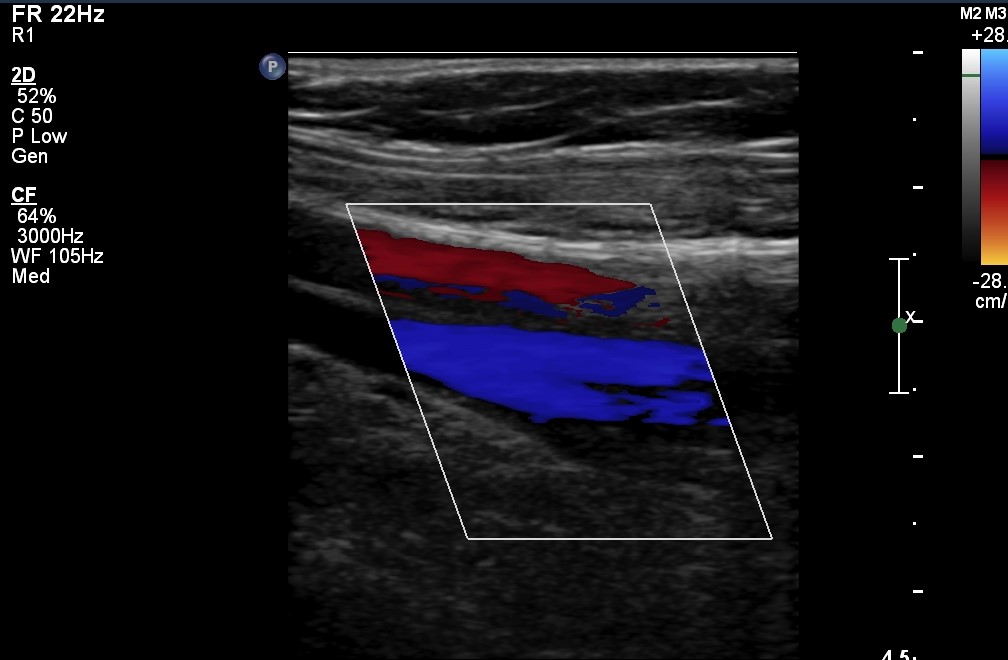
Ultrasound can analyze flowing fluids and determine if there is a frequency shift over the length of a structure using the Doppler principle of the changing frequency of sound waves as they travel over a distance (like the ambulance siren as it approaches and recedes from the detector, the ear). Static B-mode images associated with Doppler assessment is called Duplex Doppler. Colour can be applied to the imaging to represent the direction of blood flow in relation to the ultrasound probe. By convention blood flowing toward the transducer is an orange-red colour and flow away from the transducer is a blue color. (Figures 3.36) Colour Doppler images are often displayed with a spectral pattern of flowing blood on the same image, representing changes in blood velocity with systole and diastole. (Figures 3.37)
Colour Doppler
Colour and Spectral Doppler
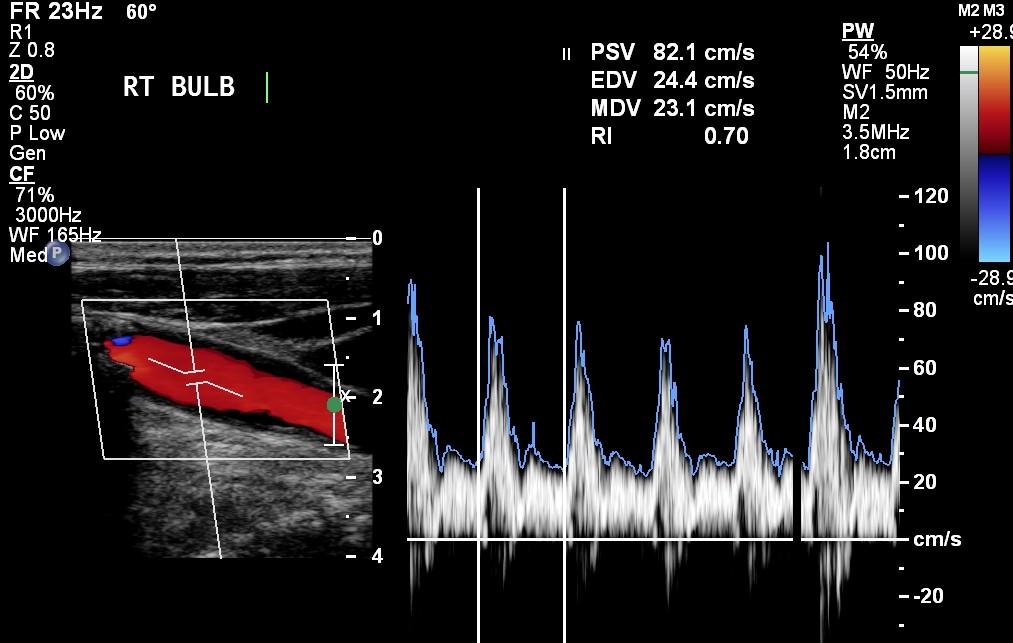
While assessing the vessels with Doppler the ultrasound system also displays an absolute measurement of the velocity of the moving fluid measured in cm/second. Velocities in narrowed tubular structures (blood vessels) are predictably increased based upon the Poiseuille’s law. The most common clinical applications of these physical phenomena are the detection of carotid artery stenosis in the region of the carotid bulb and for the detection of venous thrombosis.
Poiseuille’s Law is: Q = πPr4 / 8nL
| Q | Flow Rate | r | Radius |
| Π | Constant (Phi) | n | Viscosity of the fluid |
| P | Pressure | L | Length of the tubular structure |
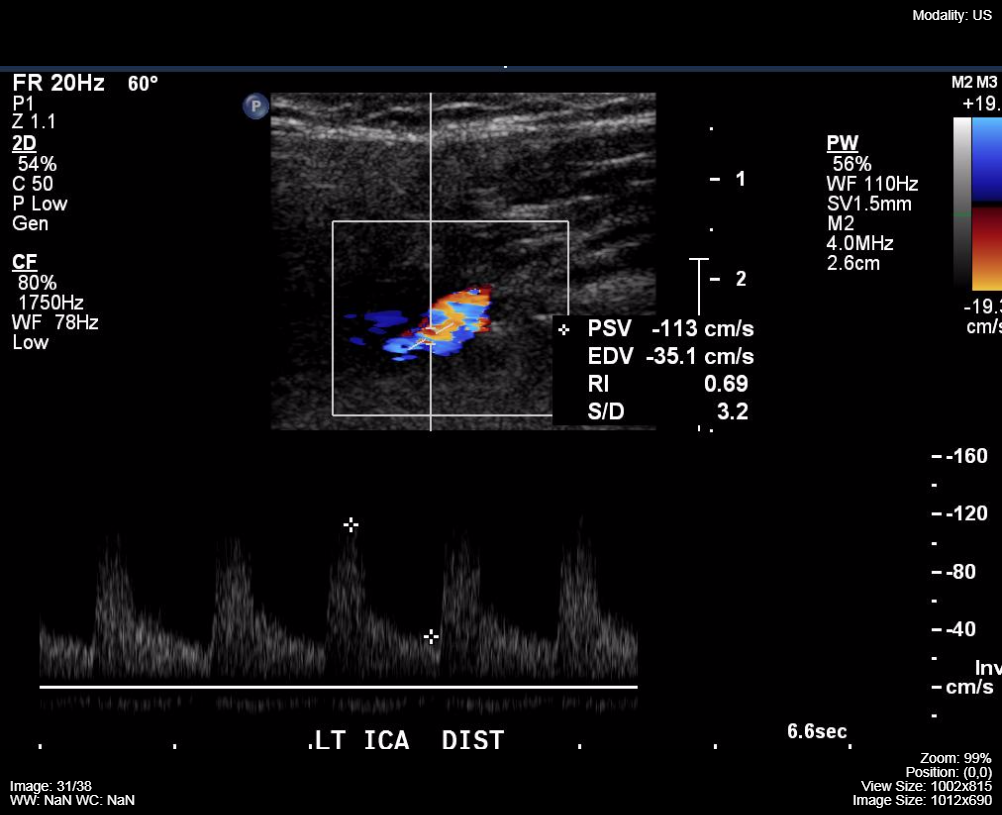
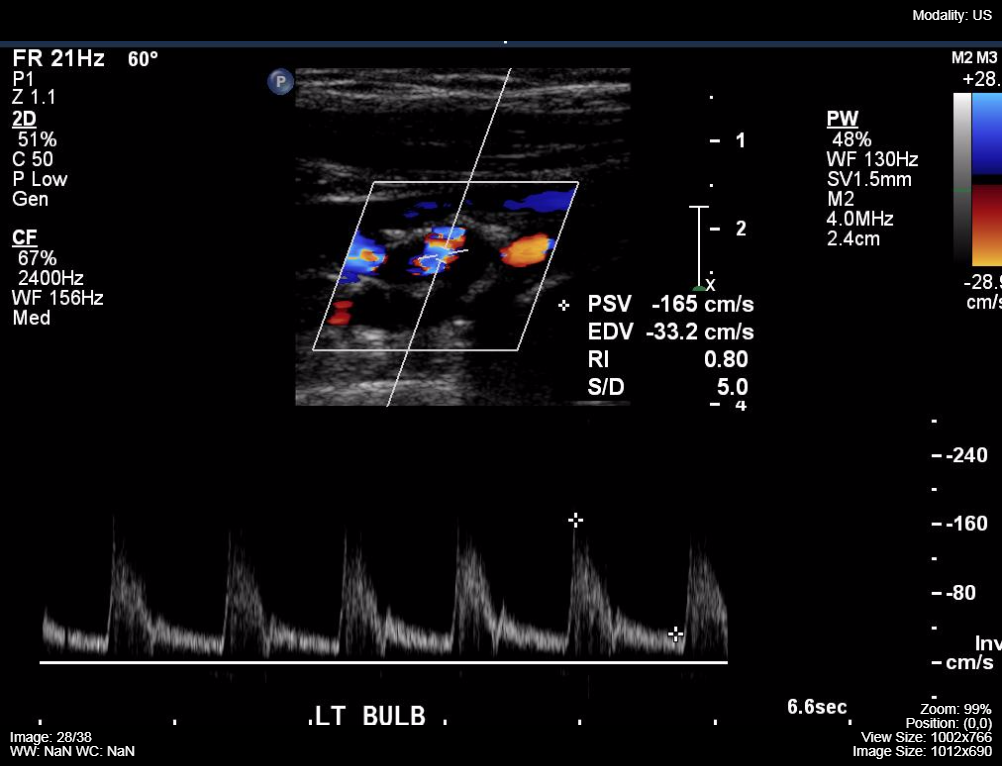
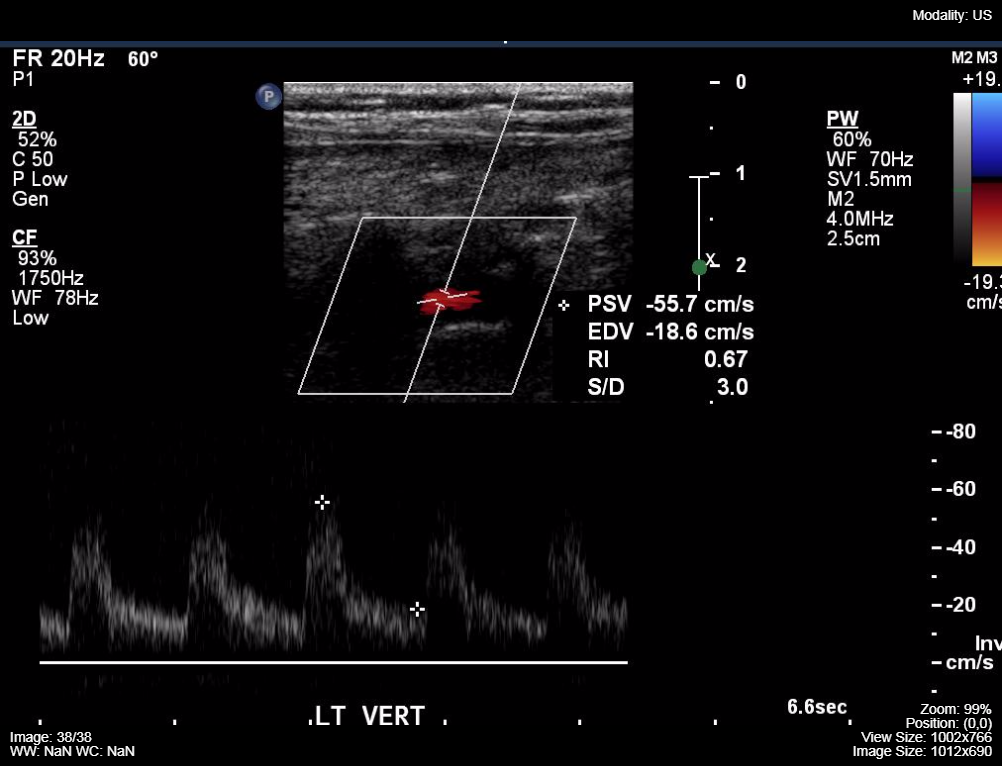
Figure 3.38 demonstrates a carotid Doppler ultrasound with abnormally high velocities associated with an internal carotid artery stenosis.
Internal Carotid
Carotid Bulb
Vertebral
Doppler Ultrasound:
- Blue on Dopper = fluid moving away from probe
- Red on Doppler = fluid moving towards the probe
Blue Away, Red Towards – BART
Ultrasound Probes
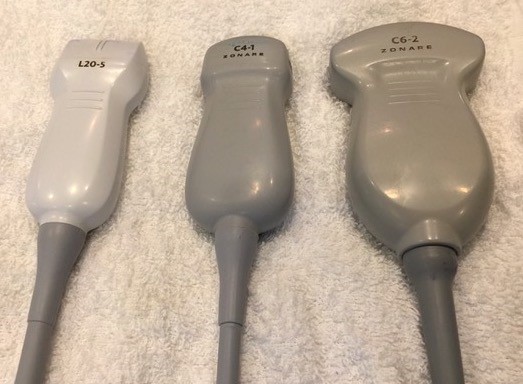
Different anatomic structures can be better visualized if the ultrasound transducer is designed to fit the anatomy of the area i.e. convex (curved) transducers are optimal for abdominal and obstetric imaging, linear probes are best adapted to vascular and small superficial structures (thyroid), while the prostate gland is best visualized with a long, wand-shaped ultrasound transducer that can reach the gland via the rectum (endo-cavitary probe). This same physical configuration of the ultrasound probe can be used for intra-vaginal image acquisition for the assessment of female pelvic anatomy (uterus, endometrium, and ovaries). Figure 3.39 contains three common probes, a linear 20 MHz, a curved array 4 MHz and a larger curved array 6 MHz.
A feature of ultrasound probes that effects image quality is the correlation of the frequency of sound emitted with the depth of tissue interrogated. Higher frequency probes have a limited depth of field but provide better image resolution of the near field anatomy. Lower frequency probes are best for deep tissue imaging. Hence, a thyroid ultrasound may be performed with a 20 MHz probe while deep abdomen ultrasound probes are in the 4 – 5 MHz range. Maximal tissue depth for the low frequency probes is approximately 20 cm and these probes do not provide imaging details of the subcutaneous tissues.
The depth of the tissue being imaged from the skin surface limits the ability of ultrasound to view patient anatomy i.e. it would be very unusual to be able to see all of the structures of the abdomen from front to back due to the depth limitation of ultrasound of approximately 15 – 20 cm. Two physical entities that negatively impact ultrasound image quality are the presence of gas in the area (lung, intestinal gas) and bone.
Ultrasound Probes:
- Higher frequency better image resolutions of near field
- Higher frequency has limited depth
- Lower frequency better deep tissue imaging
Ultrasound Image Quality
- Depth of tissue: deeper depth associated with declining image quality
- Presence of Gas: more gas associated with poorer quality
- Bone: high scattering, causes a shadow on imaging
Attributions
Fig 3.31 B-Mode Ultrasound of the Carotid bulb with atherosclerotic plaque by Dr. Brent Burbridge MD, FRCPC, University Medical Imaging Consultants, College of Medicine, University of Saskatchewan is used under a CC-BY-NC-SA 4.0 license.
Fig 3.32A Ultrasound Machine by Dr. Brent Burbridge MD, FRCPC, University Medical Imaging Consultants, College of Medicine, University of Saskatchewan is used under a CC-BY-NC-SA 4.0 license.
Fig 3.32B Mobile Ultrasound Machine by Dr. Brent Burbridge MD, FRCPC, University Medical Imaging Consultants, College of Medicine, University of Saskatchewan is used under a CC-BY-NC-SA 4.0 license.
Fig 3.33 Ultrasound image of the normal liver and kidney. The echogenicity of the liver is greater than the echogenicity of the adjacent renal cortex by Dr. Brent Burbridge MD, FRCPC, University Medical Imaging Consultants, College of Medicine, University of Saskatchewan is used under a CC-BY-NC-SA 4.0 license.
Fig 3.34 Gallbladder by Dr. Brent Burbridge MD, FRCPC, University Medical Imaging Consultants, College of Medicine, University of Saskatchewan is used under a CC-BY-NC-SA 4.0 license.
Fig 3.35A Normal Liver Ultrasound by Dr. Brent Burbridge MD, FRCPC, University Medical Imaging Consultants, College of Medicine, University of Saskatchewan is used under a CC-BY-NC-SA 4.0 license.
Fig 3.35B Hepatomegaly and hepatic steatosis on Ultrasound by Dr. Brent Burbridge MD, FRCPC, University Medical Imaging Consultants, College of Medicine, University of Saskatchewan is used under a CC-BY-NC-SA 4.0 license.
Fig 3.36 Colour Doppler, of the neck by Dr. Brent Burbridge MD, FRCPC, University Medical Imaging Consultants, College of Medicine, University of Saskatchewan is used under a CC-BY-NC-SA 4.0 license.
Fig 3.37 Colour Doppler of the neck with Spectral Display by Dr. Brent Burbridge MD, FRCPC, University Medical Imaging Consultants, College of Medicine, University of Saskatchewan is used under a CC-BY-NC-SA 4.0 license.
Fig 3.38A Internal Carotid Doppler Ultrasound Dr. Brent Burbridge MD, FRCPC, University Medical Imaging Consultants, College of Medicine, University of Saskatchewan is used under a CC-BY-NC-SA 4.0 license.
Fig 3.38B Carotid Bulb Doppler Ultrasound by Dr. Brent Burbridge MD, FRCPC, University Medical Imaging Consultants, College of Medicine, University of Saskatchewan is used under a CC-BY-NC-SA 4.0 license.
Fig 3.38C Vertebral Doppler Ultrasound by Dr. Brent Burbridge MD, FRCPC, University Medical Imaging Consultants, College of Medicine, University of Saskatchewan is used under a CC-BY-NC-SA 4.0 license.
Fig 3.39 Linear probe and two curved array probes by Dr. Brent Burbridge MD, FRCPC, University Medical Imaging Consultants, College of Medicine, University of Saskatchewan is used under a CC-BY-NC-SA 4.0 license.

