
Chapter 7. Topographic Maps
4 Practice questions on Topographic Maps
Adapted by Joyce M. McBeth, Sean W. Lacey, & Tim C. Prokopiuk (2018) University of Saskatchewan from Deline B, Harris R, & Tefend K. (2015) “Laboratory Manual for Introductory Geology”. First Edition. Chapter 3 “Topographic Maps” by Karen Tefend and Bradley Deline, CC BY-SA 4.0. View Source.
7-E1 PRACTICE QUESTIONS
The questions in section 7-E1 are for practice (they will not be graded). Answers to these questions are provided at the end of the lab.
Please refer to British Columbia Topographic Map 094A018. A thumbnail version of the map is shown in Figure 7-E1. Hint: the information in the map area legend (on the right hand side of the map) will be very helpful in answering these questions.
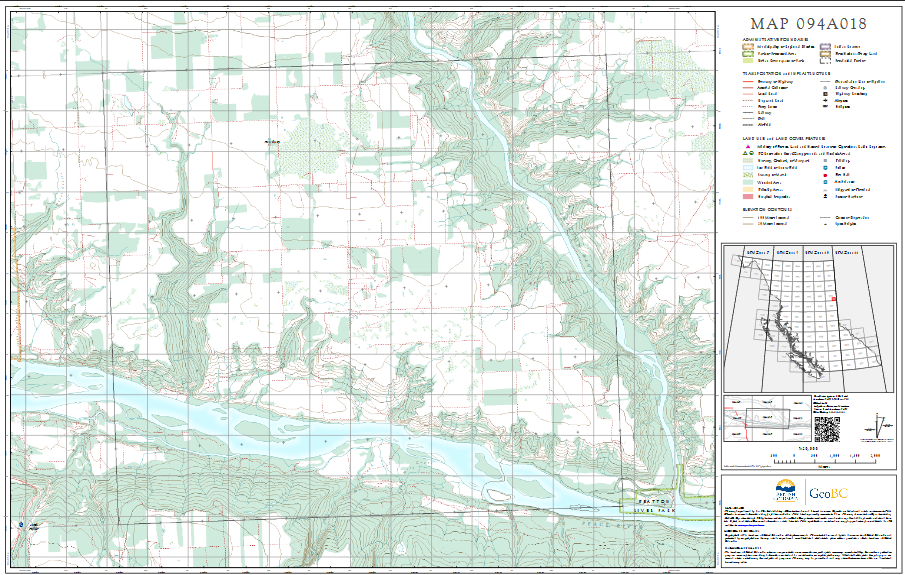
1. Is the map area located in northeast (NE), northwest (NW), southeast (SE), or southwest (SW) B.C.?
2. What do the green areas on the map represent?
3. What are the contour intervals of the two types of contour lines used on this map?
4. Note the location of the two rivers running through the map area. What are their names?
5. What happens to the contour lines as you move out in the first 1000 m from the rivers? (Hint: Does the distance between the contour lines change?) How does this pattern differ when you move further from the rivers (such as the NW corner of the map)? What does this tell you about the topography in this area?
6. A fractional scale of 1:20,000 means that 1 centimetre (cm) = metres.
7. A fractional scale of 1:20,000 means that 1 metre (m) = kilometres (km).
8a. The scale of the map will be different if you print it on a larger piece of paper than if you print it on a smaller piece of paper. What size of paper should you print the map on for the map to be at 1:20,000 scale? Hint: this is specified in the map legend.
8b. Please comment on which scale (graphical scale or fractional ratio scale) you find easier to work with and why.
For Questions 9 through 13, refer to Figure 7-E2 below, which shows a hill, an intermittent stream, and two index contours (darkened contour lines). Assume the contour interval for this map is 5 m, and the index contour that is crossing the stream has an elevation of 70 m. Review overview section 7.3 prior to doing this exercise.
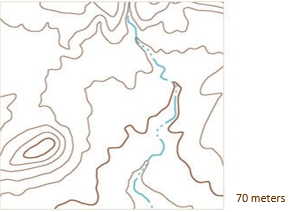
Source: Sean Lacey (2018) CC BY 4.0, after Tefend and Deline (2015), map originally from USGS Public Domain view source
9. Which way is the stream flowing, to the north or to the south?
10. What is the elevation of the highest contour in the map?
11. Calculate the relief of this map. Hint: it may be helpful to review the “Contour Lines” section in this chapter for instructions on calculating relief.
12. Calculate the gradient of the stream between the highest and lowest contour lines that cross the stream. These two contour lines are 2 km apart.
13. Which side of the hill shown in Figure 7-E2 is slightly steeper: the west or east side?
Links to Maps Used in this Lab
- British Columbia Topographic Map 094A018. https://pub.data.gov.bc.ca/datasets/177864/pdf/094A/094A018.pdf
Answers to Practice Lab Exercises in section 7-E1
- NE
- wooded areas
- 100 m, 20 m.
- Beatton River, Peace River.
- Contour lines are closer together near the river because the slope is steep, very far apart in the NW corner (flatter area).
- 200 m
- 20 km
- 28″ x 44″
- south
- 95 m (this is the index contour at the top of the hill)
- 95 m – 65 m = 30 m
- (80 m – 65 m)/2 km = 7.5 m/km
- East
