
3.1 Inflation
Inflation is one reason why a dollar today is worth more than a dollar in the future. The term inflation refers to an increase in the level of prices [1] of goods and services in an economy over time. The inflation rate is a percent increase in the price level, usually measured annually. For example, a 2.5% inflation rate implies that the level of prices has increased by 2.5% over the year. Conversely, deflation is a decrease in the level of prices.
When the price level rises, each unit of currency (e.g. one dollar) buys fewer goods and services. Consequently, inflation reflects a reduction in the purchasing power per unit of money. (Boundless Economics, 2016). Purchasing power is a measure of how much can be purchased with a given amount of money. For example, does $10 buy you 20 liters of gas or only 10? The purchasing power of $10 can change. It can change for a number of reasons, including inflation. It can also be affected by geographical area or even from store to store.
Inflation (or deflation) can be a result of an increase in demand (demand-pull inflation), or a decrease in the supply of goods and services (cost-push inflation).
Let’s look at demand-pull inflation. This happens when people want more of a product than is actually available. Consequently, this pulls the prices up, causing inflation. In general, demand-pull inflation occurs almost naturally in a “good” economy. To explain further, in a good economy with low unemployment, people have good jobs and job opportunities, and their wages increase over time. When employees’ wages increase, they have more money to buy goods and services, so demand goes up. If demand for goods and services increases, then the people who provide them can charge more, resulting in a price level increase over time. At this point, the cycle can feed itself, as price inflation will allow businesses to hire more staff (lowering unemployment) and leads (again) to employees requiring higher wages.[2]

Demand-pull inflation can also be a product of monetary policy of a central bank. For example, if the Bank of Canada decides to print more money, demand for goods and services can rise because people have now more money and, thus, are willing to buy more.
Now let’s look at cost-push inflation. It is caused by a decrease in supply of goods and services, which leads to higher prices of goods and services. Supply decreases can occur due to numerous reasons, e.g. shortage of raw materials, shortage of available labour, crop losses and natural disasters. For example, in 1970s several Middle Eastern oil producing countries (referred to as OPEC) refused to sell oil to Canada, Japan, the Netherlands, the United Kingdom and the United States. As a result, oil prices quadrupled, which made the cost of gas and many other oil products dramatically increase.
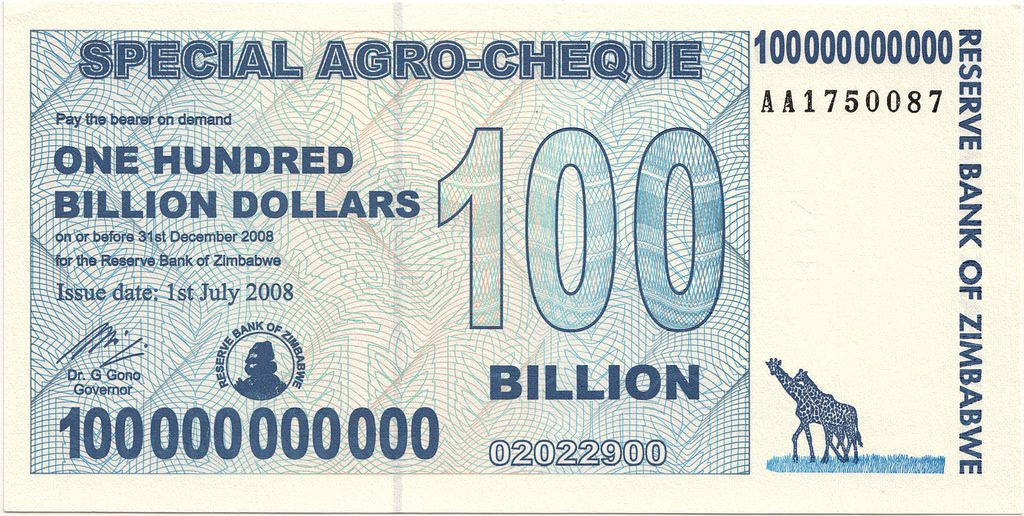
Most economies are undergoing modest inflation at all times. However, occasionally an economy may experience extremely high inflation rates, called hyperinflation. This is considered to be a disastrous phenomenon. It has only occurred a handful of times in history. Two examples are Germany between 1921 and 1928 and Zimbabwe between 2008 and 2009. In both cases, the federal governments were struggling to repay their debts, so the central banks began printing more money in an attempt to pay off their debts. As we saw earlier, printing money can lead to demand-pull inflation.
Shortly after World War I ended, Germany had to pay their war debt. To do so, the German central bank started printing money (at that time German currency was called Marks). As a result, the German mark- U.S. dollar exchange rate rose from 4.2 to 1 in 1914 to around 4.2 trillion marks to 1 dollar by November 1923. At hyperinflation’s peak, prices were rising so fast that waiters had to climb on tables to call out new menu prices in restaurants every half hour. Workers had to bring wheelbarrows with them to work to collect their daily pay.[3]
In November 2008, Zimbabwe had an inflation rate of 79.6 billion percent – equivalent to 98% per day. Every day, prices essentially doubled. Prices were adjusted several times per day. At one point, a loaf of bread cost 550 million Zimbabwean dollars (up from Z$5.10 five years earlier) (Anonymous, 2006), and teachers were paid in trillions of dollars per month. (Taylor, 2014).
To sustain economic stability and avoid such extreme cases, central banks generally try to keep inflation at a low and stable rate. For example, the Bank of Canada target inflation rate is generally 2%[4].
3.1.1 Measuring Inflation
The most common method of measuring inflation is by using the concept of a basket of goods – a relatively fixed set of goods and services. The cost of that basket of goods is estimated and compared from time to time. The combination of goods and services in the basket of goods are selected to represent a typical household’s expenses. Food and housing, for example, constitute a large share in average households’ expenses, thus, changes in food and housing prices affect people’s standard of living, or total costs, more than changes in the price of, say, luxury cars (Statistics Canada, 2015). Based on the basket of goods the Consumer Price Index (CPI) is calculated (Taylor, 2013). The CPI represents the level of prices in the country at a certain period of time and is used to calculate the inflation rate (or deflation rate). [5]
For example, if we want to calculate the inflation rate between 1961 and 2016, we divide the difference in the CPI values between the two years by the CPI value in 1961:
 (3.1)
(3.1)
In this formula, 1961 is called the base year and 2016 is the target year.
Let’s tie this concept back to our Cheerios example. As mentioned at the beginning of the chapter, a box of Cheerios cost 25¢ in 1961, and a comparable box of Cheerios cost around $5.00 in 2016. This represents a price increase of 1900% over the 55-year period. The inflation rate of 718% affected this price increase, but shows that the price of Cheerios rose more than the average price of goods over this period.
3.1.2 Nominal vs. Real Value/Purchasing Power
Say you want to buy your morning coffee, and the coffee costs $2.00. You look in your wallet and find two toonies – one minted in 1996, and one minted in 2015. Does it matter which one you use to pay for your coffee? No. Both coins are worth exactly $2.00. We say the coins have the same nominal value – in this case, the nominal value is $2.00. The nominal value is the numerical value printed on the money, and it never changes.
What does change about the toonie is its real value or purchasing power. A toonie will be less useful to you ten years from now than it is today. If you leave your toonie on your nightstand for ten years, you might find that you can no longer buy your coffee with just the toonie. The toonie is still worth $2.00 (its nominal value hasn’t changed), but its purchasing power has decreased, because it can no longer buy as much as it could ten years ago.
One way to calculate the real value/purchasing power of money is by using a variation of the inflation formula introduced above. For example, to find the purchasing power of $100 from 1961 (base year) in 2016 (target year), we multiply the CPI ratio of the target year to the base year by the dollar amount in the base year:
 (3.2)
(3.2)
As we see, the purchasing power of $100 from 1961 is equivalent to the purchasing power of $817.83 in 2016. So, if you spent $100 in 1961 you would be able to buy a lot more than if you spent $100 in 2016. In fact, you would be able to buy an equivalent of $817.83 in 2016 dollars.
For example, in 1960 you could have bought a sofa with $189.95 from Sears. In 2017, a similar sofa sells for $1400-$1700 at Sears (almost 10 times as much!). As we can see, inflation led to a significant increase in prices over the years.
Thus, since the real value of money changes over time due to inflation, we say that a dollar today is worth more than a dollar tomorrow. This illustrates the concept of the “time value of money”.
It is important to note that inflation affects money management and investing decisions. If the prices of your daily needs – such as food and transportation – increase, you will need a higher income to maintain the same standard of living. Keeping money “under the mattress” does not protect its purchasing power, as inflation will gradually decrease the amount of goods and services you can buy with that money. In contrast, if money was put into an account with a 2% interest rate (that is, the initial deposit will increase by 2% per year), and the inflation rate was also 2%, the account’s purchasing power would remain the same after one year. The balance in the account would have increased to maintain the purchasing power. So, as we see, applying interest can help mitigate the effects of inflation, making interest an important component of the TVM concept.
[1] When discussing inflation and deflation, we use the term “level of prices,” which represents the general prices of goods and services. To assess inflation, we need to measure a change in the level of prices, not just price fluctuations of individual goods, because these prices can fluctuate due to a company’s policy, marketing strategy and other short-term effects. Hence, these fluctuations do not necessarily represent inflation. Inflation (or deflation) is intended to represent the longer term trends in prices.
[2] (From Khan Academy. Not sure about their TOU.)
[3] http://www.economist.com/blogs/freeexchange/2013/11/economic-history-1
[4] http://www.bankofcanada.ca/rates/indicators/key-variables/inflation-control-target/
[5] For more information about inflation and CPI in Canada, visit inflationcalculator.ca or statcan.gc.ca.
