
2.1 Financial Statements
Suppose you decide to start a company to manufacture iron rods for building construction. How do you know if your company is doing well? What are the key business objectives that you have to keep in mind? If you are looking for investors to expand your business, what information do you have to present to them? What data do investors and management use to gauge the company’s performance? The answers to these questions lie in the financial statements of the company.
Financial statements are official records of the financial standing and activities of a business. These statements contain the data necessary to evaluate financial strength of the company. The two primary objectives of every business are profitability and solvency. Profitability is the ability to generate income. Solvency is the ability to pay debts as they become due. Unless a business can generate satisfactory income to pay its debts, the business cannot survive.
There are three basic financial statements. Together they present the profitability and strength of a company:
- An income statement, sometimes referred to as a statement of profit and loss, reflects a company’s profitability.
- A balance sheet, sometimes referred to as a statement of financial position, reflects a company’s solvency.
- A statement of cash flows shows the cash inflows and outflows for a company over a period of time (e.g. a month, a quarter or a year).
The details reported in the financial statement are related to the goal of the statement. That is, the statement contains only the information needed for the goal of that specific statement, e.g. the income statement only includes data that indicates the profitability of the company for a certain period of time. Although the specific headings and elements included on each statement depend on the company’s type of business, they are often very similar and follow accounting standards. Standardized formats were established to ensure company reported accurately honestly and transparently. This also enables comparison of the financials between companies. For example, without standardized formats it could be difficult to compare the financial data of a company in the service industry to the one in manufacturing. The structures of the companies, as well as how they generate income are very different. The standardized nature of financial statements, however, allows anyone to see the key information about the companies’ performance in a similar way, despite the differences. This allows the management team and potential investors to navigate the statements and obtain relevant financial information about the company without having to delve into the intricacies of a company’s business.
Financial statements contain a lot of specific terminology. We will be explaining some of the most common terms used on the statements as we go.
An essential part of financial statements are the notes that accompany them. These notes are generally located at the end of a set of financial statements. They provide further explanation about various items shown in the statements, or other relevant non-quantitative information. For example, a note may indicate the expected lives of long-lived equipment, or loan repayment terms (Annand, 2016).
Note that in this section the goal is to introduce financial statements and the information they contain. The next section will cover how the information from statements can be used to analyze company’s performance.
Financial statements typically report the last two or more periods (e.g. months, quarters, years etc.) of activity to enable easy comparison. We briefly introduce the three basic financial statements in the following subsections. To get a better understanding of each of the statements, we use the 2015 consolidated financial statements of Canadian Tire Corporation, Limited.
2.1.1 The Income Statement
The income statement, also called a statement of profit and loss, reports the profitability of a business organization for a given period of time. The period must be indicated on the statement, e.g. start and end date.
In accounting, profitability is measured by comparing the revenues earned with the expenses incurred:
- Revenue is the money earned or resulting from the sale of products or from providing services to customers. This may also be called sales.
Note that sometimes companies can earn money from sources that are not related to the normal business operations. For example, a manufacturer can earn interest on loans, or rental income if a business has extra space they rent. In these situations, it common for the financial statements to indicate this revenue as separate entry (line item) in the statement so that investors or managers can properly consider these revenue sources in their analysis.
- Expenses are the costs incurred by the business. These include the cost of goods and services, as well as other costs incurred in day-to-day business activities.
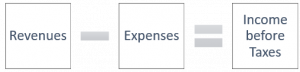
All revenues and expenses are recorded on the income statement to determine profitability of the company. If the revenues are larger than the expenses, then the company is considered to be profitable. The income that is left after all the expenses are accounted for is termed income before tax, as shown in Figure 2.1. We will discuss income before taxes in more detail later in this section.
For now, let’s take a look at a simplified income statement to see how revenues and expenses are recorded and how income before taxes is calculated. This will give you a basic understanding of how income statements are constructed, and what information is documented.
Example 2.1 Income Statement for Louri Delivery Inc.
| Louri Delivery Inc. – Income Statement – For the Month Ended August 31, 2016 | |
| Revenues | |
| Service Revenue | $14,000 |
| Expenses | |
| Salaries Expense | $4,800 |
| Rent Expense | $960 |
| Gas and Oil Expense | $1,080 |
| Income before Taxes | $7,160 |
Example 2.1 shows the income statement of Louri Delivery Inc. The heading shows the name of the entity, the type of financial statement, and the time period the statement covers. The statement lists all revenues and expenses for the period, with the last row stating the income before taxes.
The income statement for the month ended August 31, 2016, shows that the revenues generated by serving customers (or service revenue) for August totaled $14,000. Expenses for the month include salaries, rent, and gas and oil. To determine the company’s income before taxes, the expenses are subtracted from the revenues. Thus, we get:
Revenues = $14,000
Total Expenses = $4,800 + $960 + $1,080 = $6,840
Income before taxes = $14000 – $6,840 = $7,160
So, as a result of business activities in August, 2016, the company’s income before taxes was $7,160. Based on this Louri Delivery Inc. is considered profitable in this period.
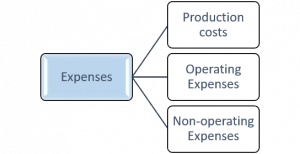
Income before taxes is one of the so-called profit indicators that is noted on income statements. There are other profit indicators that are also commonly recorded (gross profit, operating profit and net income). They are used to determine profitability of the company from different operating perspectives and are commonly associated with the following categories of expenses: production costs, operating expenses and non-operating expenses, as shown in Figure 1.1 below. Combined, these categories account for all of the company’s expenses.
Production costs are associated with the production of the goods and services sold by the company. In other words, these costs include all the expenses incurred to create the final product or service that goes to the customer. The production costs in a retail business (e.g. car dealership) are called the cost of producing revenue. These costs include the amount they pay for the items they sell. The production costs of a manufacturer (e.g. automotive factory) are termed the cost of goods sold (COGS). These costs include the material and labour used to produce the goods. For example, the COGS for a tire manufacturer are the materials (rubber, fabric, wire and other components) and labour costs (wages to workers) used to produce a tire. The cost of transporting the tires to stores and the cost of labour used to sell tires would be excluded as they are not directly attributed to the production of tires.
Operating expenses constitute expenditures not directly attributed to production. Just producing goods and services is usually not enough to have a successful business. One must also sell the goods, advertise them, communicate with customers, pay office rent and utilities etc. These costs are not associated directly with production, but are nonetheless important to keep the business operating. For example, the operating expanses for a company might include accounting expenses, insurance premiums, office supplies, utilities, advertising, etc.
Non-operating expenses are incurred outside of a company’s core operations. In other words, these are the expenses that are not directly attributed to production or operation of a business. Examples of non-operating expenses are interest paid on a company’s loans and money lost due to currency exchange rate fluctuations.
Let’s examine some of these expenses using an example of revenues and expenditures of the company Ian’s Mats Inc. for July, 2017.
Example 2.2 Income Statement for Ian’s Mats Inc.
Ian has a small business that manufactures rubber mats, Ian’s Mats Inc. The company sells these mats for $68 each. Ian’s Mats Inc. produced 100 rubber mats in July, 2017, earning the total sales revenues of $6800. To produce one mat, the company needs to spend $45 on raw materials and labour costs. Ian’s Mats Inc. also advertises their mats, spending $300 this month. When Ian was starting this business, he got a loan to purchase the necessary equipment, and now pays $35 in interest every month. What would the income statement look like for the month ended July 31, 2017?
In this example, the company incurs production expenses, operating expenses and non-operating expenses. Productions expenses in this example are the cost of goods sold (COGS). Here, COGS = $45 per mat * 100 mats = $4500. The advertising expenses in the example are categorized as operating expenses. The interest expense is categorized as a non-operating expense. Obtaining and paying interest on the loan is not a primary revenue-generating activity of the company, nor is it an expense incurred to keep the business running (paying interest doesn’t directly affect company’s performance like advertising does). So, the information that is recorded in the income statement is:
Revenues:
Sales revenues = $6800
Expenses:
COGS = $4500
Operating expense = $300
Non-operating expense = $35
Total expenses = $4500 + $300 + $35 = $4835
So, Income before taxes = $6800-$4835=$1965.
Thus, the income statement in this scenario is:
| Ian’s Mats Inc. | |
| Income Statement | |
| For the Month Ended July 31, 2017 | |
| Revenues | |
| Sales Revenue | $6,800 |
| Expenses | |
| COGS | $4,500 |
| Operating expense | $300 |
| Non-operating expense | $4,800 |
| Total Expenses | $4,835 |
| Income before taxes | $1,965 |
As we see, once revenues are recorded on the income statement, the expenses are detailed starting with production costs (cost of goods sold or cost of producing revenue) and ending with non-operating expenses. This order is commonly used on the income statements to allow for easier calculation of the profit indicators mentioned above. We will go into them in more detail, but as a quick overview:
- Gross Profit = Revenues – Production Cost
- Operating Income = Revenues – Production Cost – Operating Cost
- Income before Taxes = Revenues – Production Cost – Operating Cost – Non-operating Cost
- Net Income = Revenues – Production Cost – Operating cost – Non-operating cost – Income taxes
The gross profit (or gross margin) is the first profit indicator listed on an income statement. It reflects the profits remaining after the production costs are deducted from the revenue.
Gross profit = Revenues – Production Cost (2.1)
The gross profit indicates the profitability of a company’s production. For example, if the company’s gross profit is negative, that means production expenses exceed revenues from selling company’s products. That is, it costs them more to make each item than the selling price, so they are actually losing on every item they produce. This tells the management team to either increase their selling price, or decrease their production costs. This may require substantial changes, e.g. upgrading equipment to increase production efficiency. Other times, the solution may be a small one, like an olive….
An olive?? YES – In the 1980s , Robert Crandall, then head of an airline, cleverly calculated that if you removed just one olive from every salad served to passengers, nobody would notice … and the airline would save $100,000 a year! That’s one powerful olive! United Airlines, as another example, recently got rid of those “refresher” towels on most short journeys, cut back on in-flight videos and removed grapefruit juice from its bar menus — it’s less popular than orange juice — as part of an overall $200 million cost cutting program.
Let’s go back to example 2.2. What is the gross profit for Ian’s Mats Inc. for the month shown? Using equation 2.1 we get:
Gross profit = Revenues – Production expenses = $6800-$4500=$2300.
Operating profit is the second profit indicator on an income statement. It reflects the profit remaining after the production cost and operating expenses are deducted from the revenues.
Operating profit = Revenues – Production Cost – Operating Expenses
or
Operating profit = Gross Profit – Operating Expenses (2.2)
Operating profit indicates if the company is making enough money to cover its production and operating expenses. If a company’s gross profit is greater than zero, but their operating profit is negative, this means the company isn’t able to cover both its production and operating expenses. Somebody isn’t going to get paid! So, the company has to increase price, or reduce the costs of production and/or day-to-day business activities. For example, one company in Boston started buying pens and paper in bulk, and asked employees to drink filtered, not bottled, water. Total savings? About $100,000 per year. At a plant in Texas, it’s the doormats in the entryways — now they just get vacuumed instead of sent out for cleaning — and that saves the company $70,000 a year. Another example – Canon. They saved over $50,000 using recycled furniture when it expanded an office.
Going back to example 2.2, what is the operating profit for Ian’s Mats Inc. for the month? Here, advertising expenses are the operating expenses. Using formula 2.2, we get:
Operating profit = Gross profit – Operating expenses= $2300-$300=$2000.
Income before taxes, which we mentioned above, is the third profit indicator on an income statement. It reflects the profit remaining after the production cost, operating expenses and non-operating expenses are deducted from the revenues. Income before taxes is also commonly referred to as earnings before income tax.
Income before taxes = Revenues – Production Cost – Operating Expenses – Non-operating expenses
or
Income before taxes = Operating profit – Non-operating expenses (2.3)
Income before taxes is essentially the company’s profits and the amount that is used to calculate the amount of tax they need to pay. (We will cover income tax in more detail in Section 2.4, but we will briefly note here that tax rates differ between business types and are set by governments.) Income before taxes signals company’s profitability when all expenses are accounted for, including the non-operating ones, such as interest they pay on loans. Generally, income before taxes is not significantly different from the operating profit. However, if there is a substantial difference between the two, especially if the operating profit is positive but the income before taxes is negative, their non-operating expenses are high. For example, if the non-operating expenses are high due to a lot of interest paid on their loans, the management of the company might decide to renegotiate some of the loan arrangements or look for alternative financing options.
As shown above in example 2.2, the income before taxes is $1965. Using formula 2.3 we can calculate income before taxes directly from operating profit:
Income before taxes = Operating profit – Non-operating expenses = $2000 – $35 = $1965
Net Income, is the fourth and main profit indicator on the income statement. It is the income left over after they have paid all of their expenses and taxes. So, it shows whether the company is profitable or not after taxes are paid. If their revenues are higher than their expenses and taxes, they have what we call net profit. Otherwise, the business has a net loss, and it’s losing money. Thus,
Net income = Income before taxes – Income Taxes (2.4)
Net income is often referred to as a company’s “bottom line”. It is a one of the most followed and talked about numbers when discussing company’s performance. It is the money companies can use to finance their operations or expansions, invest in research and development etc., or they can distribute it to the owners.
In example 2.2, suppose Ian’s Mats Inc. has to pay $500 in tax for this month. All the other amounts remain the same as in the original example. What is the net income?
Now that we know the income tax, we can subtract the tax amount from the Income before tax to obtain the net income:
Net income = Income before tax – Income tax=$2000 – $500 = $1500.
Now let’s look at a real-world example: Canadian Tire’s 2015 fiscal year.
The table below came from Canadian Tire’s website.
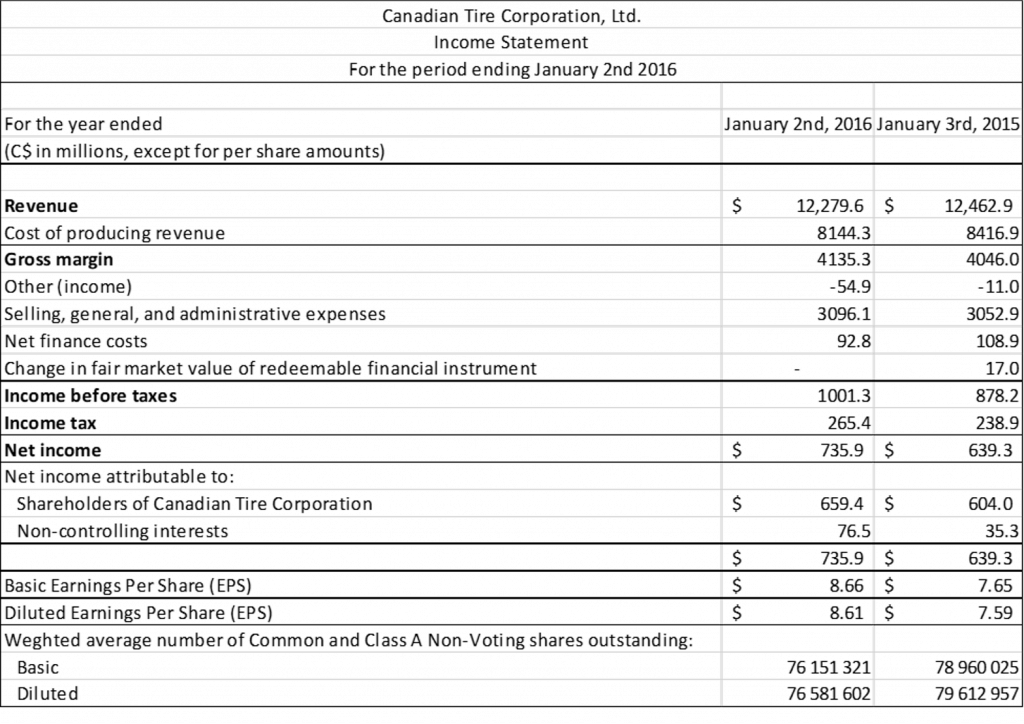
As you’ve noticed, this income statement contains terms that may not be clear and are not standard (e.g. “change in fair market value of redeemable financial instrument”). This often arises on financial statements and is one case in which reading the explanatory notes that accompany the statements is helpful. We will skip the entries below the “net income” for now.
Examining the Income Statement
Let’s analyze this statement based on what we’ve learned. Note that all values are in millions as indicated on the statement.
The income statement shows data for two fiscal years. We will focus on the 2015 fiscal year (column that says “January 2nd, 2015”), which shows:
Total revenue for the year was $12,279.6.
Total expenses = $8144.3 + (- $54.9) + $3096.1 + $92.8 = $11278.3
Income tax = $265.4.
So, we can calculate net income:
- Net income = $12279.6 – $11278.3 – $265.4 = $735.9.
To calculate the other profit indicators on the statement (gross profit, operating profit and Income before taxes), we need to subtract respective expense categories from the revenues.
Using formula 2.1, we get the gross profit for 2015:
- Gross Profit = Revenues – Cost of Producing Revenue = $12279.6 – $8144.3 = $4135.3
To calculate Canadian Tire’s operating profit using formula 2.2, we need to identify the operating expenses. From their explanatory notes, we know that “selling, general, and administrative expenses” refers to a group of expenses, which includes the cost of marketing products and services, administrative costs, and other general expenses associated with operating a business. So, we categorize “selling, general, and administrative expenses” as operating expenses, which gives us:
- Operating Profit = Gross Profit – Operating Expenses = $4135.3 – $3096.1 = $1039.2
To get Income before taxes we use formula 2.3. Here we see that Canadian Tire has listed “other income.” This is money they made from sources other than their store sales. The amount listed as “other income” is not included in the “revenues” amount used to calculate the gross, or operating profit. We only add it when calculating the income before taxes. Since it does not result from the company’s core operations, including it in the gross (or operating) profit would exaggerate the profitability of the production or operations of the company.
Here, we see that “other” line shows income in brackets, because the company made money. If the company had lost money, it may have shown “other (expenses)”. Note that since it was income in the expense category, the sign is negative in the income statement. This may be confusing, but this is just part of the reporting conventions.
On the next line, we see “net finance costs”, which are the costs associated with getting money to finance their operations. Since these costs are not incurred from core operations of Canadian Tire, we categorize them as non-operating expenses. Similarly, the “change in fair market value of redeemable financial instrument” expense is a non-operating expense. So now we can calculate the income before tax as follows:
- Income before Tax = Operating profit – Non-operating expense = Operating profit – [- Other (income)] – Net finance costs – Change in fair market value of redeemable financial instrument = $1039.2 + $54.9 – $92.8 = $1001.3
So, what does all of this tell us? All profit indicators are positive. This means that Canadian Tire is profitable and operates efficiently on all levels. The bottom line is that they had over a billion dollars in pre-tax income and $735.9 million in net profit.
2.1.2 The Balance Sheet
A balance sheet demonstrates a financial position of a company at a specific point in time, e.g. “Balance sheet as of December 31, 2017.” This is done by listing a company’s assets, liabilities, and stockholders’ (owners) equity:
- Assets are things of value owned by a business. Assets are usually expected to provide future benefit. They have value because a business can use or exchange them to produce goods and services, or sell them for profit. Examples include cash, machines, buildings, and accounts receivable (amounts due from customers for goods and services previously sold).
- Liabilities are the debts owed by a business. Businesses typically incur liabilities by borrowing money (getting a loan) and using credit when purchasing goods and services from suppliers. Most loans have repayment terms and deadlines. Examples of liabilities are loans payable (portion of the loan that is yet to be repaid by the company as of the date of a company’s balance sheet), and accounts payable (amounts owed to suppliers for previous purchases).
- Equity is the value of the business or corporation. It includes retained earnings of the company (accumulated net income retained for company’s operation) and the amount of money contributed by the owners (stockholders). The latter is usually recorded as the “capital stock” or “share capital” on a balance sheet, and the money is accumulated by selling stock (or shares), which are units of ownership in a company in the form of certificates. That is, when purchasing company’s shares, an individual (shareholder or stockholder) obtains a right of ownership of a part of the company, and, thus, has the right to claim part of the earnings of the company. The earnings distributed to shareholders are called dividends.
These three items are part of the fundamental accounting equation:
Equity = Assets – Liabilities (2.5)
This equation illustrates the principle of the company’s ownership, where equity is equal to what the company owns minus what the company owes.
For example, assume that a company purchased a new vehicle for $15,000 by using $10,000 from company’s earnings and borrowing $5,000 from a bank. The price of the asset is $15,000. $5,000 is a liability because it is the amount of money you must repay to the bank. Using the accounting equation, we see that:
If the company repays $2,000 over the next year, and the car stays the same value, what would change in the accounting equation? The asset is still worth $15,000 but the liability has decreased by $2,000. What is the company’s equity in the car now?
A balance sheet records assets on one side and liabilities and stockholder’s equity on the other. Rearranging the accounting equation, we see that:
Assets = Liabilities + Equity (2.6)
So, the total assets on a balance sheet must equal the total liabilities and equity. This is also why this statement is called the balance sheet, because the totals of the two sides of the statement must be equal.
Let’s take a look at a simplified balance sheet for Velimir Transportation, Inc. as of December 31, 2017.
Example 2.3 Balance Sheet for Velimir Transportation, Inc
| Velimir Transportation, Inc. | |||
| Balance Sheet | |||
| As of December 31, 2017 | |||
| Assets | Liabilities and Stockholder’s Equity | ||
| Cash | $18,600 | Liabilities: | |
| Accounts receivables | $650 | Accounts payable | $1020 |
| Trucks | $40,000 | Loans payable | $18,500 |
| Office equipment | $3,800 | Total liabilities | $19,520 |
| Stockholder’s equity: | |||
| Capital Stock | $35,000 | ||
| Retained Earnings | $8,530 | ||
| Total stockholder’s equity | $43,530 | ||
| Total assets | $63,050 | Total liabilities and stockholder’s equity | $63,050 |
Notice how the heading of the balance sheet differs from the headings on the income statement (Balance sheet as of December 31, 2017 vs Income Statement for the Period Ending December 31, 2017). A balance sheet is like a photograph; it captures the financial position of a company at a particular point in time. The income statement (and also cash flow statement) represents the data over a period of time.
As evident from the statement, the assets of Velimir Transportantion, Inc., amount to $63,050. The company’s assets consist of cash, accounts receivable, trucks, and office equipment. Liabilities are the debts owed by a business. Velimir Transportation’s liabilities consist of accounts payable and loans payable, totaling $19,520. The company’s stockholders’ equity consists of (1) $35,000 paid for shares of capital stock and (2) retained earnings of $8,530. Capital stock shows the amount of the owners’ investment in the corporation. The total assets (right hand side of the statement) is equal to the total liabilities and stockholder’s equity (left hand side of thee balance sheet).
Real-world Example: Canadian Tire’s for the 2015 fiscal year.
Let’s take a look at Canadian Tire’s Balance sheet as of January 2, 2016.
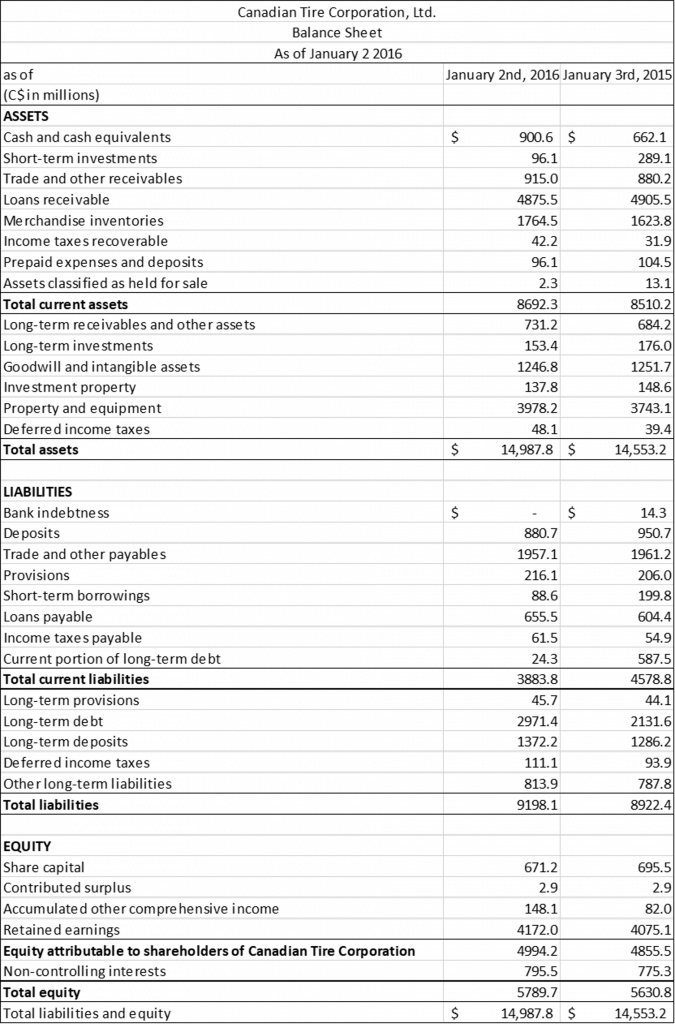
Similarly to Canadian Tire’s Income statement, this balance sheet contains a lot of terms that are specific to accounting. To get a better understanding of separate entries on the statement, please refer to the notes that accompany the statements. These can be found on Canadian Tire’s webpage. Here, we will briefly go over the structure of the balance sheet without going into much detail as to what individual entries represent.
We will focus on the end of 2015 fiscal year (column that says “January 2nd, 2016”). The balance sheet begins by listing the company’s assets. Canadian Tire’s assets totaled $14,987.8 million. Assets are listed as current or long-term (sometimes referred to as non-current), as shown in Figure 2.3 below.
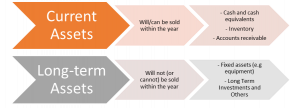
Current assets are expected to be used within a year’s time or be readily converted to cash within a year. In other words, they can be liquidated within one year. Liquidity is a measure of how easily an asset can be converted to cash (we will discuss more about liquidity in section 2.2.3). Cash, short-term accounts receivable and investments are examples of current assets and are included on Canadian Tire’s balance sheet. Current assets amount to $8,692.3 million. Long-term assets are expected to be useful for longer than a year and are not readily convertible to cash, such as property and equipment, long-term accounts receivable and investments. This distinction between current and long-term assets provides the management of the company the information on how much of the company’s assets could be converted into cash if the need arose. Here, the company owns $8,692.3 million worth of current assets that can be converted into cash during one year.
Liabilities are listed next. Canadian Tire’s total liabilities are $9,198.1 million as of January 2, 2016. Like assets, they are listed as either current or long-term, as shown in Figure 2.4.
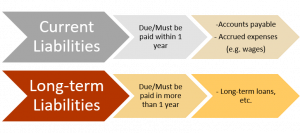
Current liabilities need to be repaid within one year. For example, a bank loan may need to be repaid in 6 months and accounts payable may need to be paid within one month. Canadian Tire’s current liabilities are $3,883.8 million as of January 2, 2016. Long-term liabilities need to be repaid over a longer period of time. Examples include long-term loans on property and equipment. Interest payments, or other periodic payments, on a long-term liability are considered a portion of current liabilities. The distinction between current and long-term liabilities gives the management of the company the information how much money is needed for the company to repay the liabilities that are due within one year. If the company is able to meet its financial obligations as they become due, the company is considered solvent. In this example, the company needs $3,883.8 million within one year to repay all the current liabilities and remain solvent. As we know, total current assets amounted to $8,692.3 million, which is enough to repay all the current liabilities of the company, so Canadian Tire is, indeed, solvent. Similarly, when comparing total assets to total liabilities, we see that total assets, $14,987.8 million, are larger than total liabilities, $9,198.1 million, which implies that the company is able to meet its financial obligations and is solvent.
Equity is the final section of the balance sheet and includes capital contributed by shareholders and the retained earnings of the company. Equity can be controlling, or attributable to the shareholders of the corporation, or non-controlling. Non-controlling interest have a financial stake in the company but are not involved in decision making duties. Canadian Tires’ equity is equal to $5,789.7 million.
So, as evident from the balance sheet, Canadian Tire has a good financial position and is a solvent company.
2.1.3 The Statement of Cash Flows
Management is interested in the cash inflows to the company and the cash outflows from the company because these determine the company’s cash it has available to pay its bills when due. Broadly defined, cash includes both cash and cash equivalents, such as short-term investments.
The statement of cash flows shows the cash inflows and cash outflows from operating, investing, and financing activities.
- Operating activities generally include the cash effects of transactions and the main operational functions that are used to determine net income.
Cash inflows from operating activities affect items that appear on the income statement and include cash receipts from sales of goods or services, interest received from making loans, and other cash receipts that do not arise from transactions defined as investing or financing activities, such as amounts received to settle lawsuits, proceeds of certain insurance settlements, and cash refunds from suppliers.
Cash outflows include payments to acquire inventory (materials, work-in-progress products and finished goods that are part of a company’s assets to be sold for profit), to other suppliers and employees for other goods or services, to lenders and other creditors for interest and all other cash payments that do not arise from transactions defined as investing or financing activities, such as taxes and payments to settle lawsuits, cash contributions to charities, and cash refunds to customers.
- Investing activities generally include business transactions involving the acquisition or disposal of long-term assets such as land, buildings, and equipment.
Cash inflows from investing activities include cash received from: the sale of property, plant, and equipment, and the collection of long-term loans made to others.
Cash outflows for investing activities include cash paid to purchase property, plant, and equipment, and to make long-term loans to others.
- Financing activities generally include the cash effects of transactions and other events involving creditors and owners (stockholders).
Cash inflows from financing activities include cash received from issuing stock (a type of financial instrument that signifies ownership in a company and gives the right to the stockholder to claim part of the company’s earnings), mortgages, and from other short- or long-term borrowing.
Cash outflows for financing activities include payments of cash dividends or other distributions to owners (including cash paid to purchase stock) and repayments of amounts borrowed. Payment of interest is not included because interest expense appears on the income statement and is, therefore, included in operating activities.
The cash flow statement reflects a history of cash flows of a company for a given period. It documents the inflows (revenues) and outflows (expenses) of a company’s activities. The bottom line of the statement provides a company’s cash position at the end of the period. This is achieved by adding all the inflows and subtracting all the outflows on the statement.
Management refers to this statement to analyze the inflows and outflows from different company’s activities. This statement is also important to consider when studying major policy decisions in the company. When policies are aimed at specific activities (e.g. financing activities), their effect is seen in the form of cash flows from these activities. For example, if the company has optimized its production by using new equipment, the statement may show a significant cash flow from operating activities. If it is large enough, it may be enough to finance all projected capital needs internally rather than having to incur long-term debts. Alternatively, if the company has been experiencing cash shortages, management can use the statement to determine why such shortages are occurring.
Normally, a firm prepares a statement of cash flows for the same time period as the income statement. Let’s take a look at a simplified statement of cash flows to see how cash flows from company’s activities are recorded. This will give you a basic understanding of how statements of cash flows are constructed.
Example 2.4 Statement of Cash Flows for Pere Courier Inc.
| Pere Courier, Inc. – Statement of Cash Flows – For the Month Ended September 31, 2016 | |
| Cash Flows from Operating Activities: | |
| Net Income | $3,600 |
| Net cash provided by operating activities | $3,600 |
| Cash Flows from Investing Activities: | |
| Purchase of Trucks | -$30,000 |
| Purchase of Office Equipment | -$1,500 |
| Net Cash Used by Investing Activities | -$31,500 |
| Cash Flow from Financing Activities: | |
| Proceeds from Sales of Capital Stock | $40,000 |
| Net cash provided by financing activities | $40,000 |
| Net Increase in Cash | $12,100 |
Example 2.4 shows a statement of cash flows of Pere Courier, Inc. Similarly to an income statement, the heading of the statement of cash flows shows the name of the entity, the type of financial statement, and the time period the statement covers. The statement lists all cash inflows and outflows for the period, with the last row stating the net increase (decrease) in cash.
As evident from the statement, the company has received $2100 in income in September. Net income is regarded as a cash inflow from operating activities. “Purchase of trucks” and “Purchase of office equipment” are cash outflows resulting from investing activities, thus these are recorded as negative values on the statement under cash flows from investing activities. Net cash used by investing activities totaled -$31,500 for September. “Proceeds from sales of capital stock” are categorized as cash inflows from financing activities. Net cash provided by financing activities totaled $40,000. Adding the “net cash provided by operating activities”, “net cash used by investing activities” and “net cash provided by financing activities”, we get the total change in net cash for the period. In this scenario, we get a net increase in cash:
Net increase in cash = $3,600 – $31,500 + $40,000 = $12,100
Notice, that in this example Pere Courier had to sell stock to finance investing activities of the company. Without proceeds from sales of the capital stock, the company would have a net decrease in cash in September.
Real-world example: Cash flow Statement for Canadian Tire’s 2015 fiscal year.
Let’s take a look at Canadian Tire’s cash flow statement for the 2015 fiscal year:
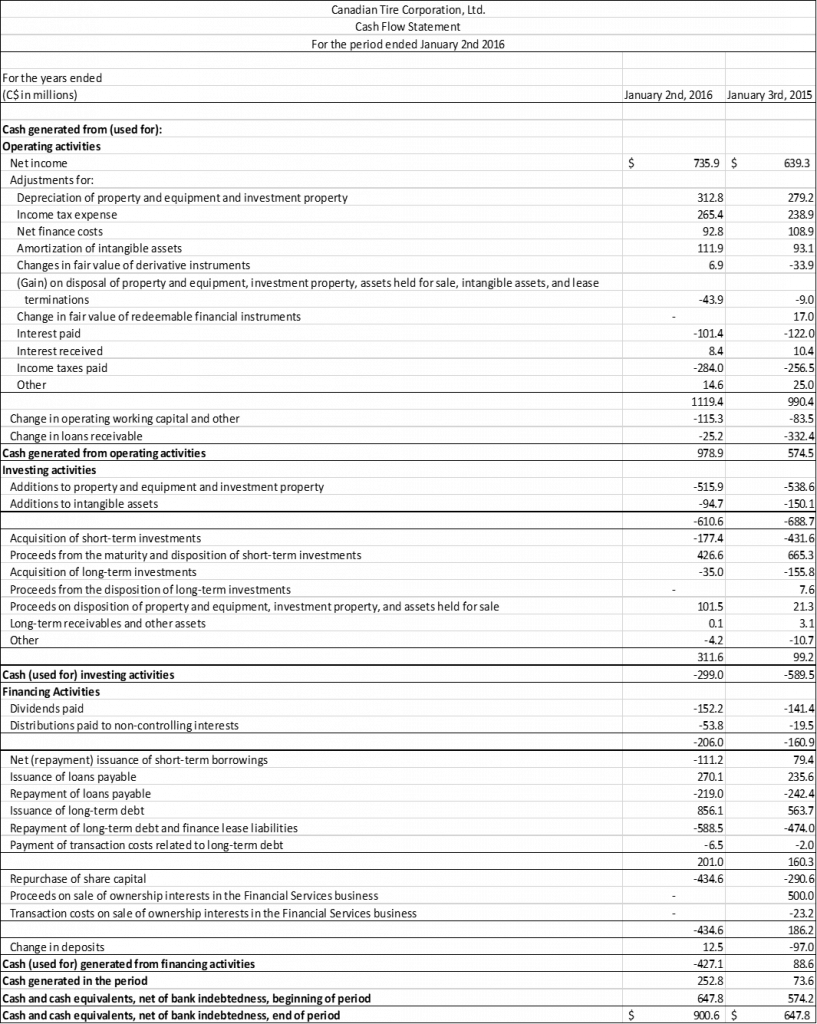
As you’ve noticed, like the income statement and balance sheet, this statement contains many specific accounting terms. So, once again, reading the explanatory notes that accompany the statements is useful to get a better understanding of the statement and its entries.
Examining the Statement of Cash Flows
The Canadian Tire’s cash flow statement shows how much cash has been received and how much has been used during 2015 fiscal year. “Cash generated in the period” reflects the net increase (decrease) in cash over the period. In 2015, Canadian Tire has generated a net increase of $252.8 million in cash. To determine the company’s cash position at the end of the period, we need to add this value to the cash generated in the previous period (cash at the beginning of the period). On this statement this entry is called “cash and cash equivalents, net of bank indebtedness, beginning of period” and is equal to $647.8 million. Adding the two together, we get the cash at the end of the period, or “cash and cash equivalents, net of bank indebtedness, end of period”, $900.6 million, which is the bottom line of the statement. This value reflects the company cash position as a result of the company’s activities throughout the period of the statement.
Recall that cash can be generated, or used for, operating activities, investing activities, and financing activities. So, the cash flow statement is divided into these three sections. Let’s go over each category of Canadian Tire’s cash flow statement.
Cash Generated from (Used for) operating activities is calculated by determining the net income of a business and adjusting it for operating cash inflows and outflows. Net income is found on the income statement and is the business’s profit for the period after production costs, operating and non-operating expenses have been accounted for (we obtain it from the income statement). Among all these expenses, there are non-cash expenses, such as depreciation (we will cover depreciation in more detail in later sections). Although these do not represent a reduction in cash, they make up a portion of the cost of goods sold and are deducted from net income on the income statement. So, to obtain an actual cash amount generated from operating activities, these non-cash expenses are added to the net income to adjust the cash position for the period. Non-operating activities that are accounted for in the investment activities and financial activities sections are also “returned” to net income, so that it reflects the cash flow that was generated specifically from operating activities. These entries are categorized as adjustments.
Adjustments are a complex group of items on a cash flow statement. Different businesses will have different items for their adjustments. The adjustments that Canadian Tire has made include: “Depreciation of property and equipment and investment property”, “Income tax expense”, “Net Finance Costs”, “Amortization of intangible assets”, “Changes in the fair market value of derivative instruments”, “(Gain) on disposal of property and equipment, investment property, assets held for sale, and lease terminations”, “Changes in fair value of redeemable financial instruments”, “Interest paid”, “Interest received”, “Income taxes paid” and other adjustments.
To get cash generated from operating activities, the “change in operating working capital” and “change in loans receivable” (accounts receivable) are also accounted for on Canadian Tire’s cash flow statement. Operating working capital, often referred to as simply working capital, are the liquid assets available to continue and expand operations. Working capital is calculated through the balance sheet and its change in value is added or subtracted from net income to account for cash and other liquid assets available for operations. Loans receivable represent a customer’s obligation to pay back a loan to the company. These obligations represent a part of company’s income that is yet to be received, and thus it has to be subtracted from the income to get the actual cash amount.
So, cash generated from operating activities is the sum of net income and adjustments, including changes to working capital and loans receivable, and amounts to $978.9 million for the 2015 fiscal year.
Cash Generated from (Used for) Investing Activities is calculated by adding the cash inflows and outflows from investing activities of the company. Canadian Tire’s cash outflows include “additions to property and equipment”, “addition to intangible assets”, “acquisition of short-term investments”, “acquisitions of long-term investments”, and “other”. Cash inflows include “proceeds from short-term investments”, “proceeds from long-term investments”, “proceeds on disposition of property and equipment, investment property, and assets held for sale” and “long term receivables and other assets”. For the 2015 fiscal year, Canadian Tire’s cash used for investing activities totaled $299 million.
Cash Generated from (Used for) Financing Activities is calculated by summing the cash inflows and outflows that result from the business financing its operations. These include the costs of issuing debt, distributing dividends to shareholders, and repurchasing shares. The financing activities included on Canadian Tire’s statement of cash flows are “dividends paid”, “distributions paid to non-controlling interests”, “repayment and issuance of short-term borrowings”, “issuance” and “repayment of loans payable”, “issuance” and “repayment of long-term debt”, “payment of transaction costs related to long-term debt” and others. Cash used for financing activities totaled $427.1 million.
Adding the “cash generated by operating activities”, “cash used for investing activities” and “cash used for financing activities”, we get the net cash generated in the 2015 fiscal year:
Cash generated in the period = $978.9 million – $299 million – $427.1 million = $252.8 million
Notice that we add cash generated from operating activities and subtract cash used for investing and financing activities. This is because in this case with cash from operating activities, the cash inflows outweigh cash outflows, while the opposite is true for cash used for investing and financing activities. This is why we say cash generated from operating activities, and cash used for investing and financing activities.
Thus, as we see, Canadian Tire has a cash surplus from its activities for the 2015 fiscal year, with net cash position at the end of the period being $900.6 million.
The income statement, the balance sheet, and the statement of cash flows show the results of management’s past decisions. They are the end products of the accounting process. These financial statements give a picture of the solvency and profitability of the company. The most recent financial statements for most publicly traded companies (on a stock exchange) can be found on their websites under “Investor Relations” or some similar heading or through regulatory bodies that govern the stock exchanges.
