
2.2 Financial Ratios
Financial statements provide key information about a company’s operation. More in depth data about a company’s performance can be revealed by calculating financial ratios using the information from the statements. A financial ratio is a measure of the relative magnitude of two selected numerical values. For instance, the gross profit ratio expresses the numerical relationship between gross profit and sales. If a company has a gross profit ratio of 0.25, this means that for every $1 of sales, the company earns $0.25 on average to cover expenses other than cost of goods sold. Another way of stating this is to say that the gross profit ratio is 25%.
Financial ratios are an effective tool for measuring the financial performance of a company. They provide a common basis for evaluation—for instance, the amount of gross profit generated by each dollar of sales for different companies. Numbers that appear on financial statements need to be evaluated in context. It is their relationship to other numbers and the relative changes of these numbers that provide insight into a company’s performance. For this reason, ratios are often compared to industry averages to get a better picture of how the company is doing, or to past years’ ratios to determine trends in a company’s performance.
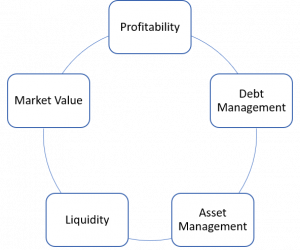
There are five major types of financial ratios:
- profitability ratios that measure various levels of return on sales, total assets employed, and shareholders’ investment;
- debt management ratios that measure the financial structure of a company, its amount of relative debt, and its ability to cover interest expense;
- asset management ratios that measure the company’s inventory and asset profitability and company’s ability to collect on accounts receivable;
- liquidity ratios that measure the ability of a company to satisfy demands for cash as they arise in the near-term (such as payment of current liabilities); and
- market value ratios that measure financial returns to shareholders, and perceptions of the stock market about the company’s value.
It is important to note that financial ratios are only one of the tools used in company’s performance analysis. They show only one side of the story. For example, a company may have sold hundreds of refrigerators last year and all of the key financial indicators may suggest growth. However, trade publications and consumer reports may indicate the arrival of new technologically advanced refrigerators in the next few years. So, if the company does not have the capacity or necessary equipment to produce these new appliances, the present positive financial indicators may not accurately reflect the likely future of the company.
In this section, we will calculate financial ratios to get some insight into Canadian Tire’s performance. The ratios will be obtained based on information from Canadian Tire’s income statement and balance sheet for the years 2015 and 2016. While the ratios themselves often provide useful information to draw conclusions about the company’s performance, it is usually a good idea to compare the ratios to industry averages. These often act as a benchmark in ratio analysis. There are other techniques used to calculate optimal ratio values for the company, however they are beyond this course. Here, we will focus on main financial indicators and their calculations to give you a better idea about the information they provide.
2.2.1 Profitability Ratios
The goal of most companies is to earn profit. To see how well they meet this goal, profitability ratios are commonly used. These ratios are used to determine how efficiently the profits are generated considering company’s expenses and assets. In this section, we will cover the following profitability ratios:
- profit margin ratios,
- return on assets ratio (ROA), and
- return on shareholder’s equity (ROE) ratio.
Profit margin ratios examine what percentage gross profit, operating profit and net profit constitute in total sale revenue of a company. The ratios that will be covered in this section, respectively, are gross profit ratio, operating profit ratio and net profit ratio.
Gross Profit Ratio
The gross profit, or gross margin, is the amount of revenue left to pay operating expenses, non-operating expenses and income taxes after deducting cost of production. The gross profit ratio indicates the percentage of sales revenue that constitutes gross profit. In other words, it shows how much gross profit is in every 1$ of company’s total sales. The ratio is calculated as:
Gross Profit Ratio = Gross Profit / Sales Revenue (2.7)
The higher the value of the ratio, the better the production expenses strategy the company has. When analyzing dynamics of the ratio, we can see whether a company is making more profit relative to production costs or not.
Using the information from Canadian Tire’s income statement we can calculate the gross profit ratio for 2016 and 2015:
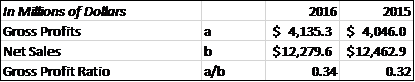
So, the gross profit ratio is 34% in 2015 and 32% in 2014. In other words, for each dollar of sales Canadian Tire has $0.34 of gross profit left to cover operating, non-operating expenses and income taxes in 2015, compared to $0.32 in 2014. The ratio has increased by 6% in 2015. This positive change implies that the company improved the company’s production by decreasing production costs, or by changing company’s pricing policy. So, in 2015, the company operated more profitably.
Operating Profit Ratio
The operating profit is the profit left after production costs and operating expenses have been deducted. It is used to finance non-operating expenses and income taxes. The operating profit ratio shows what percentage of sales is the operating profit. That is, it shows how much operating profit is in every 1$ of company’s total sales. It is calculated as:
Operating Profit Ratio = Operating Profit / Sales Revenue (2.8)
Similarly to the gross profit ratio, the higher the value of the operating profit ratio, the better. Canadian Tire’s operating profit ratio for the 2015 and 2014 fiscal years is calculated as follows:
As we see, the operating profit ratio is 8.5% in 2015 and 8% in 2014. For every dollar of Canada Tire’s sales, the company has $0.085 of operating profit in 2015 and $0.08 in 2014. The ratio has increased by 6%. This change implies that Canadian Tire has decreased its operating costs per $1 of total sales, so now it operates more profitably.
Net Profit Ratio
Net profit represents a company’s income after production costs, operating and non-operating expenses and income taxes have been accounted for. So, the net profit ratio is the percentage of sales revenue retained by the company after deducting all the expenses and taxes. This ratio is commonly used when comparing companies in the same industry. This ratio is obtained by dividing net income by total sales revenue of the company:
Net Profit Ratio = Net Income / Sales Revenue (2.9)
The higher the value of the ratio, the more efficiently the company’s expenses are. When analyzing dynamics of the ratio, we can see whether a company is making more profit relative to its expenses or not.
Canadian Tire’s net profit ratio for 2015 and 2014 are calculated as follows:
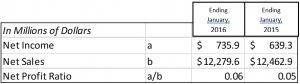
So, the net profit ratio was 6% in 2015 and 5% in 2014. This indicates that for each $1 of sales, Canadian Tire earned $0.06 of net income in 2015 and $0.05 in 2014. This ratio has increased by 20% in 2015, which shows that Canadian Tire’s profitability has increased, while the relative expenses incurred to generate these profits decreased.
Recall that revenues are generated using company’s assets. The financial strength and success of a company depends on how profitably these assets are used. Return on assets (ROA) ratio determines how successful a company is at using its assets to generate profit.
Return on Assets (ROA) Ratio
Return on assets ratio examines whether a company’s sales are adequate in relation to its assets. The ratio tells us how much money is earned by each dollar invested in assets. The ratio is calculated as:
Return on Assets = Net Income / Average Total Assets (2.10)
Note that in the denominator average total assets are used. Recall that the information on the balance sheet reflects a state, rather than a flow, like the income and cash flow statements. So, when using numbers from the balance sheet and income statement in ratios with a goal of estimating a ratio over a period of time (e.g. a year), the numbers from the balance sheet need to be averaged over the period to get a more accurate representation of company’s financials. This is because company’s total assets, liabilities and equity can vary throughout a year (companies sell and purchase equipment, acquire and pay off debts, issue stock etc.), and this must be accounted for when calculating ratios for a period of time, rather than a specific point in time.
This is why when calculating the ROA, we use average total assets. We calculate them by averaging the value at the beginning of the year (end of 2014 when calculating ROA for 2015), and end of the year (end of 2015). So, for 2015, the average total assets were: ($14,553.2 + $14,987.8)/2 = $14,770.5 million.
Thus, the ROA for 2015 is:
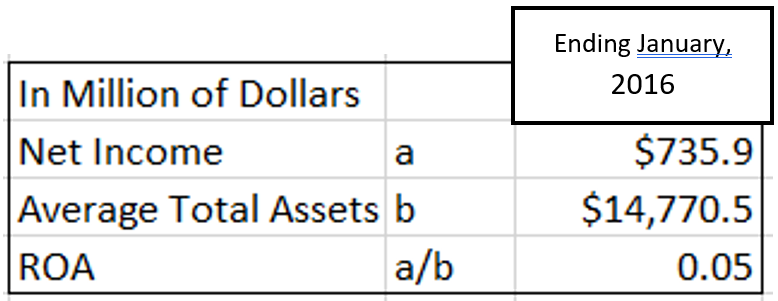
As we see, the ROA is 5% in 2015. That is, each $1 of assets generated $0.05 of net income in 2015. To get a better idea of whether this is a good value, it is generally advisable to compare the ratios with the industry averages. If the ROA is higher than the industry average, or is increasing, this implies that the assets are used efficiently. Usually, an upward trend for the ROA suggests that assets are being used more profitably, while a downward trend indicates that assets are being used less profitably. However, note that after investing in some assets, the pay off might not appear in the same period, so a drop in the ROA in the current period might be evident. This is due to an increase in total assets on the balance sheet, which has not been accompanied by a corresponding increase in production and, thus, income. In such cases, production profitability is likely to increase in subsequent periods, and so a drop in the ROA for the period is associated with an investment in assets, rather than production inefficiency.
The final profitability ratio in this section reflects how much income is earned per dollar of shareholder’s investment. This ratio is especially important for shareholders as it provides information on how much money a company has made using the money the shareholders have invested into it.
Return on Shareholder’s Equity Ratio (ROE)
The return on shareholders’ equity ratio (ROE), commonly referred to as return on equity, measures how much net income was earned per dollar of equity. The ratio is calculated as:
Return on Shareholder Equity = Net Income / Average Shareholder’s Equity (2.11)
Similarly to the ROA calculation, we need to average shareholder’s equity, since we obtain this number from the balance sheet. We do this by averaging the shareholder’s equity at the beginning of period (end of 2014) and end of period (end of 2015), to get average shareholder’s equity for 2015: ($5,630.8 + $5,789.7)/2 = $5,710.25
The 2015 returns on shareholders’ equity ratio for Canadian Tire is calculated as follows:
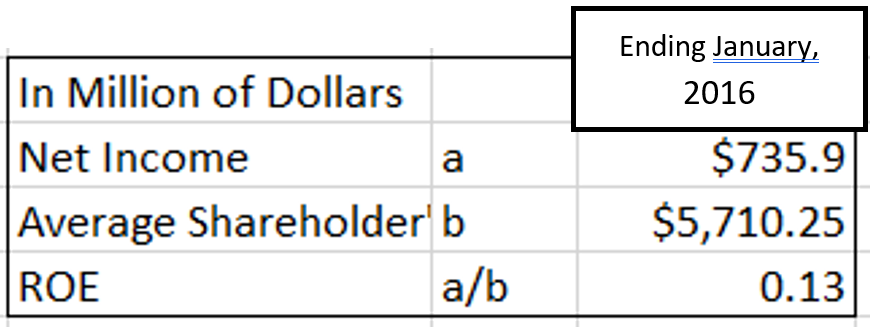
So, in 2015 the ROE was 13%. This means, that $0.13 net income was earned for every $1 of Canadian Tire’s equity. To get a better understanding of whether or not it is a good value, the ratio should be compared to industry averages. If, for example, the industry average was 8%, then we could conclude that Canadian Tire performed better than the average company in the industry.
2.2.2 Debt Management Ratios
A company needs assets to be able to produce goods and services. To acquire assets, a company must raise necessary funds. This can be done through raising equity by issuing and selling stock, or by getting debt. Usually, companies will use both channels, thus raising some money through equity, and some through loans. There are three ratios to consider when analyzing company’s finances, and how it manages its debts: debt to equity ratio, debt to assets ratio and times-interest-earned ratio.
Debt to Equity Ratio
The ratio of company’s total liabilities to total equity is called the debt to equity ratio:
Debt to Equity = Total Liabilities / Total Equity (2.12)
This ratio is used to determine how much liabilities the company has per dollar of equity. Using the information from the balance sheet, we calculate the debt to equity ratio as follows:
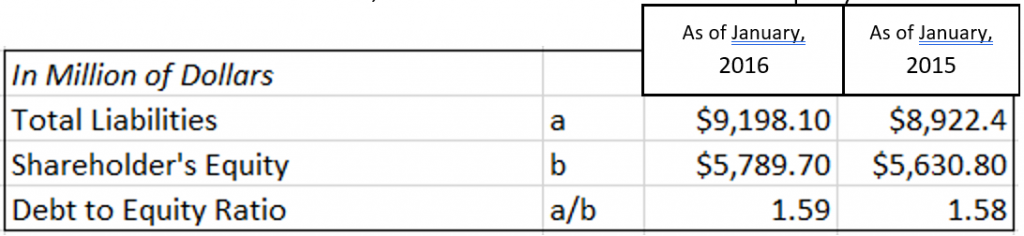
Note that here we do not need to average liabilities and equity, because we are interested in the financial state of the company, rather than progress or change over a period of time.
So, Canadian Tire had $1.59 of liabilities for each dollar of shareholders’ equity as of January 2nd 2016, and $1.58 per dollar of as of January 2nd, 2015. The proportion of debt financing had increased, which means that the company acquired relatively more debt than equity.
On one hand, management’s increasing reliance on creditor financing has its advantages. Issuing additional shares might require existing shareholders to give up some of their control of the company, thus diluting the shareholders’ ownership interest in the company. This can be omitted when acquiring debt instead. Creditor financing may also be more financially attractive. Usually, loans are “cheaper” compared to raising money through selling shares in the long run. By getting a loan, a company has a specific amount plus interest that needs to be repaid, thus a creditor has no direct claim on profits of the company. Moreover, the bureaucratic hassle of getting a loan is less complicated.
On the other hand, management’s increasing reliance on creditor financing poses certain risks. Firstly, one must understand that the loan must be repaid. When a company acquires a large amount of loans, it might face difficulties to pay them off. This has a negative impact on credibility of the company. Moreover, companies that have large amounts of debts must spend a lot of money on interest and loan payments, which might significantly decrease company’s net income and impede company’s growth until a considerable amount of the loan is paid off.
It is also important to note that when creditors decide whether to lend money to a company, they study its total debt load and ability to meet loan payments in the future. So, the higher the debt to equity ratio, the riskier it is for the creditor to lend money to the company, and the harder it will be for the company to acquire new loans. Thus, an increasing debt to shareholders’ equity ratio could hinder company’s borrowing capacity in the future.
Although there is no single appropriate debt to shareholders’ equity ratio, there are techniques for estimating the optimum balance. These are beyond the scope of the book and for now it is sufficient to note that, for Canadian Tire, the debt to shareholders’ equity ratio has increased over the last year. A continuing positive trend into the future is generally viewed unfavourably because of the risk associated with increased debt financing.
Debt to Assets Ratio
The debt to assets ratio describes the relationship between the total liabilities and total assets of the company. It can be calculated as follows:
Debt to Assets = Total Liabilities / Total Assets (2.13)
The debt to assets ratio shows what percentage of assets is company’s debt. A ratio of 1 would indicate that all of the assets have been financed through debt. If the ratio is below 1, this means that assets of the company outweigh company’s debt, and can therefore be used to finance debt if the need arises and the company cannot generate enough profit to repay its debts. If the ratio is higher than 1, this means a company has more debt than it does assets. As a general rule, the higher the debt ratio, the more difficult it may be for a company to find new financing.
Using the information from Canadian Tire’s balance sheet we calculate the debt to assets ratio as follows:
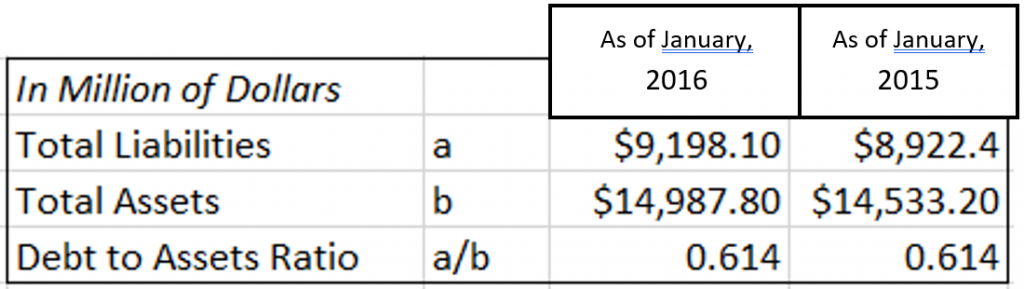
As we see, Canadian Tire’s debt to asset ratio at the end of both years is 61%. This means that the company’s debt is $0.61 per dollar of its total assets. The ratio remained constant.
Times Interest Earned Ratio
Creditors evaluate not just the company’s financial position, but also a company’s financial performance. They do so in order to determine whether it will be able to pay interest on borrowed funds and repay debt when it comes due. One ratio that is commonly used to analyze company’s financial performance is the times interest earned ratio. This ratio shows how many times income from operations could be used to pay the interest expense on the loan. The larger the ratio, the better creditors are protected. If operating income declines, a company might not be able to pay interest on the loan. The ratio is calculated using the following formula:
Times Interest Earned = Operating Income / Interest Expense (2.14)
Here, operating income is used, since it is used to cover non-operating expenses. Recall that expenses associated with acquiring and servicing debt belong to non-operating expenses. Using the information from Canadian Tire’s income statement, the times interest earned ratio is:
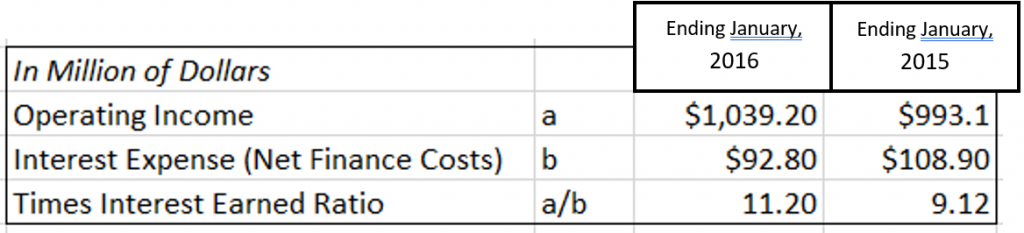
So, in 2015 fiscal year the times interest earned ratio was 1120%, and 912% in 2014 fiscal year. Both values are high, which is a good sign for potential creditors and the company. Canadian Tire’s operating profit is sufficient to cover interest owed by a company. Moreover, the ratio has increased in 2015, showing that the company generates even more profit for every dollar of interest expense compared to previous year.
2.2.3 Liquidity Ratios
Liquidity is the ability of a company to satisfy demands for cash as they arise in the near-term future (such as payment of current liabilities). One term that is often used when assessing company’s liquidity is working capital.
Working capital is the difference between a company’s current assets and current liabilities at a point in time:
Working Capital = Current Assets – Current Liabilities (2.15)
The larger the working capital, the more assets can be converted to cash to pay off the current liabilities, and the more liquid a company is. The need for working capital arises due to company’s need for immediate cash to ensure that its operations are running smoothly. For example, think of Walmart’s need for cash in their registers when they open a new store. If there was no cash in registers, it would be difficult to run the store without holding up customers until enough change can be gathered. Working capital is also required to fund inventory and accounts receivable.
We can calculate the working capital for Canadian Tire using its balance sheet:
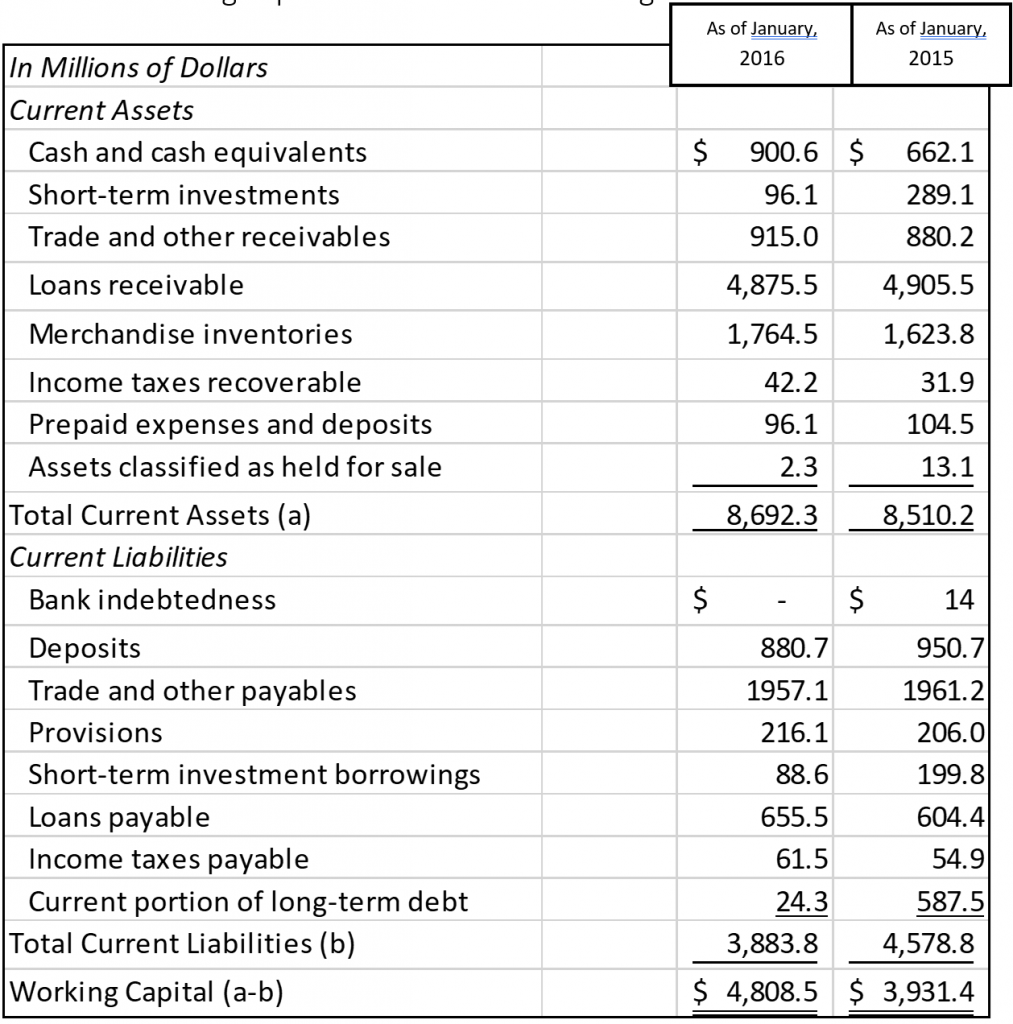
In the schedule above, working capital amounts to $4,808.5 million as of January 2nd, 2016, and $3,931.4 million as of January 2nd, 2015. As we see, the working capital had increased by $877.1 million ($4,808.5 – $3,931.4). So, Canadian Tire’s liquidity has increased and the company has more working capital available as of January 2nd, 2016. This means that the company has more cash to run its business and pay its short-term liabilities as they become due.
In addition to calculating an absolute amount of working capital as a measure of liquidity, ratio analysis is also commonly used. The two ratios that are frequently calculated are the current ratio and the quick ratio.
Current Ratio
Is Canadian Tire able to repay short-term creditors? The current ratio can help answer this question. The ratio shows the relationship between company’s current assets and current liabilities and is calculated as:
Current Ratio = Current Assets / Current Liabilities (2.16)
The ratio indicates how many times a company’s current assets can be used to pay its current liabilities. If the ratio is equal to 1, this means that current liabilities can be paid off with current assets, however acquiring any more current liabilities would result in a company not being able to meet its obligations in the current period. If the ratio is less than one, the company is considered insolvent short-term, since it is unable to repay current liabilities with the current assets it owns. Companies usually aim to have this ratio above 1. The higher the ratio, the better the ability the company has to pay off the current liabilities, and the more protected the company and its creditors are. However, when the ratio is too high, it could imply that there is too much working capital, that might not be needed. Thus, it could be used inefficiently. Recall the Walmart example. There is no need to have extreme amounts of cash in their registers. They need just enough cash to keep the operations running smoothly without unnecessary hold ups. All the extra cash would just be lying pointlessly in the registers, even though it could be used to create profit. When analyzing the dynamics of the ratio, we can see whether the company’s liabilities are rising faster than their assets.
Using the information from Canadian Tire’s balance sheet, we calculate the current ratio as follows:
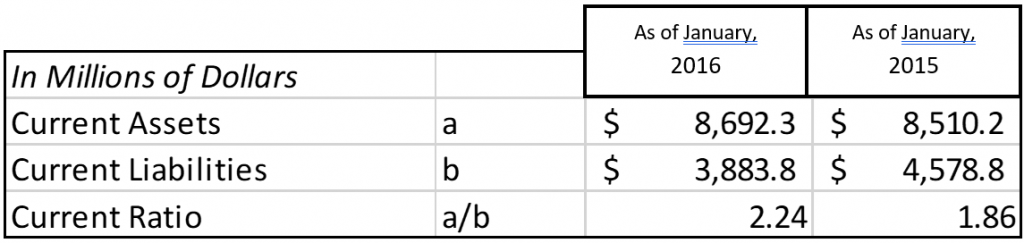
As we see, as of January 2nd ,2016, the current ratio was equal to 224%, and as of January 2nd, 2015, the current ratio was 186%. This means that as of January 2nd ,2016, there were $2.24 of current assets per each $1 of current liabilities, compared to $1.86 as of January 2nd, 2015. So, Canadian Tire has increased its liquidity in 2015. To gauge whether this ratio is high enough, it is usually compare to industry’s average ratios. Information on these is available in various trade publications and business analysts’ websites that assemble financial ratio information for a wide range of industries.
Quick (Acid-Test) Ratio
Another common liquidity ratio is a quick ratio, which is also called an acid-test ratio. To calculate this ratio, current assets are separated into quick current assets and non-quick current assets. The idea is that current assets are used short-term, but even among the current assets there are those that can be used almost immediately (quick assets) and those, that might need some time before they can be converted into cash or used as payment (non-quick assets). Quick current assets include cash, accounts receivables, and marketable securities because they are easily converted to cash and can be used as payment almost immediately. Non-quick current assets include inventories and pre-paid expenses. Pre-paid expenses cannot be redeemed for cash value but are usually used up within a year. Inventories are usually sold within a year. However, if a company cannot wait to find a buyer who will pay full value for the asset, they may have to offer a discount.
The acid-test ratio is calculated as:
Quick Ratio = Quick Current Assets / Current Liabilities (2.17)
The ratio shows if the company would be able to pay off its current liabilities if they become due immediately. It indicates how many quick current assets dollars there are for each dollar of current liabilities. The higher the value of the ratio, the more protected the company and creditors are. However, just like in case with the current ratio, high values of quick ratio might be associated with capital that is not used efficiently (it could be used to create more profit). The parallel is the same as in the Walmart example brought up earlier in this section.
So, what is an adequate quick ratio? It is generally considered that the ratio of 1 is adequate to ensure that a company will be able to pay its current obligations. However, this is a fairly arbitrary guideline and is not appropriate in all situations. A ratio lower than 1 can often be found in successful companies. Usually, companies’ management decides on the level of quick assets to target. This decision is dependent on the company’s strategy, nature of business and company’s perspectives.
To obtain the ratio, we fist need to calculate the quick assets. We get the information to calculate the ratio and quick assets from Canadian Tire’s balance sheet. We get:
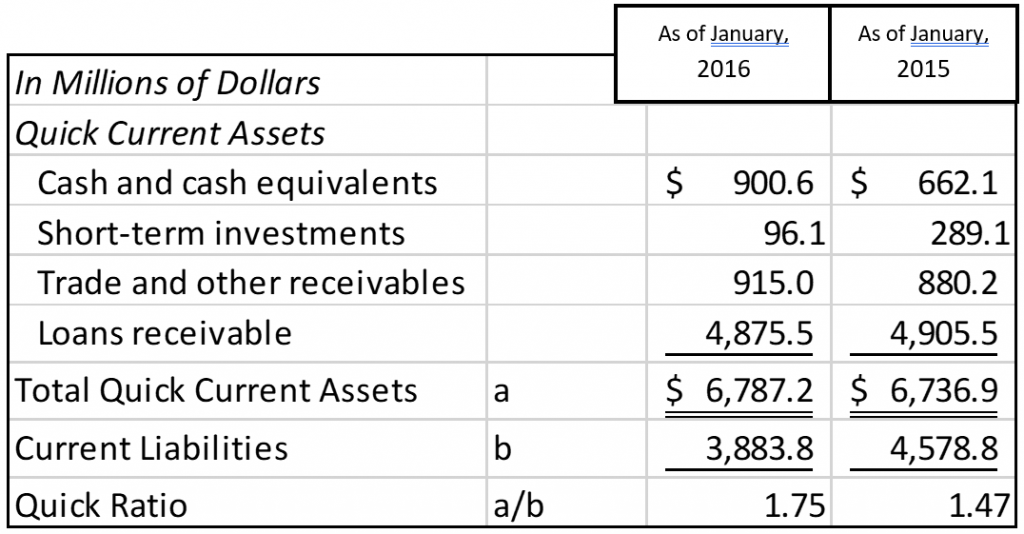
As of January 2nd, 2016, the quick ratio was 175% compared to 147% as of January 2nd, 2015. This means that as of January 2nd, 2016, for every 1$ of current liabilities there was $1.75 of quick assets, compared to $1.47 as of January 2nd, 2015. In Canadian Tire’s case, the ratio values were more than 1, so the company has enough quick assets to pay off its current liabilities. Although the ratio seems high, it may be reasonable. Again, this depends on the company’s strategy decided by management. High values of the quick ratio provide Canadian Tire with flexibility in future planning. From creditor’s perspective, an increasing quick ratio is a good sign. It implies that a company has a better financial ability to pay off its short-term obligations and a reduced risk of insolvency.
2.2.4 Asset Management Ratios
Asset management ratios allow to analyze how efficiently the assets are used by a company. These ratios include: inventory turnover, days sales outstanding and total asset turnover.
Inventory Turnover Ratio
Inventory turnover ratio is used to determine how many times inventory is sold and restocked each year. It is calculated as follows:
Inventory Turnover Ratio = Cost of Goods Sold / Average Inventory (2.18)
Other sources might use sales in the numerator, rather than the cost of goods sold. This approach is also valid, however it might overestimate the ratio. This is because sales include a markup, while the cost of goods sold represents just the costs of the products. So, dividing the cost of goods sold by the average inventory yields a more precise inventory turnover ratio.
The ratio is usually compared to industry averages. As a general rule, management does not want the ratio to be too high or too low. A high turnover implies strong (rapid) sales, and that the company might face being out of stock at times. If the inventory turnover is too low, this means a company has excessive inventory and the sales are weak.
An increasing turnover ratio is usually a sign of good inventory management. It indicates that the average amount of assets tied up in inventory is declining. With lower inventory levels, inventory-related expenses such as rent and insurance are lower because less storage space is often required. However, as mentioned above, lower inventory levels can have negative consequences since items that customers want to purchase may not be in inventory, resulting in lost sales. Having said this, decreasing inventory turnover is usually a sign of poor inventory management because an excessive investment in inventory ties up cash that could be used for other purposes. Increasing levels may indicate that inventory is becoming obsolete (for example in an electronics company) or deteriorating (for example in a company that sells perishable groceries). Obsolete or deteriorating inventories may be unsalable.
Also, note that when comparing the ratios, it is imperative to know how the ratio was calculated (whether sales or cost of goods sold was used in calculations).
Using Canadian Tire’s income statement and balance sheet we calculate the inventory turnover ratio as follows:
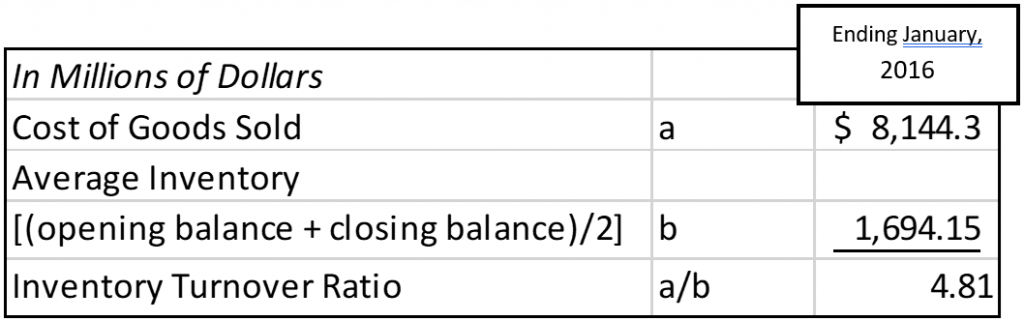
Note that the average inventory is used to calculate the ratio, since we use values form both income statement and balance sheet and are calculating the ratio for a period of time, rather than for a specific point in time. The average inventory is ($1,764.5+$1,623.8)/2 = $1,694.15 million. The inventory turnover ratio indicates that Canadian Tire turned its inventory over 4.81 times in 2015 fiscal year. That is, Canadian Tire sold and restocked its inventory 4.81 times in the year. Comparing the ratio with industry averages and further analysis of Canadian Tire’s management strategy would provide more insight and is usually advisable when performing a comprehensive financial analysis of the company.
Days Sales Outstanding
The day’s sales outstanding ratio, also called the average collection period of accounts receivable, is used to calculate how long it takes on average for the company to collect its payments from customers after the purchase has been made. In other words, it shows the average term of accounts receivables. The ratio is calculated the following way:
Days Sales Outstanding = Receivables / Average Sales per Day (2.19)
Here, the average sales per day are the total sales of the company divided by 365 days.
The lower the ratio, the lower the average time needed to collect customer’s owing money. That is, having shorter average collection period of account receivable means that the company gets paid for its goods and services faster, and is thus more liquid (accounts receivables are faster converted into cash). The higher the ratio, the more time it takes for the customers to pay their debts. High ratios are usually a sign of poor accounts receivable management. The longer accounts receivable remain outstanding, the greater the probability they never will be collected. Thus, generally, companies aim to have shorter average collection period of accounts receivable.
We calculate the ratio using Canadian Tire’s income statement and balance sheet.
Note that for this calculation we used information from both the balance sheet and income statement and the ratio is calculated to reflect a period rather than state. Therefore, we need to average accounts receivable (loans receivable on the balance sheet), by adding the values of the accounts receivable at the beginning of the year (as of January 3rd, 2015) and at the end of 2015 (as of January 2nd, 2016), then dividing it by 2: ($4,905.5 + $4,875.5)/2=$4,890.5 million. The average sales per day in 2015 were: $12,279.6/365=$33.64 million.
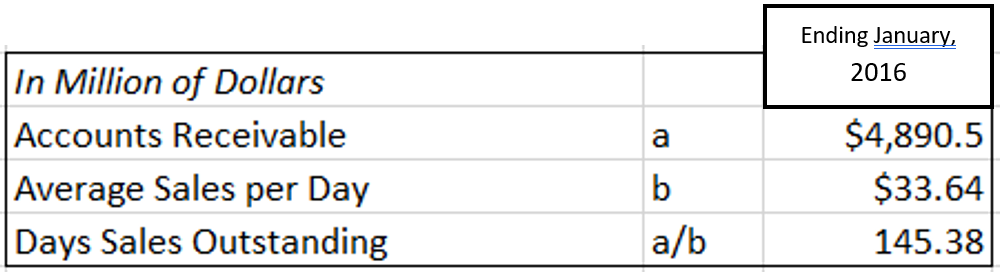
So, as we see, Canadian Tire’s average collection period of accounts receivable is 145.38 days. It is pretty high, since the ratio implies that on average the customers need 145 days to pay their debts to the company. In this case, it is usually advisable to study the structure of accounts receivable. Is the ratio high because of a few clients that owe big amounts or is it because it takes most customers almost 5 months to pay what they owe to the company? If the former is the case, the management will have to change their policy to avoid customers that are less credit-worthy in the future. If the problem is the majority of customers not paying in general, the company might want to create incentives to motivate their customers to pay faster, such as possible discounts or access to special promotions. On the other hand, if the ratio is high because the company offers credit on big purchases, sales of which would otherwise stumble without customer’s access to credit, then this ratio may be very reasonable, even if it might seem high at fist glance. Whichever the case, this example illustrates why just having the value of the ratio may not be enough to accurately assess company’s operations and more information is needed to arrive to reliable conclusions.
Total Assets Turnover
Total assets turnover ratio shows the relationship between the dollar volume of sales and the average total assets used in the business. It is calculated as follows:
Total Asset Turnover = Sales / Total Assets (2.20)
This ratio measures the efficiency with which a company uses its assets to generate sales. The larger the total assets turnover, the larger the income on each dollar invested in the assets of the business.
Using the information from Canadian Tire’s balance sheet and income statement we calculate the ratios as follows:
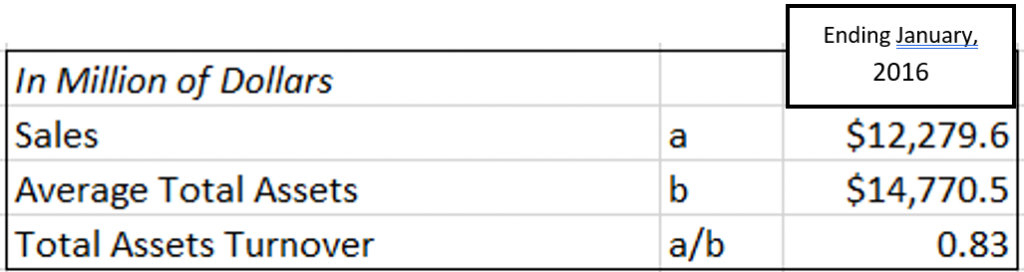
Note that again, in the formula we use average total assets for the period since we are calculating the ratio for a period of time and using information from the balance sheet, which contains on the state of the company.
So, the total assets turnover ratio for Canadian Tire is equal to 0.83. This means, that each dollar invested in total assets of the company generates $0.83 in sales in 2015.
2.2.5 Market Value Ratios
As we have already mentioned, companies often finance their operations by acquiring money through selling their stock. Investors purchase the stock to get a return on the money they invest. But how do we know if buying a certain company’s stock is a good investment? How can one compare investing in one company’s stock to another company’s stock? These questions can be answered by using the so-called market value ratios. The goal of these ratios is to provide information on financial returns on company’s stock to investors. The three market value ratios that we will cover are: earnings per share, price-earnings ratio and dividend yield.
Earnings per Share (EPS)
Many stockholders look at the earnings per share (EPS) ratio when analyzing their investments options. This ratio reflects shareholders’ returns on a per-share basis. The higher the ratio, the more profit is earned on each share. To get this ration, the net income earned in a year is divided by the number of shares to establish how much return has been earned on each share:
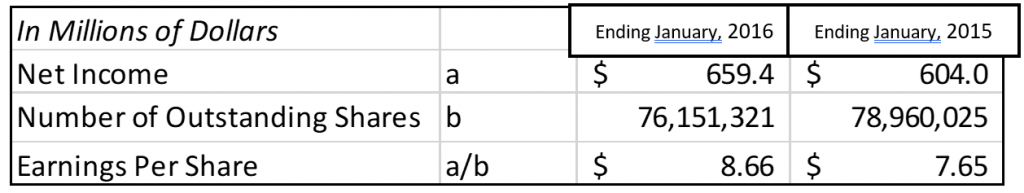
Earnings Per Share = Net Income / Number of Shares Outstanding (2.21)
From Canadian Tire’s income statement, we can see that there were 78,960,025 shares at the end of 2015 and 76,151,321 shares at the end of 2016. The net income in 2016 was $659.4 million and $604.0 million in 2015. So, using formula 2.7, the EPS values for 2015 and 2016 are:
*Note: We must use the net income attributable to shareholders in order to accurately calculate the earnings per share instead of total net income because part of it is from attributions from non-controlling interests.
In 2015, Canadian Tire’s EPS was $7.65. In 2016, the EPS has increased to $8.66 (a 13.2% increase) due to an increase in net income and a reduction of the number of outstanding shares. In 2016, Canadian Tire bought back common shares, reducing the common shares and, therefore, having a positive effect on EPS. So, as we see, in 2016 each share earns more compared to 2015.
Price-earnings (P/E) Ratio
The price-earnings ratio (P/E) reflects the shares’ value (market price) in terms of its earnings. To get this ratio, we divide the market price per share by EPS:
Price-Earnings Ratio = Market Price per Share / Earnings Per Share (2.22)
The market price of a share reflects the investors’ opinions about a company’s future value compared to alternative investments. For example, if it is expected that the company will become more profitable in the future due to its technological advancements etc., investors become more interested in buying this company’s shares, since this implies better financial gains for them. This drives the prices of the shares up. By dividing the market price by the EPS, we get how much investors are willing to pay for $1 of net income generated by the company. Thus, this ratio is used as an indicator of the market’s expectation of a company’s future performance. Higher values of the price-earnings ratio imply investor’s growing expectation.
For example, assume Corporation A has a current market value of $15 per share and an EPS of $1 per share. So, its P/E ratio is 15. If Corporation B has a market value of $4 per share and an EPS of $0.50 per share, its P/E ratio is 8. This means that the stock market expects Corporation A to earn relatively more in the future than Corporation B. For every $1 of net income currently generated by Corporation A, investors are willing to invest $15. In comparison, for every $1 of net income generated by Corporation B, investors are willing to invest only $8. Investors therefore perceive shares of Corporation A as more valuable.
Let’s go back to Canadian Tire. The company’s stock was priced at $122.22 per share at the beginning of 2015 and $118.16 at the beginning of 2016. So, using formula 2.8, we can calculate its P/E ratio for 2015 and 2016 follows:
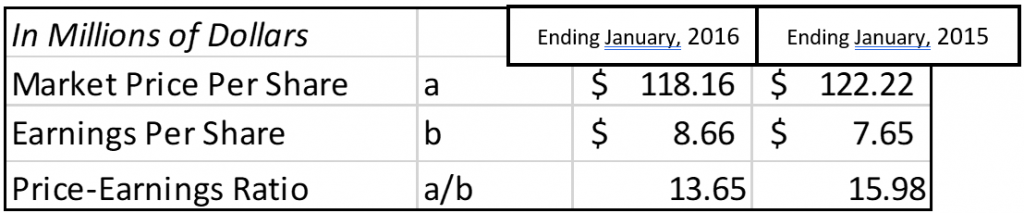
As we see, Canadian Tire’s Price-Earnings ratio has decreased between 2015 and 2016 (it dropped by 14.6%). This indicates that investors are losing confidence in Canadian Tire’s ability to earn income. The ratio indicates that investors are now only willing to pay $13.65 for every $1 of net income Canadian Tire earns, compared to $15.98 in the previous year.
Dividend Yield
Dividends are payments made to shareholders from the company. Many investors’ primary objective is to maximize dividend revenue from share investments. In these cases, investors are interested in information about the earnings available for distribution to shareholders and the actual amount of cash paid out as dividends. The dividends amount is then compared to the price of the share to determine how lucrative it is. This ratio is called the dividend yield and is calculated as follows:
Dividend Yield = Dividends per Share / Market Price per Share (2.23)
This ratio indicates how large a return from an investment in a company’s shares is. The higher the dividend yield, the more money the owner of company’s shares makes.
The relevant information for Canadian Tire over the last two years is shown in the financial statements, as follows:
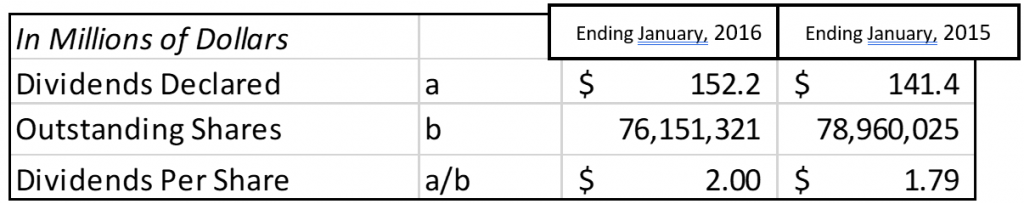
The dividend yield ratio is therefore:
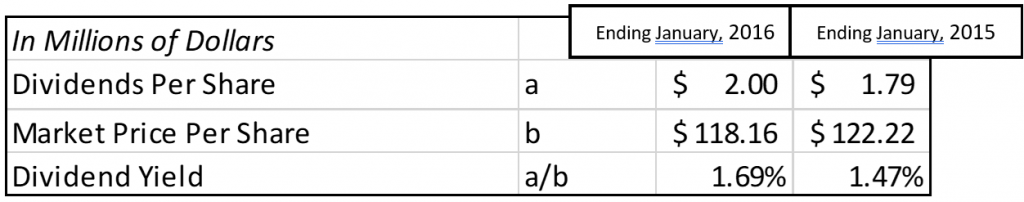
As we see, Canadian Tire’s dividend yield ratio increased from 2015 to 2016. In 2015, investors received $1.47 for every $100 invested in shares. By 2016, this increased to $1.69 for every $100 invested. Investors seeking dividends would view this as a positive change as they are receiving more dividends in 2016 compared to 2015.
