
21
Joel Bruneau and Clinton Mahoney
Learning Objectives
- Define social costs and benefits
- Describe the economic effects of the four categories of externalities
- Explain how externalities lead to market failures
- Describe methods of addressing positive and negative externalities and explain how they work
- Describe the Coase theorem and explain how it works with externalities
Chapter 21: Externalities
The Policy Question: Should the city of New York ban soda to address the obesity epidemic?
In 2012, Michael Bloomberg the then Mayor of the City of New York announced the “Sugary Drinks Portion Cap Rule” which would have banned the sale of sweetened drinks in containers larger than 16 ounces in places that fell under New York City regulation, including delis, restaurants and fast-food outlets. The argument for the ban focused on the negative health outcomes associated with the consumption of high amounts of sugar. These negative outcomes, the promotors claimed, were a societal concern as the disproportionately affected pooper populations who rely more heavily on government supported health care.
Here’s an excerpt from the Washington Post, March 11, 2013 (http://www.washingtonpost.com/blogs/the-fix/wp/2013/03/11/the-new-york-city-soda-ban-explained/):
“Under Bloomberg’s ban, ‘sugary beverages’ larger than 16 ounces could not be sold at food-service establishments in New York City. At restaurants with self-service soda fountains, cups larger than 16 ounces could not be provided. Only outlets that get health-department grades were included, so supermarkets, vending machine operators and convenience stores … didn’t have to worry about the ban. There was no ban on refills. Failure to comply could have led to a $200 fine. It was set to take effect on Tuesday.
[A ‘sugary beverage’ is] a drink with more than 25 calories per eight ounces, which has either been sweetened by the manufacturer or mixed with another caloric sweetener. The ban did not apply to pure fruit juice or fruit smoothies, drinks that are more than half milk, calorie-free diet sodas or alcoholic beverages. Milkshakes, if they were more than half milk or ice cream, were exempt. But sweetened coffee drinks, if less than half milk, were not.”
To some people, the attempted ban represents a ridiculous intrusion of government into the market and individual choice. To others, the ban represents a reasonable government response to an obesity epidemic that puts a strain on and imposes real costs to the public health care system. In order to analyze these conflicting viewpoints, we need to understand the nature and economics of externalities: private actions that have social costs and benefits.
In this module, we will study externalities and develop a model to study them. We can use the model to discuss ways to address externalities through private action or government policy.
With a general understanding of externalities in place, we can proceed to study the New York City soda ban and analyze its effectiveness in dealing with the particular externality problem of the obesity epidemic.
Exploring the Policy Question
- Is there a true social cost associated with the private consumption of sugary drinks?
- Are a ban on the sale of large sized drinks or a tax on sugar content reasonable policy solutions?
21.1 Social Costs and Benefits
Learning Objective 21.1: Define social costs and benefits.
21.2 Defining Externalities
Learning Objective 21.2: Describe the economic effects of the four categories of externalities.
21.3 How Externalities Lead to Socially Inefficient Outcomes
Learning Objective 21.3: Explain how externalities lead to market failures.
21.4 Methods of Addressing Market Failures
Learning Objective 21.4: Describe methods of addressing positive and negative externalities and explain how they work.
21. 5 The Coase Theorem
Learning Objective 21.5: Describe the Coase theorem and explain how it works with externalities

21.1 Social Costs and Benefits
LO: Define social costs and benefits.
To understand externalities it is important to first define the concept of social costs and benefits. Social costs and social benefits are costs and benefits of production or consumption that accrue to everyone in society, including those who are not directly involved in the economic activity. Social costs and benefits are the sum of the private costs and benefits of an economic activity and the external costs and external benefits: the costs and benefits that accrue to those not directly involved in the economic activity.
A key aspect of external costs and benefits is that they are not reflected in prices. Prices are the private costs of a purchase or the private benefits of a sale.
The archetypical example of an external cost is a factory that, in its production of some good, generates pollution. Examples include smokestack emissions from a coal fired power plant, or a liquid contaminant from a refinery operation that gets into the nearby water or soil.
The owners of the factory pay the private cost of production: the total of all of the costs (including opportunity costs) they have to pay to produce their good. Private cost of production can include the cost of raw materials, energy, labour, rent, pollution controls, etc. But there is another cost of production for a factory that soils the air or water: the cost to all those who live near the plant and are affected by the pollution. The social cost of production includes both the private cost of production and this external cost – the cost that accrues to society and not to the plant owners. Only the plant owners pay the private cost of production but society as a whole pays the entire social cost.
This is just one example of external costs and benefits. Consumers might also impose external costs through their consumption, for example, a cigarette smoker in a bar pays the private price for smoking in the form of the cost of the cigarette and the cost of their own negative health consequences. But there is also an external cost: the cost to the others in the bar who have to put up with the irritating and smelly smoke as well as potential negative health consequences of secondhand smoke. The smoker pays the private costs but not the external cost, so the social cost of smoking in a bar exceeds the private cost. Another example is the societal cost of treating obesity-related illnesses if a person with such an illness requires public assistance to pay their medical bills.
An example of social benefits in production is the classic story of the beekeeper that lives next to the apple orchard. The beekeeper produces honey and gets a private benefit from the honey: the total revenue of the sale of the honey. But in keeping bees next to the orchard, the beekeeper is also helping increase the apple orchard’s harvest of apples through the pollination that the bees facilitate. The extra revenue the owner of the orchard sees from the impact of the neighbouring bees does not accrue to the beekeeper and is thus external. The social benefit of an economic activity includes the private benefit and the external benefit.
There can be external benefits in consumption as well. Consider a home owner who buys a lot of flowers and makes a lovely flower garden in their front yard. The home owner gets a private benefit from the consumption of the flowers but the neighbours also benefit – the lovely garden is not only pleasing to look at but it can cause home values to increase as well. The nicer the street of houses looks, the higher the price a house on the street will command. Here again then we have both private and external benefits with the consumption of these flowers for the flower garden.
21.2 Defining Externalities
LO: Describe the economic effects of the four categories of externalities.
Externalities are the costs or benefits associated with an economic activity that affects people not directly involved in that activity. In other words externalities exist when there are external costs or benefits associated with an economic activity. Externalities can be present in both consumption activities and production activities.
All of the economic actions we take, like driving our cars and maintaining our homes, have private benefits and costs. Driving a car takes gasoline and you have to pay to maintain and insure your vehicle. Painting your house makes it more attractive, helps prolong its life and increases its resale value. But many economic activities have associated costs and benefits that accrue to non-users as well. We call these costs and benefits externalities.
Markets are efficient only when all the costs and benefits of an action are private. When external costs and benefits exist, private market fail to achieve efficiency. The market equilibrium results in too much of activities for which there are negative externalities, costs imposed on individuals not directly involved in the economic activity. The market equilibrium results in too little of activities for which there are positive externalities, benefits that accrue to individuals not directly involved in an economic activity.
Externalities can be categorized and doing so makes it easier to identify and analyze them. There are four categories depending on whether they are positive or negative and consumption or production:
- Positive production externalities
- Negative production externalities
- Positive consumption externalities
- Negative consumption externalities
The clearest way to understand the effect of externalities relative to the market outcome is to start with the familiar supply and demand equilibrium. In a graph of this equilibrium, the supply curve is a private marginal cost (PMC) curve and the demand curve is a private marginal benefit (PMB) curve.
To go from the private to the true social cost and benefits, which include externalities, we need to account for external marginal costs and marginal benefits by drawing a social marginal benefit (SMB) curve and a social marginal cost (SMC) curve. How do the private marginal benefit (demand) curve and private marginal cost (supply) curve change with externalities?
When negative production externalities are present, to get the social marginal cost curve, we have to add the external marginal cost (EMC) to the private marginal cost (supply) curve. When negative consumption externalities are present, to get the social marginal benefit curve we have to subtract the external marginal cost from the private marginal benefit (demand) curve. When positive production externalities are present, to get the social marginal cost curve, we have to subtract the external marginal benefit (EMB) from the private marginal cost (supply) curve. When positive consumption externalities are present, to get the social marginal benefit curve we have to add the external marginal benefit to the private marginal benefit (demand) curve.
The following videos explain this graphically. Note that each externality generates deadweight loss – the difference in the total surplus generated by the private free market and what should be generated when we take into account the social costs and benefits. Table 21.1 summarizes the effects each type of externality.
Table 21.1 Effects of Externalities
|
Type of Externality |
External Marginal Cost or Benefit |
Effect on Social Marginal Benefit or Cost Curve |
|
Negative production |
External marginal cost |
Raises the social marginal cost above the supply curve |
|
Positive production |
External marginal benefit |
Lowers the social marginal cost below the supply curve |
|
Negative consumption |
External marginal cost |
Lowers the social marginal benefit below the demand curve |
|
Positive consumption |
External marginal benefit |
Raises the social marginal benefit above the demand curve |
21.3 How Externalities Lead to Socially Inefficient Outcomes
LO: Explain how externalities lead to market failures.
Externalities contribute to inefficient economic outcomes. We can begin to see this with a simple example: You are a smart economics student on the eve of an exam. You study until you feel the marginal benefit of extra study is no longer greater than the marginal cost. Part of the marginal cost is the opportunity cost of not listening to music at a high volume, which is your favourite late evening activity. So, you close the e-text, put away your economics notes and crank up the stereo. You have successfully optimized your own utility and for that alone deserve an A in economics for the night.
However, you also have a roommate who studies chemistry and has an exam tomorrow. Your roommate still needs to study for a few more hours and your loud music will make it hard to concentrate. Your loud music listening imparts an external cost to your roommate, or an externality. If you took into account the effect of the music on your roommate, your calculation of the optimal amount of time listening to music would change, as can be seen in Figure 21.3:
Figure 21.3: Negative Consumption Externality
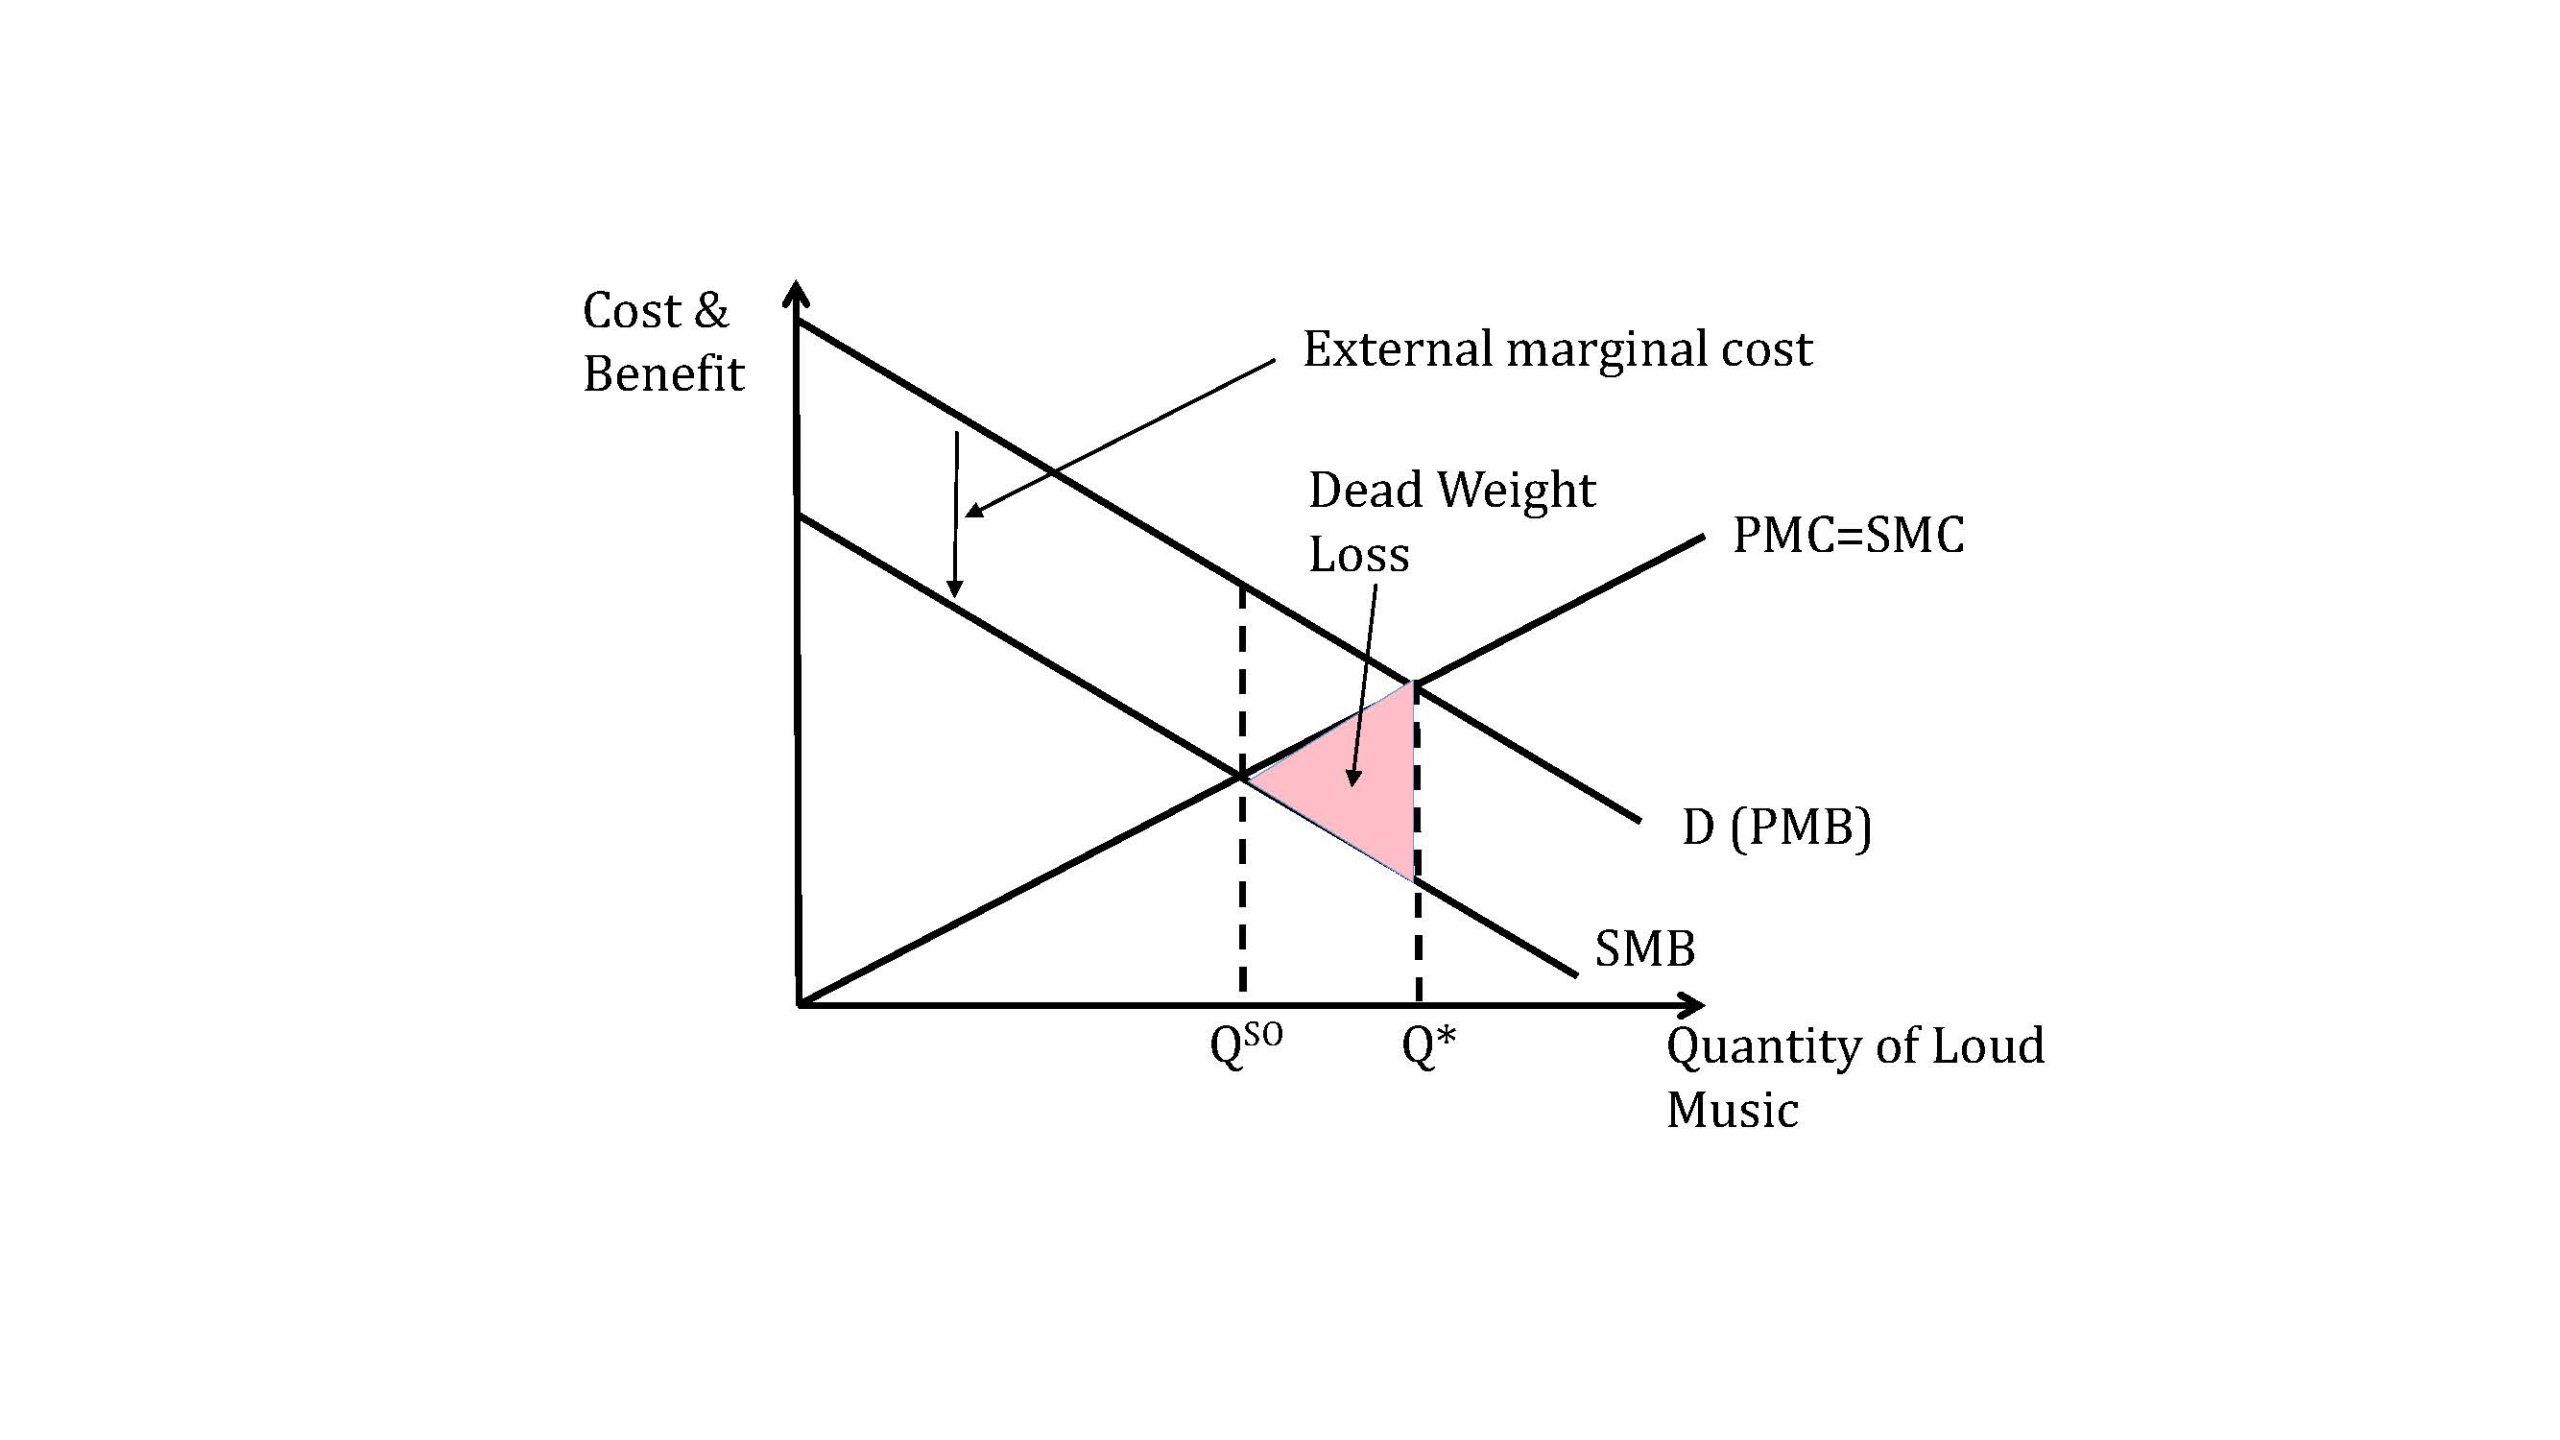
In Figure 21.3 the effect of the loud music can be seen clearly: it imparts an external marginal cost, which we have to subtract from the private marginal benefit to get the social marginal benefit. When the social marginal benefit curve is shifted below the demand curve (PMB), the new intersection between the SMB curve and the supply curve (PMC=SMC) determines the socially optimal amount of loud music, QSO. This is below the amount of loud music that is delivered by the free market, Q*. Because too much of the good is consumed there is dead weight loss as shown in the pink triangle.
The socially inefficient outcome occurs because the individual economic actor makes decisions based on their private costs and benefits. Rational economic actors, as we have learned, will continue to consume or produce until the private marginal benefit of the activity equals the private marginal cost. These actors do not take into account the costs or benefits their actions have on society. As we will see in the next section, there is a potential role for government to intervene in markets to try and improve efficiency.
As noted earlier, in all cases of externalities, we get deadweight loss. We are now in a position to quantify the deadweight loss associated with externalities and socially inefficient outcomes.
21.4 Methods of Addressing Market Failure
LO: Describe methods of addressing positive and negative externalities, including how they work.
Now that we have mastered the essential idea of externalities, both positive and negative, and seen how their presence can lead to inefficient outcomes – dead weight loss – it is appropriate to think about ways that policy could be used to correct this inefficiency.
Let’s start by dividing the externalities into negative and positive as the policy prescriptions are quite different.
Negative Externalities
We can focus on two characteristics of negative externalities in designing policies to address them:
- In equilibrium the amount produced or consumed is too high relative to the social optimum.
- In equilibrium the private marginal cost curve (production externality) or the private marginal benefit curve (consumption externality) do not align with the social marginal cost and benefit curves.
Quantity Controls – Limiting the Economic Activity
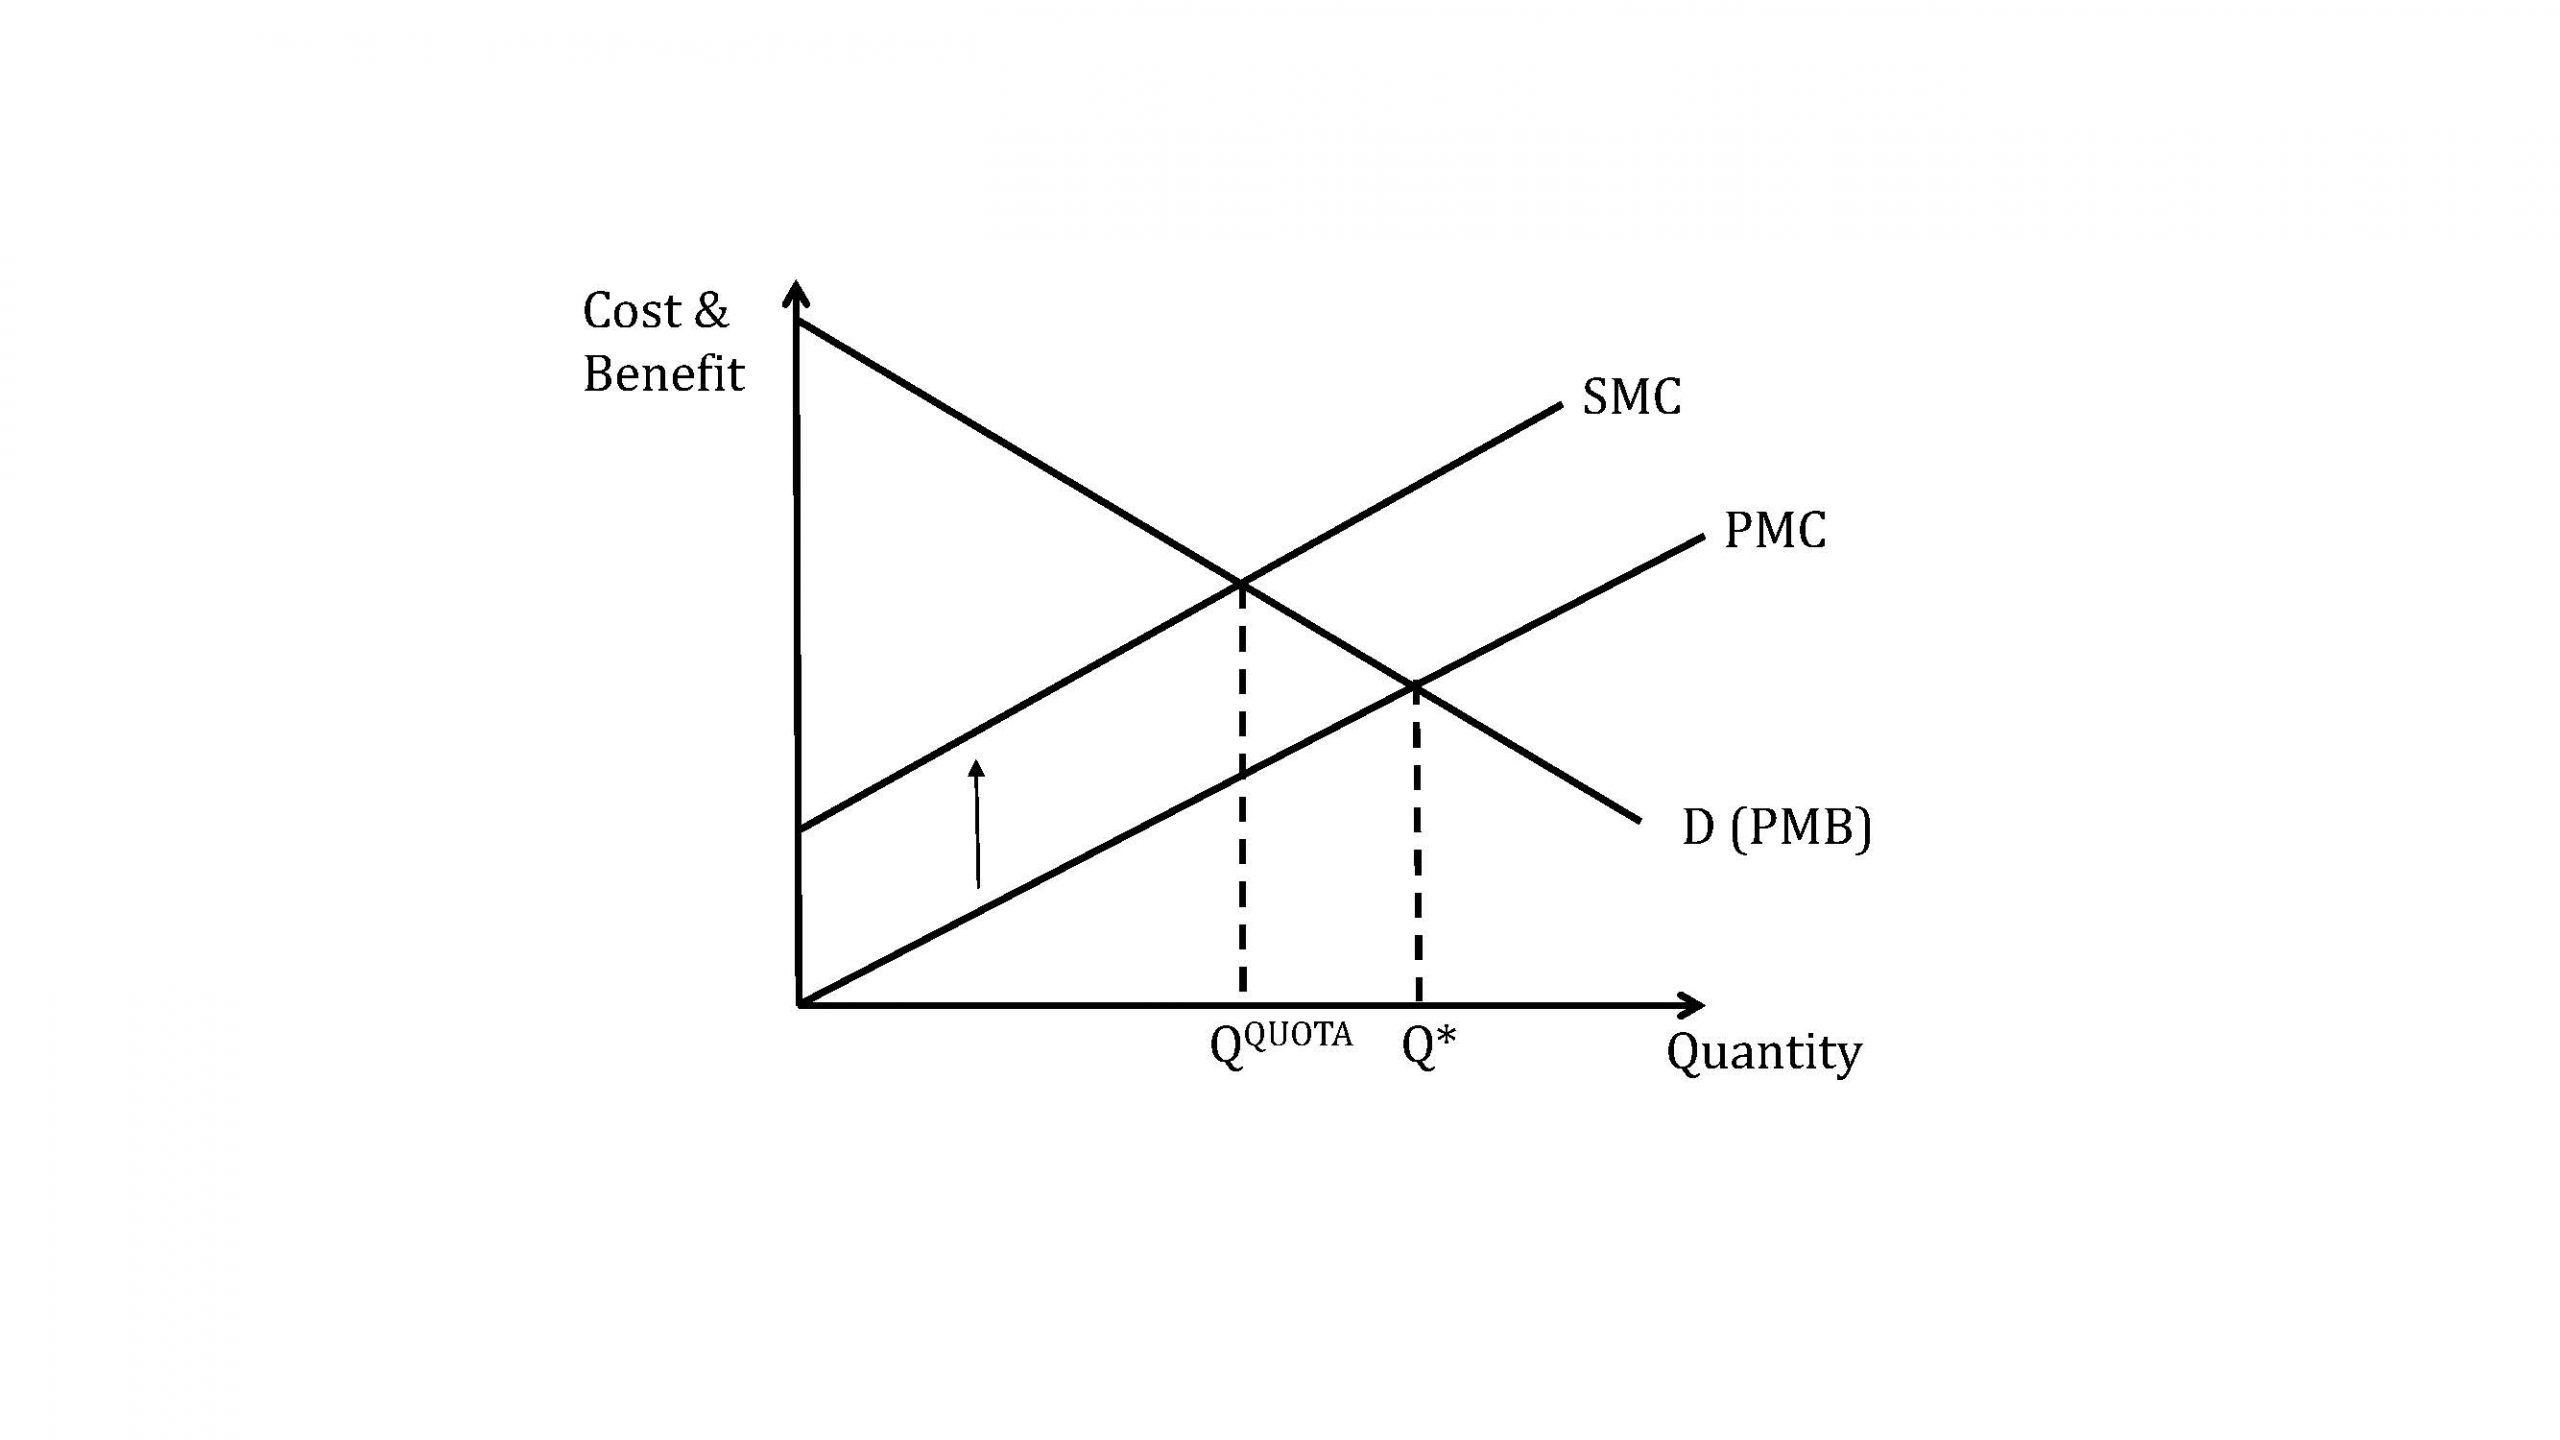
One way to address the externality is to focus on the outcome and limit the amount of the activity that an economic actor can do. For example if the production of a good produces harmful pollution a government could, theoretically, limit the amount of the production of the good to the socially optimal amount. In Figure 21.4.1 we can see the socially optimal amount is QQUOTA, so setting a production quota at that point will achieve the socially optimal level.
Figure 21.4.1: Quantity Controls to Achieve the Socially Optimal Production
Limiting the Externality
Another way to address the externality is to regulate the externality itself. For example, a government could mandate pollution controls for the factory. This has the effect of closing the gap between the private and the social cost because the external cost is lowered. Eventually if the pollution is eliminated the negative externality is eliminated as well and the private marginal cost and the social marginal cost coincide.
Taxes —Adjusting the Cost of the Economic Activity
Both limiting the economic activity and limiting the externality pose challenges. For our pollution example, you have to know a lot about the markets and the available technologies to determine the right quantity of restrictions and pollution controls.
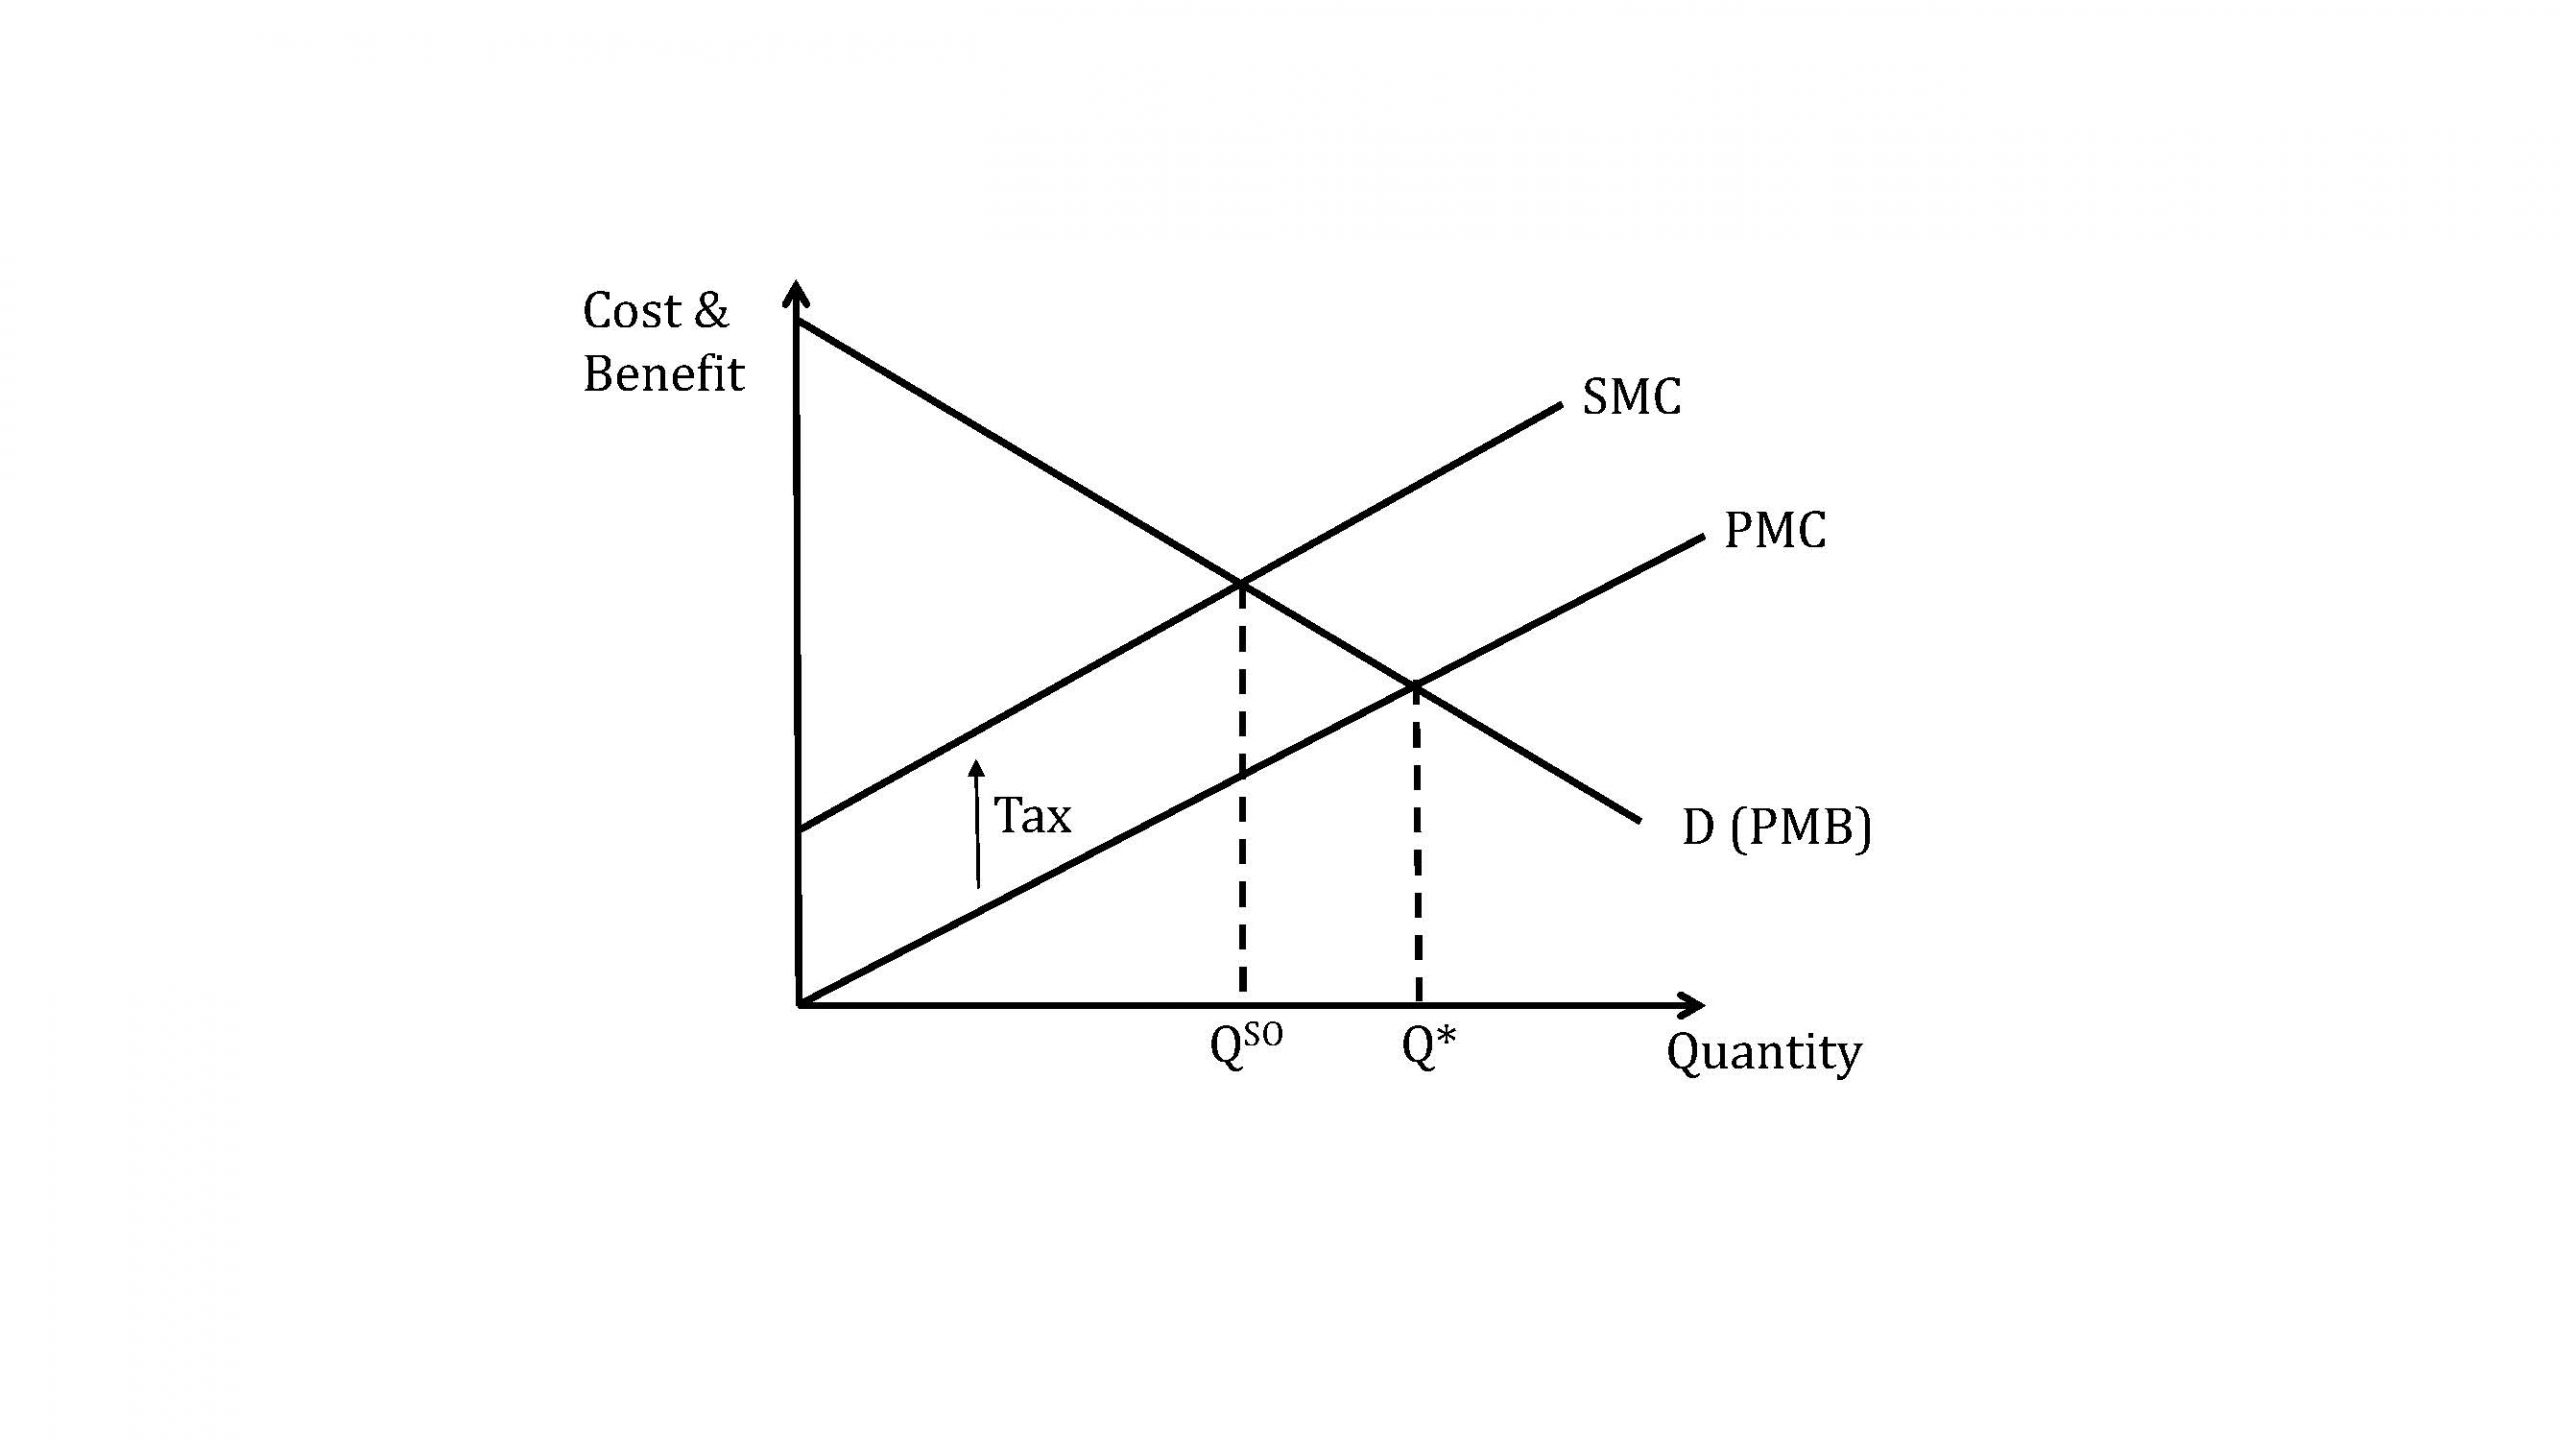
A potentially simpler alternative is to tax the activity so that the private marginal cost equals the social marginal cost or the private marginal benefit equals the social marginal benefit. This type of tax has a special name: a Pigovian Tax. It is named after the English economist, Arthur Pigou, who first proposed such taxes as a way to restore socially efficient market solutions. Figure 21.4.2 shows how a tax equal to the external marginal cost will align the PMC with the SMC and achieve the socially optimal amount of output.
Figure 21.4.2: Pigovian tax equal to the external marginal cost
Positive Externalities
Again we can focus on both the failure to produce or consume enough of the economic activity that has a positive externality and the fact that the private marginal benefit is below the social marginal benefit and the private marginal cost is higher than the social marginal cost.
Quantity Controls—Expanding the Economic Activity
It is not generally thought to be the role of the federal government to compel the consumption or the production of a good. For this reason, U.S. government-imposed quantity controls are somewhat uncommon. Examples of this type of regulation are laws that compel auto manufacturers to install smog control equipment or design cars with pedestrian safety features.
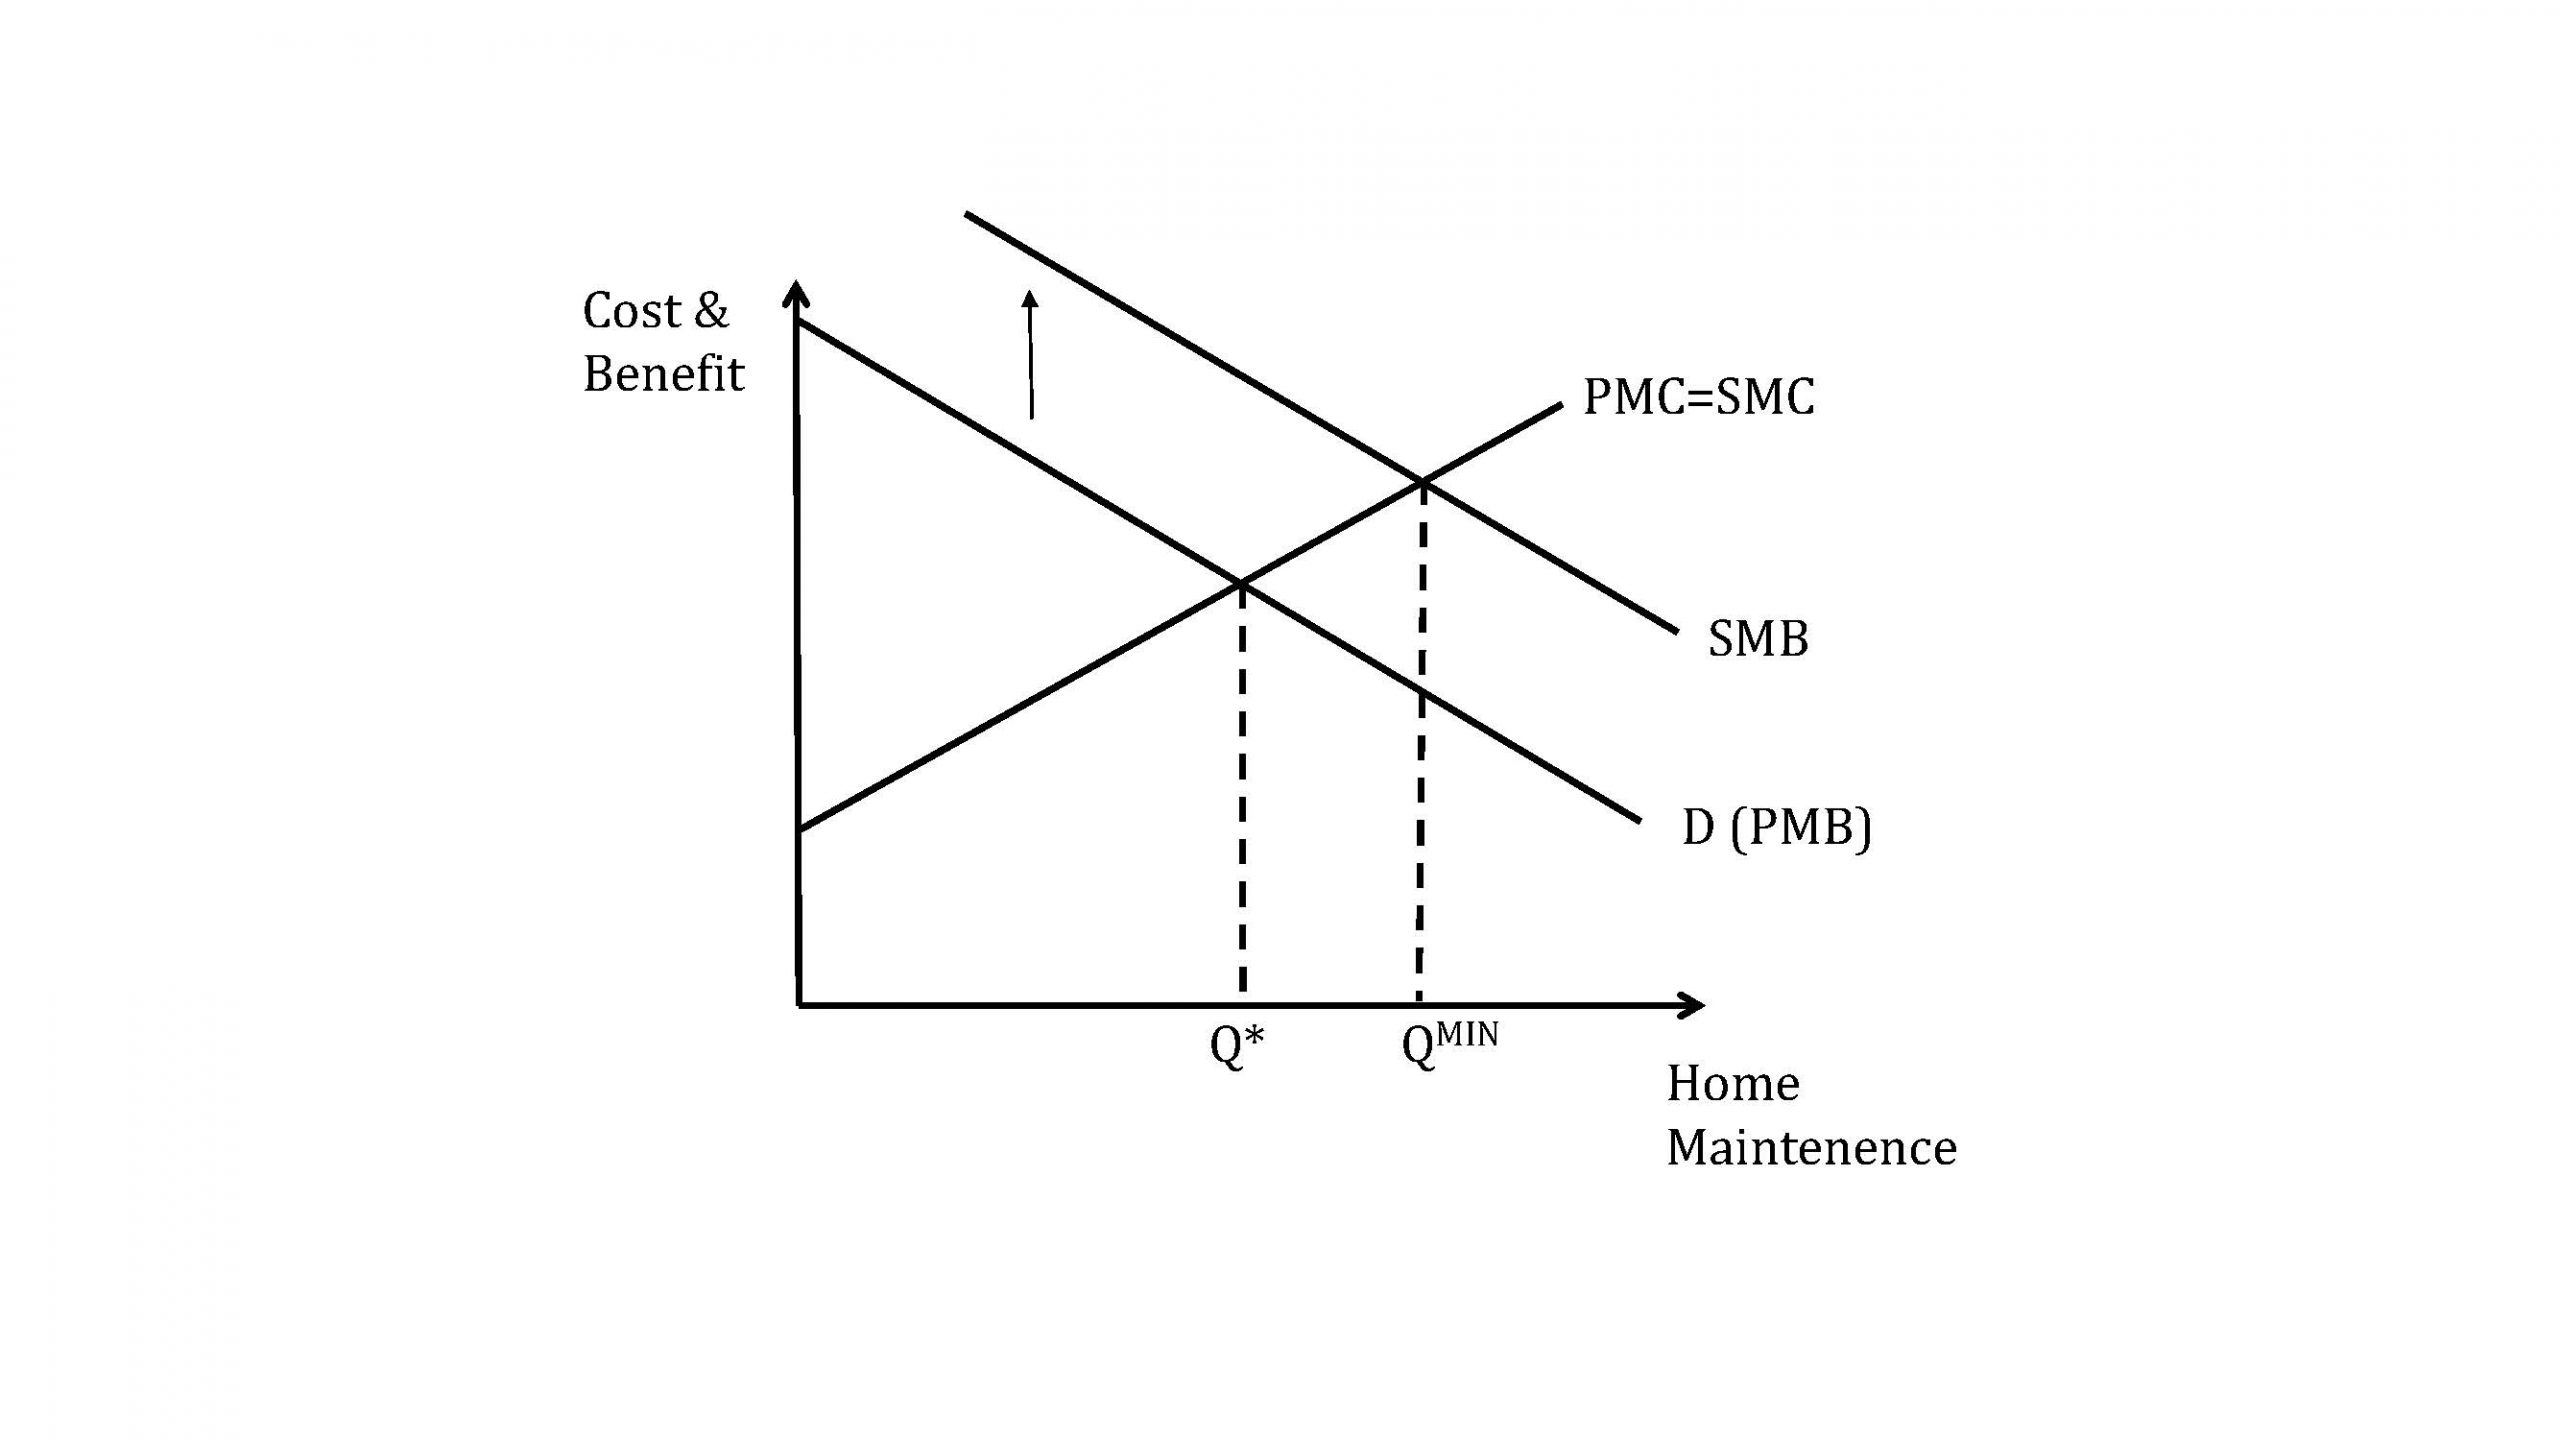
At other levels of government, communities often have codes that set minimum standards for property upkeep. Newer planned communities often have covenants that regulate the upkeep of property. Homeowners in these communities are required to follow the covenants. Figure 21.4.3 shows how such a quantity control over home maintenance can work to achieve the socially optimal level.
Figure 21.4.3: Achieving Optimal Home Maintenance with a Neighbourhood Covenant
Tax Credits, Tax Breaks and Subsidies – Increasing the Benefit of the Economic Activity
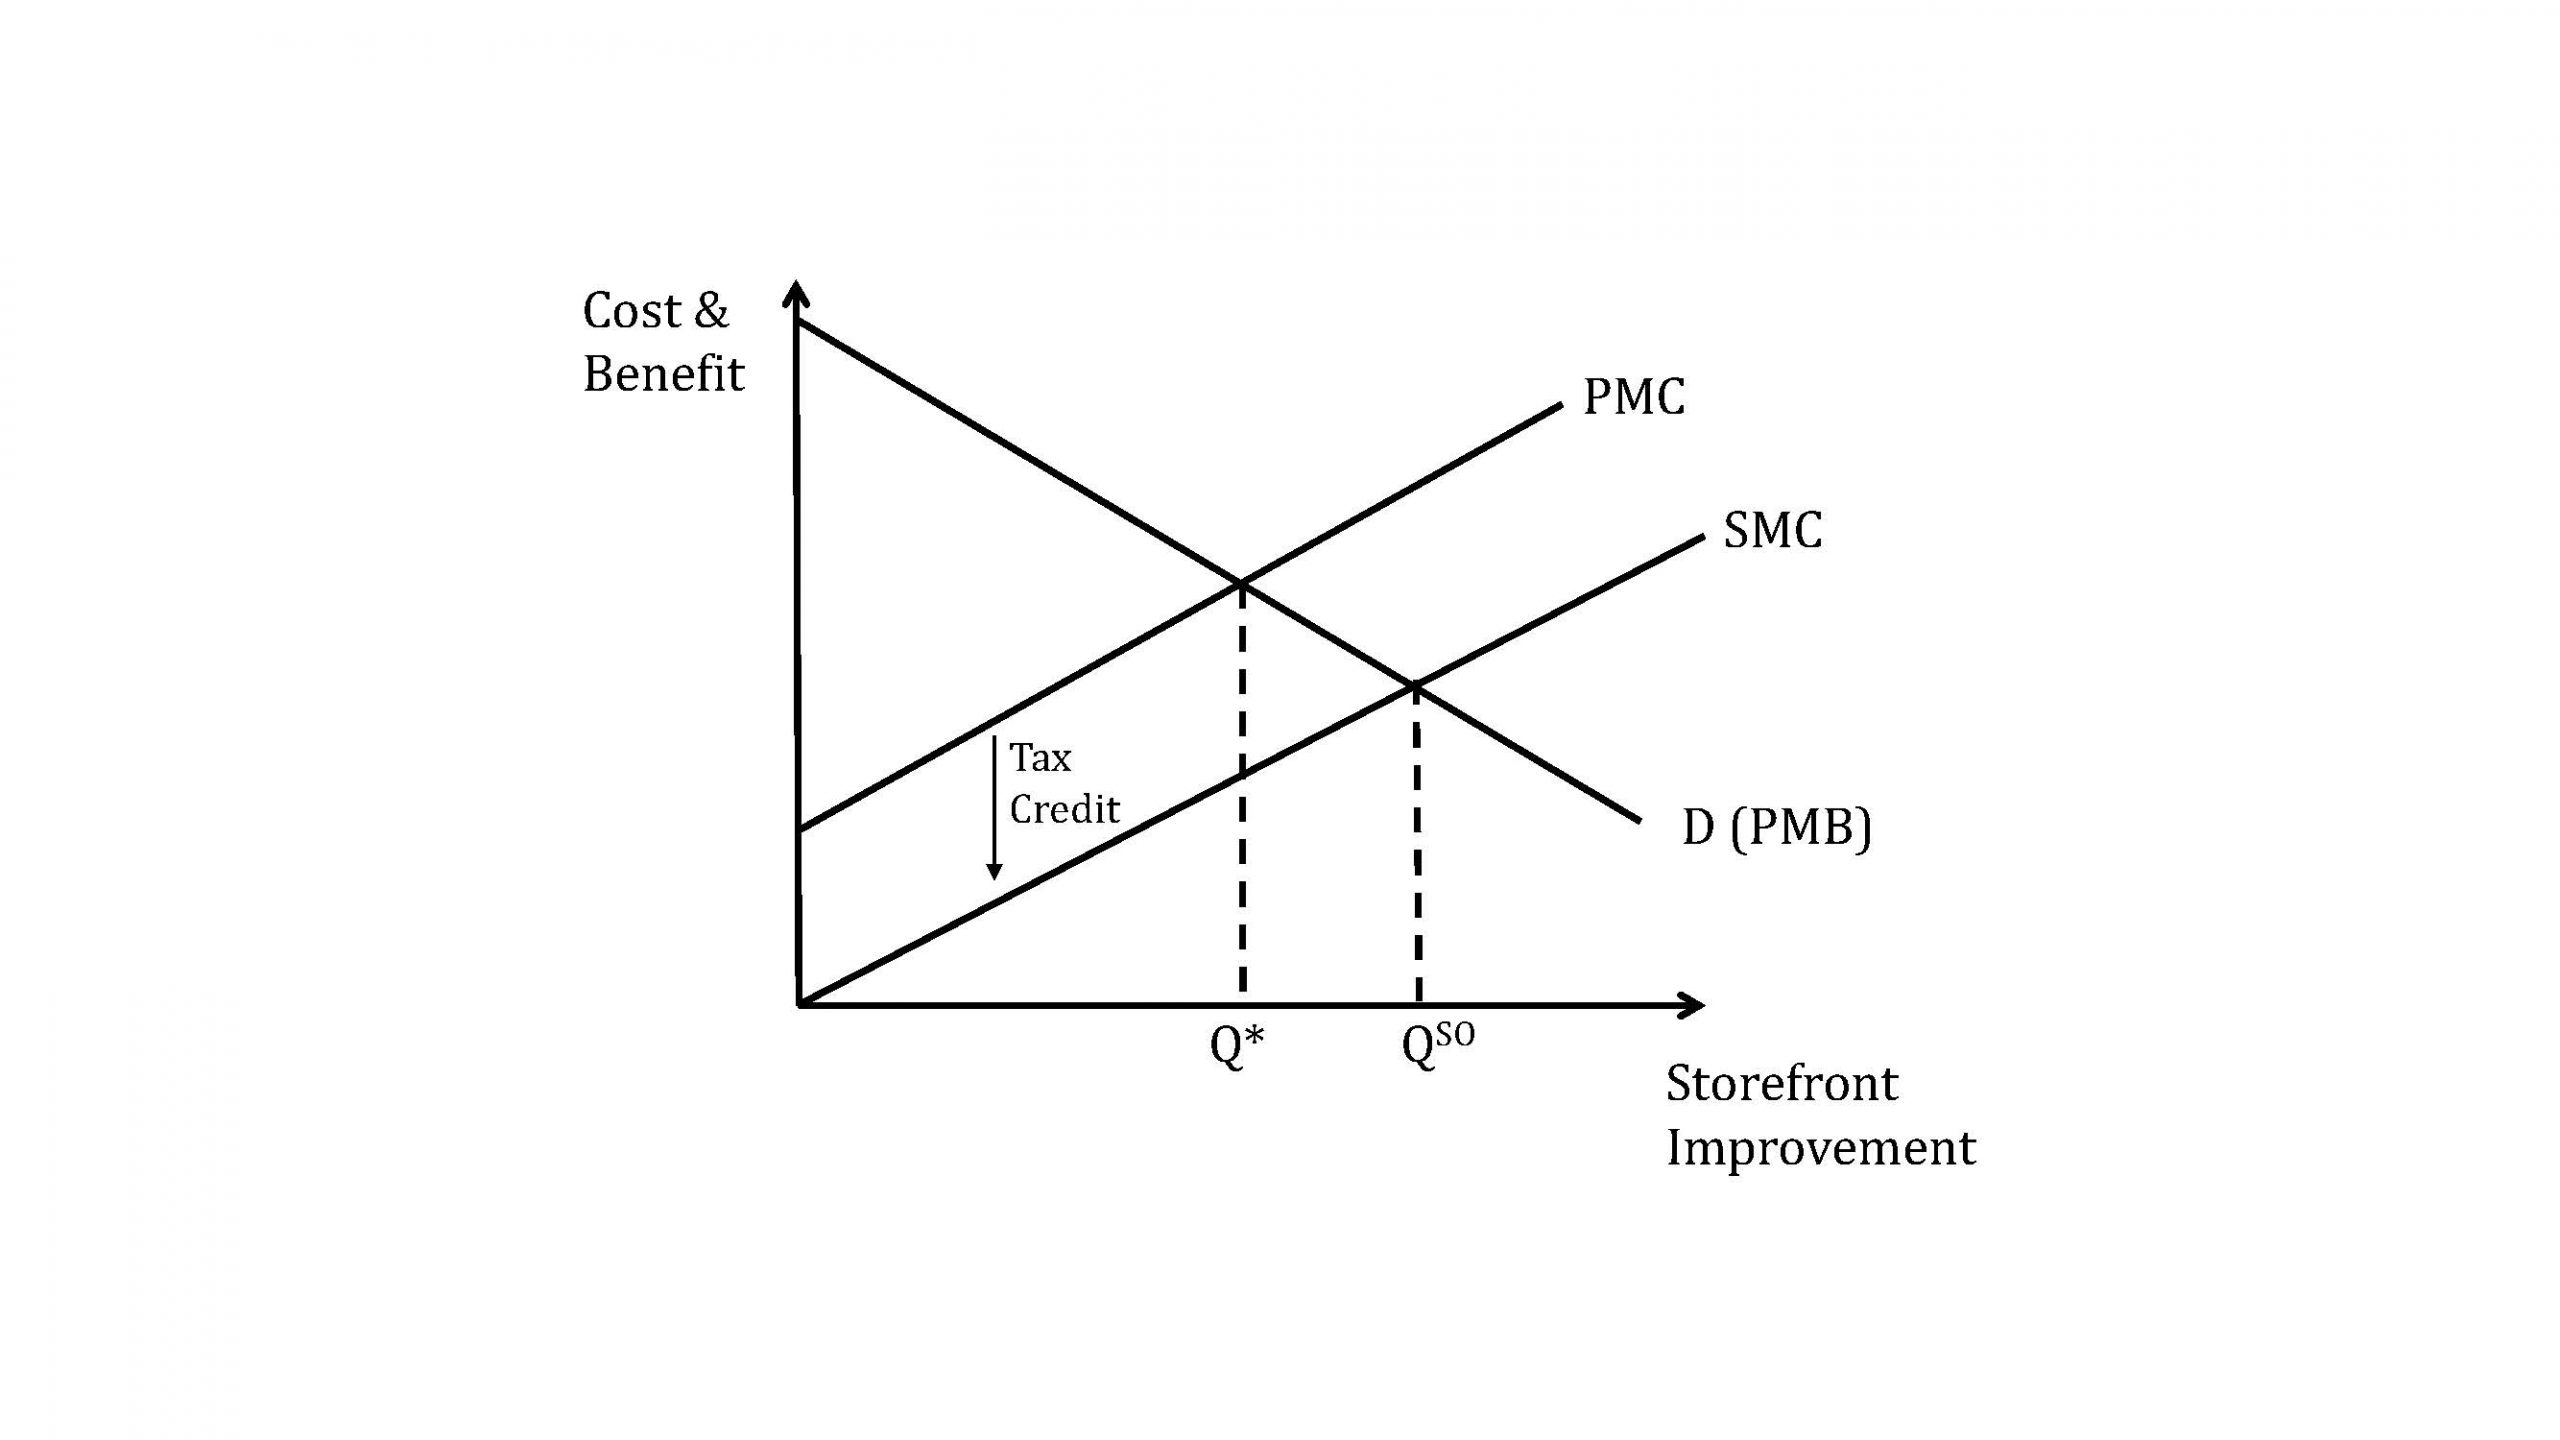
Like the case of negative externalities, a potentially simpler alternative to quantity controls is to simply give credits (or tax breaks) for the activity so that the private marginal cost equals the social marginal cost or the private marginal benefit equals the social marginal benefit. An example is a city credit that store owners can claim if they spend money improving their storefront, as in Figure 21.4.4.
Figure 21.4.4: Achieving Socially Optimal Storefront Maintenance with a Tax Credit
21.5 The Coase Theorem
LO: Describe the Coase theorem and explain how it works with externalities
The common feature of all externalities is that there are costs and/or benefits to economic activity that are not accounted for in the price of the activity. Another way of saying the same thing is that markets for these external cost and benefits do not exist. For example there is no market for the factory that pollutes to pay for the medical bills of neighbours. In 1960 the economist and lawyer Ronald Coase considered what would happen a market did exist for these costs and benefits.
The way he saw the problem was that property rights—the rights to control the use of a good or resource– are not well defined in the case of an air-polluting factory. That is, if neighbours do not have the well-defined right to clean air there is no incentive for the factory to pay for or take into account the neighbours’ medical bills, shorter lifespan, and diminished quality of life due to the odor from the factory. The Coase theorem states that if property rights are well-defined, and negotiations among the actors are costless, the result will be a socially efficient level of the economic activity in question. It is one of the most important and influential theorems in economics. (http://www.nobelprize.org/nobel_prizes/economics/laureates/1991/press.html)
Suppose that the neighbours’ combined medical and other cost, per unit of output, is $10. Suppose also that the marginal private cost of output is constant at $100 per unit. The marginal social cost is then the $100 private cost plus the $10 external cost, or $110 per unit of output.
Defining clean air as a property right and allowing for free negotiation enables the neighbours to quantify at $10 their willingness-to-pay for clean air or, conversely , their willingness-to-accept the dirty air. So, for each unit of output neighbours will demand to be compensated exactly the amount of their true loss: $10. Since they have the right to clean air, the factory owners are obliged to pay them and thus the private cost to the factory owners is exactly equal to the social cost, or PMC = SMC. We know now that this will result in a socially efficient outcome.
Students often are surprised to learn that it does not matter who has the property rights, only that they are well-defined. Suppose that the factory owners instead had the right to pollute the air as much as they like. Neighbours would be willing to pay the factory owners $10 a unit to reduce emissions from the current level. In this scenario, the opportunity cost of producing each extra unit has suddenly increased by $10. So again the PMC is now $110, not $100, the PMC = SMC, and the socially efficient level of output will result. The transfer of wealth is quite different here, so assigning property rights has big implications in terms of the relative welfare of the groups. But in terms of the socially efficient level of output assignment of property rights has no impact.
You may think that implementing the Coase theorem is an ideal policy solution for externalities, but a few words of caution are in order. The assumption of costless negotiation is quite improbable in practice. In order for it to be true in the example of the polluting factory, the neighbours all have to be able to identify themselves and band together, correctly assess the values of the damage done to them per unit of output and be able to demand the money from the factory owners. Costless negotiation is unlikely to be the case in any similar real word situation.
An interesting real-world application of the Coase theorem has happened in sparsely populated areas of eastern Oregon where residents have been paid $5000 by a wind-energy company to put up with the noise of wind turbines (residents must sign a waiver promising not to complain about the noise). Oregon law gives the right to peace and quiet to the residents, so for the turbines to exist the residents must agree to live with the noise. In this case, because the area is sparsely populated and it is pretty easy to determine who is affected (just use a decibel meter), negotiation is relatively easy. [http://www.nytimes.com/2010/08/01/us/01wind.html?_r=3&hp&]
SUMMARY
Review: Topics and Related Learning Outcomes
21.1 Social Costs and Benefits
Learning Objective 21.1: Define social costs and benefits
21.2 Defining Externalities
Learning Objective 21.2: Describe the economic effects of the four categories of externalities
21.3 How Externalities Lead to Socially Inefficient Outcomes
Learning Objective 21.3: Explain how externalities lead to market failures
21.4 Methods of Addressing Market Failures
Learning Objective 21.4: Describe methods of addressing positive and negative externalities, including how they work.
21.5. The Coase Theorem
Learning Objective 21.5: Describe the Coase theorem and explain how it works with externalities.
Learn: Key Terms and Graphs
Terms
Supplemental Resources
YouTube Videos
There are no supplemental YouTube videos for this module.
Policy Example
Policy Example: Should New York Ban Soda to Address the Obesity Epidemic?
Let’s return now to the proposed soda ban in New York City, applying the economic tools, concepts and models from this module.
Step 1: Understand the external cost of the consumption of ‘sugary drinks’
We need to examine the link between sugary beverages and personal health and well-being. We can then try to relate these personal issues to social costs.
A number of studies have demonstrated a connection between consuming soft drinks and negative health consequences. The following points are from the Harvard School of Public Health (http://www.hsph.harvard.edu/nutritionsource/sugary-drinks-fact-sheet/):
Sugary drink portion sizes have risen dramatically over the past 40 years, and children and adults are drinking more soft drinks than ever.
On any given day, half the people in the U.S. consume sugary drinks; 1 in 4 get at least 200 calories from such drinks; and 5% get at least 567 calories—equivalent to four cans of soda. (17) Sugary drinks (soda, energy, sports drinks) are the top calorie source in teens’ diets (226 calories per day), beating out pizza (213 calories per day). (18)
Sugary drinks increase the risk of obesity, diabetes, heart disease, and gout.
A 20-year study on 120,000 men and women found that people who increased their sugary drink consumption by one 12-ounce serving per day gained more weight over time—on average, an extra pound every 4 years—than people who did not change their intake. (19) Other studies have found a significant link between sugary drink consumption and weight gain in children. (20) One study found that for each additional 12-ounce soda children consumed each day, the odds of becoming obese increased by 60% during 1½ years of follow-up. (21)
People who consume sugary drinks regularly—1 to 2 cans a day or more—have a 26% greater risk of developing type 2 diabetes than people who rarely have such drinks. (22) Risks are even greater in young adults and Asians.
A study that followed 40,000 men for two decades found that those who averaged one can of a sugary beverage per day had a 20% higher risk of having a heart attack or dying from a heart attack than men who rarely consumed sugary drinks. (23) A related study in women found a similar sugary beverage–heart disease link. (24)
A 22-year study of 80,000 women found that those who consumed a can a day of sugary drink had a 75% higher risk of gout than women who rarely had such drinks. (25) Researchers found a similarly-elevated risk in men. (26)
And, from Policymic (http://www.policymic.com/articles/16637/bloomberg-soda-ban-how-a-soda-prohibition-might-cut-rising-health-care-costs):
Currently, 58% of New York City adults and 40% of New York City public school children are overweight or obese.
Other studies have attempted to quantify the social cost of negative health consequences associated with obesity. The following information is from Reuters (http://www.reuters.com/article/2012/04/30/us-obesity-idUSBRE83T0C820120430):
Obese men rack up an additional $1,152 a year in medical spending, especially for hospitalizations and prescription drugs, Cawley and Chad Meyerhoefer of Lehigh University reported in January in the Journal of Health Economics. Obese women account for an extra $3,613 a year. Using data from 9,852 men (average BMI: 28) and 13,837 women (average BMI: 27) ages 20 to 64, among whom 28 percent were obese, the researchers found even higher costs among the uninsured: annual medical spending for an obese person was $3,271 compared with $512 for the non-obese.
Nationally, that comes to $190 billion a year in additional medical spending as a result of obesity, calculated Cawley, or 20.6 percent of U.S. health care expenditures.
Those extra medical costs are partly born by the non-obese, in the form of higher taxes to support Medicaid and higher health insurance premiums. Obese women raise such “third party” expenditures $3,220 a year each; obese men, $967 a year, Cawley and Meyerhoefer found.
In addition, there have been studies about the extra cost of heavier drivers on the roads in terms of road wear and tear and extra fuel use. There is also this: An obese man is 64 percent less likely to be arrested for a crime than a healthy man (this last from the above Reuters article).
For the sake of our exercise let’s accept the link between sugary drinks and social costs.
Step 2: Categorize the externality
In this case we have a classic negative consumption externality – there is an external cost to an individual’s consumption of the good and therefore the social marginal benefit is lower than the private marginal benefit.
Step 3: Show the social inefficiency in terms of deadweight loss
because this consumption activity, drinking sugary drinks, is associated with external costs, the socially optimal level of consumption is lower than the market outcome. This results in dead weight loss. We can see the dead weight loss on the graph above.
Step 4: Considering whether the solution will have the desired effect
How do we incorporate the large soda ban into the model? What this ban does is increase the cost per ounce for producers. How? Well, it is cheaper to sell in bulk (see: economies of scale), so if producers are forced to sell in smaller packages the cost per-ounce will increase. This effect will raise the private marginal cost (supply) curve . If you raise it enough, you can reduce soda consumption to the socially optimal level.
But, in the real world we don’t always have a good idea where to stop the private marginal cost. Is this added cost proportional to the external cost? Is it greater or less than the external cost?
From this exercise we can conclude that the policy has the potential to achieve its aims, but there is a question about the magnitude of the effect of the policy relative to the magnitude of the cost of the problem.
Step 5: Consider possible policy alternatives
What about an outright ban on ‘sugary drinks’? This clearly would go too far in the sense that it is well below the socially efficient level of drink consumption.
A Pigovian tax on sugary drinks seems like a much simpler policy. In fact this is a common and popular policy solution to other goods that produce negative externalities, like cigarettes and alcohol. But again the challenge is to get the amount of the tax right so that the socially efficient level is reached.
Note that the ban was stuck down: http://www.nytimes.com/2013/03/12/nyregion/judge-invalidates-bloombergs-soda-ban.html?pagewanted=all
But it could be back: http://www.bloomberg.com/news/2013-03-12/ruling-can-lead-to-tougher-new-york-soda-ban.html
Exploring the Policy Question
- Do you think the ban on the sale of sugary drinks in large quantities is a good idea from a policy perspective? Why or why not?
- Do you think such a ban would have the desired effect?
- Reading the articles above how much discretion do you think local authorities should have to address externalities?
- Do you think the true nature of this problem is an external cost that consumers don’t take into account when making consumption choices or is it more a question of ignorance about the potential negative health consequences? If the latter, can you think of alternate policy solutions?
Candela Citations
- Authored by: Joel Bruneau & Clinton Mahoney. License: CC BY-NC-SA: Attribution-NonCommercial-ShareAlike
- Module 20: Externalities. Authored by: Patrick Emerson. Retrieved from: https://open.oregonstate.education/intermediatemicroeconomics/chapter/module-20/. License: CC BY-NC-SA: Attribution-NonCommercial-ShareAlike
are costs of production or consumption that accrue to everyone in society, including those who are not directly involved in the economic activity
are benefits of production or consumption that accrue to everyone in society, including those who are not directly involved in the economic activity
are the costs or benefits associated with an economic activity that affects people not directly involved in that activity
are costs imposed on individuals not directly involved in the economic activity
are benefits that accrue to individuals not directly involved in an economic activity
are the rights to control the use of a good or resource
is the theorem that states that if property rights are well-defined, and negotiations among the actors are costless, the result will be a socially efficient level of the economic activity in question; named after Nobel Laureate Ronald Coase
