8.2 Elements of Time Management
Visit Audio Recordings for the audio version of this section.
LEARNING OBJECTIVES
- Describe a work breakdown structure and how it relates to activities.
- Describe the use of graphic representations for time management.
According to the Project Management Institute (PMI), project time management includes the following elements:1
- Define activities
- Sequence activities
- Estimate activity resources
- Estimate activity durations
- Develop schedule
- Control schedule
The list of activities, their relationship to each other, and estimates of durations and required resources comprise the work breakdown structure (WBS). The project WBS is a hierarchical—classified according to criteria into successive levels—listing and grouping of the project activities required to produce the deliverables of the project. The WBS represents a breakdown of the project into components that encompass the entire scope of the project. Each level of the WBS hierarchy represents a more detailed description of the project work so that the highest level represents broad categories, and the lower levels represent increasing amounts of detail.

Larger and more complex projects often require a larger WBS. The size of the WBS is directly related to the amount of work on the project and how that work is divided into work packages. The WBS can be developed around the project phases or the project units or functions that will be performing the work. A WBS organized around the project phases facilitates the understanding of the amount of work required for each phase of the project. A WBS developed around the project units or functions of the project facilitates the understanding of the amount of work required for each function.
The following example, “John’s move”, will often be used throughout the rest of the book. It has a low level of complexity compared to a larger project and would probably not receive the amount of detailed planning described in the following examples; however, we felt this basic scenario, which is familiar to most people, will demonstrate the concepts that can be applied to any project.
John’s Move
John has a small but important project. He has accepted an instructional design position in Calgary and now has to move from Montreal to Calgary and be there, ready to work, right after the Christmas holidays. If the furniture arrives in good condition at least two days before John starts work, and for less than five thousand dollars, the project will be a success. The move to Montreal five years ago cost five thousand dollars, but John is smarter now and will use his friends to help, so he is confident he can stay within budget.
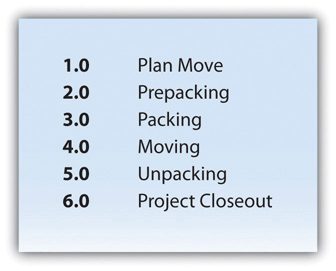
Developing a WBS begins by defining and developing lists of all activities—work performed on the project that consumes project resources, including cost and time—needed to accomplish the work of the project. The first draft of the WBS includes activities at the highest level of the hierarchy or the management level and typically includes the major activities or summary activities required to accomplish the deliverables identified in the project scope of work. On John’s move project, these top-level activities are numbered 1.0, 2.0, 3.0, and so on, as shown in figure 8.1.
Figure 8.1 Summary Level Activities
One of John’s Summary Level Activities is Packing (3.0). The activity is then decomposed—broken down into smaller units—to the next level by listing the tasks needed to accomplish that step, as shown in figure 8.2. The first subdivision of activities is listed as 3.1, 3.2, and 3.3. The WBS shows a greater level of detail by listing the tasks needed for each subdivision activity, such as 3.3.3 Pack bedroom (which could be decomposed further, such as 3.3.3.1 Pack closet, 3.3.3.2 Pack drawers, etc.). This type of numbering of the activities is called intelligent numbering. In intelligent numbering, the numbering system has meaning so that a member of the project team knows something about the activity by the number of the activity. For example, any activity associated with packing begins with a 3; even picking up donuts is an activity under packing because the donuts are a form of payment for the packing labour of Dion and Carlita.
Figure 8.2 Major Activity Decomposed into Smaller Activities
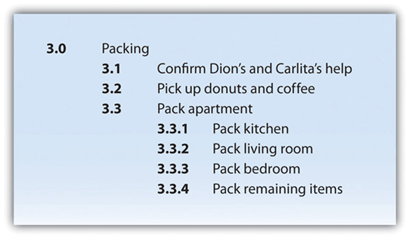
The WBS is developed or decomposed to the level that the manager needs to control or manage the project. In our John’s move example, the project schedule may have been just as effective without detailing the packing of the individual rooms in the old apartment. If we deleted these items, would John know when he needed to pack each one of these rooms? If the answer is yes, then we may not need that level of detail.
Estimation of Duration
After the project team has created the WBS, each activity is reviewed and evaluated to determine the duration (how long it will take to accomplish from beginning to end) and what resources (time, materials, facilities, and equipment) are needed. An estimate is an educated guess based on knowledge, experience, and inference—the process of deriving conclusions based on assumptions. The accuracy of the estimate is related to the quality of the knowledge and how that knowledge is applied. The person with the most knowledge may not be the most objective person to provide duration estimates. The person responsible for the work may also want to build in extra time. Multiple inputs into the duration estimate and a more detailed WBS help reduce bias—the making of decisions based on a prejudged perspective.
Duration Estimate for Training
A language training facility recently decided to start teaching Arabic. The language training manager will need to know when the new language materials can be acquired, when the new instructors will start their training on the curriculum and when they can start teaching. The facility’s human resources manager will need to know what skills the workers need to teach Arabic and how much time each training class will take. In addition, the HR manager will need to include activities to locate facilities, schedule training, write contracts for trainers, and manage the initiation of training classes. As can be seen, a duration estimate can become very complicated and require an even greater level of detail, which could be measured in days, hours or even minutes.
The unit of time used to develop the activity duration is a function of the level of detail needed by the user of the schedule. Typically, larger and more complex projects require a more detailed WBS—which usually translates into shorter time for the actual activities. The unit of duration is typically working days but could include other units of time such as hours, weeks, or months. The unit chosen should be used consistently throughout the schedule.
Resource Allocation and Calendars
A common resource constraint is availability. To consider the availability of team members, consultants, and vendors, you can create a resource calendar that indicates which days they are available and which are days off. A calendar for team members from the same company could be the company calendar that shows working days, weekends, and holidays. Individual team members can have individual calendars that show their vacation days or other days off, such as parental leave days. If major pieces of equipment are only available for certain periods of time, they can be given a resource calendar.
Resource calendars become important tools when changes must be made to the schedule. When a resource calendar is applied to a duration estimate, the duration in days is distributed across the available calendar days. For example, if the duration is three days and the start date of the activity is Thursday, the activity would begin on Thursday and end on Monday of the following week, assuming the resource calendar shows that the person has the weekend off. If the weekend included an extra day off for a holiday like Labour Day, the completion day of the same three-day activity would be pushed to Tuesday.
Activity Sequencing
Determining the schedule of a project begins by examining each activity in the WBS to determine its relationship to the other activities. The project logic is the development of the activity sequence or determining the order in which the activities will be completed. The process for developing the project logic involves identifying the predecessors—activities that come before—and successors—the activities that come after.
Project Logic for John’s Move
Figure 8.3 Relationship between Two Activities
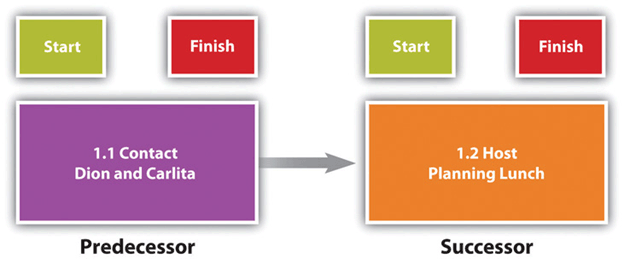
These terms define a relationship that is similar to a family relationship like father and son. The father exists in time before the son. Similarly, each element of the diagram can have predecessor-successor relationships with other elements, just like a father can be the son of someone else. Additionally, just as the son has a mother as well as a father, activities can have more than one predecessor.
The relationship between a predecessor activity and a successor activity is called a dependency. The successor activity starts after and is dependent on the predecessor activity. Because the conversation with Dion and Carlita must take place before a planning meeting can be scheduled, this is called a natural dependency because the relationship can be inferred logically. Activities that have predecessor-successor relationships occur sequentially—one after the other. Another term for this type of relationship is finish-start, which means the first activity must finish before the next one can start. (Refer to the figure 8.3.) Because the finish-start relationship is by far the most common, the type of relationship is assumed to be finish-start unless otherwise mentioned.
Some activities take place concurrently—at the same time. If they must begin at the same time, they have a start-start relationship. If the activities can start at different times but they must finish at the same time, they have a finish-finish relationship. (Refer to Figure 8.4.)
Figure 8.4 Start and Finish Relationships
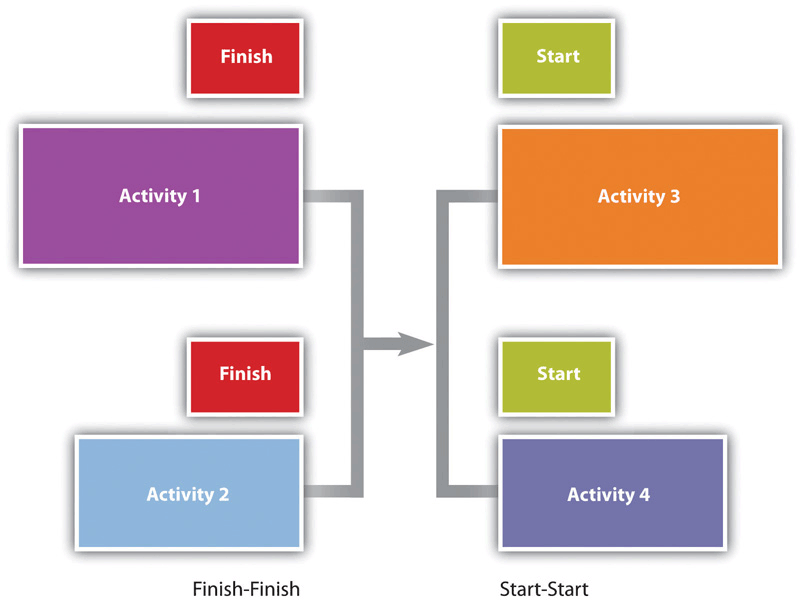
Concurrent activities can be constrained to finish at the same time or start at the same time.
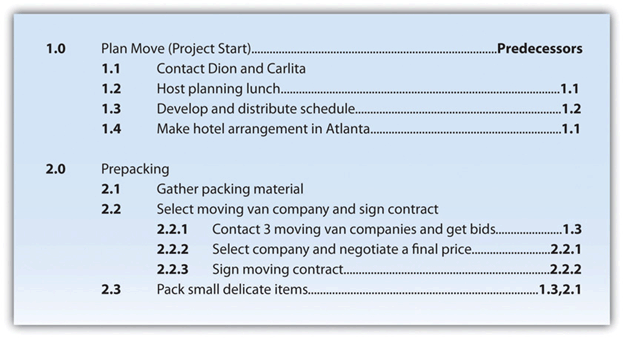
Figure 8.5 shows the activities in John’s move with the predecessors identified for the Plan Move and Prepacking groups of activities.
Figure 8.5 Outline of Activities with Predecessors Identified
Lag and Lead Times
As stated before, most activities in a network diagram have a finish-start relationship. If a certain amount of time must go by before a successor activity can begin, the required delay is called lag time. In some cases, the successor activity can overlap the end of its predecessor activity and begin before the predecessor is finished. This is called lead time.
Lead Time in John’s Move
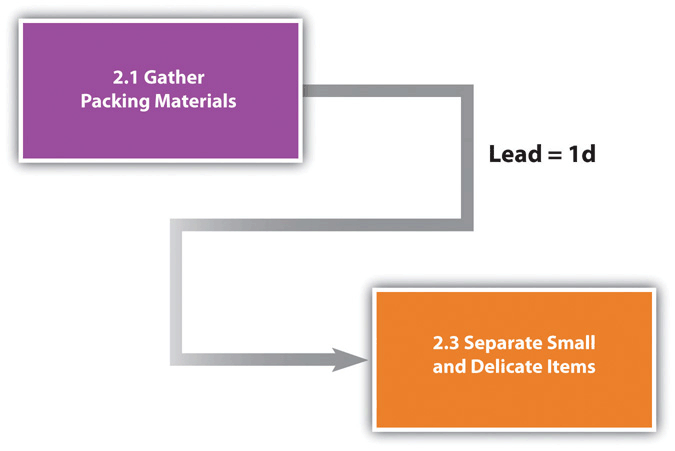
In John’s move, you might begin separating the small and delicate items that will be packed in step 2.3 before you get the packing materials in step 2.1 so that when the materials are available, step 2.3 is already partially completed. If preparing the small items for packing can overlap its predecessor and shortens the time it takes to accomplish both tasks by a day, it has a lead time of one day.
Figure 8.6 Lead Time
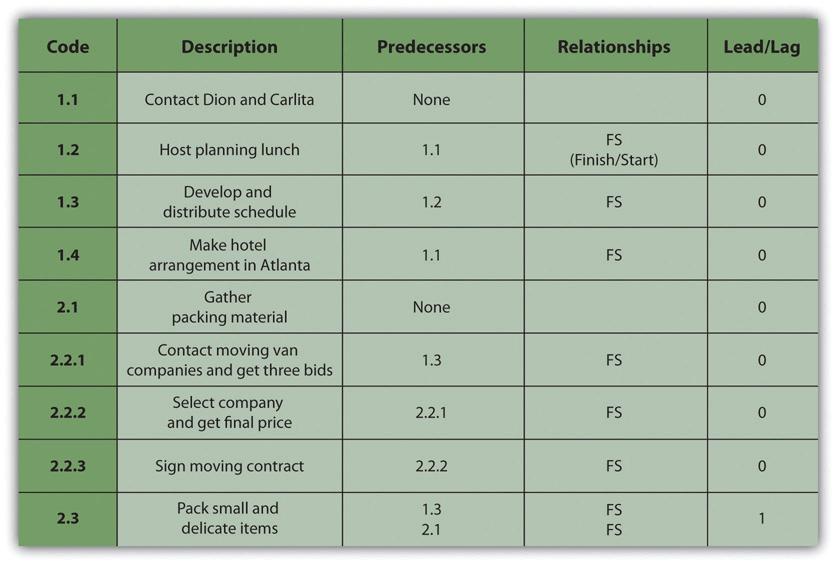
The characteristics and identifiers of an activity are its attributes. At this point in the process of analyzing John’s move, each activity has an identifying code, a short description, predecessors, and lead or lag times, as shown in a partial table of activities in Figure 8.7.
Figure 8.7 Table of Attributes
Milestones
Milestones are significant events in your project which consume no resources and have no duration. Milestones are usually indicated on the project schedule with a diamond and often have a vertical line on a time-scaled graph to show the relationship of various schedule paths to the milestone. An effective milestone schedule will capture the major constraints to the project schedule and provide a summary level overview of the project.
In our John’s move project, we might create a milestone called “all packing complete” to represent the date when everything is packed and ready for the moving van. Any delay in this date will mean a delay in the arrival of the moving van in Chicago, a delay in the arrival of the moving van in Atlanta, and a delay of all the unpacking and other downstream activities (see Figure 8.8, “Gantt Chart”).
GRAPHIC REPRESENTATIONS
Relationships between activities are easier to recognize if they are presented using graphics such as bar charts or a network of connected boxes.
Gantt Chart
The type of bar chart used to illustrate activity relationships in a project is the Gantt chart. The Gantt chart was developed by Henry Gantt and used on major projects, including building the Hoover Dam and the U.S. interstate highway system.2 The Gantt chart is a time-scaled graphic that represents each activity with a bar that reflects the duration, start, and finish time, as shown in Figure 8.8.
Figure 8.8 Gantt Chart
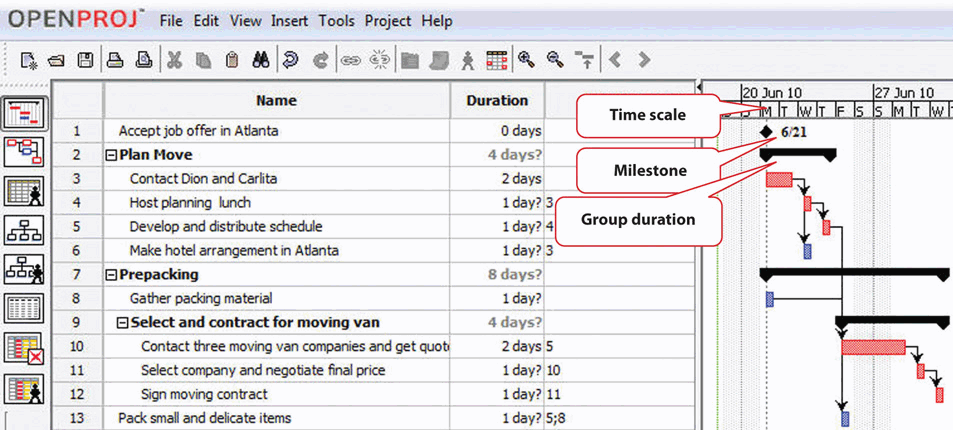
A Gantt chart is easy to read and provides sufficient information for project team members to plan activities within a short time frame. For many larger projects, a two-week bar chart, extracted from the larger master schedule, provides the information needed for team members and contractors to coordinate activity details. The Gantt chart provides information for simple planning but is limited because a Gantt chart does not illustrate complex relationships well.
Network Diagrams
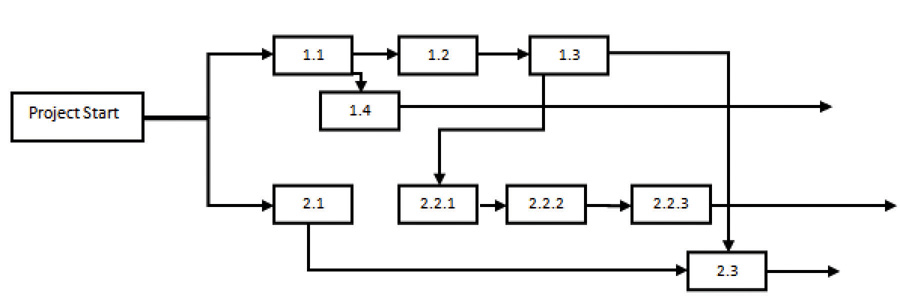
People recognize relationships and patterns more effectively when they look at diagrams like the one in Figure 8.9, “Project Network Diagram”. The precedence diagram method (PDM) is a technique for graphically displaying the logic of the schedule by placing the activities in boxes with arrows between them to show the precedence-successor relationships. The boxes in this type of diagram are called nodes and the arrows indicate finish-start relationships. Compare the diagram in Figure 8.9 to the outline in Figure 8.5, “Outline of Activities with Predecessors Identified” to see how much easier it is to trace a sequential path from one activity to the next in the precedence diagram. This type of diagram is also called a project network diagram.
Figure 8.9 Project Network Diagram
KEY TAKEAWAYS
- The work breakdown structure is a list of activities, including estimates of their durations, their relationships with others, and the resources assigned to them.
- Bar charts are used to indicate durations and sequencing where the relationships are simple. Network diagrams are used to show complex relationships between activities.
[1] Project Management Institute, Inc., A Guide to the Project Management Body of Knowledge (PMBOK Guide), 4th ed. (Newtown Square, PA: Project Management Institute, Inc., 2008), 129.
[2] Reference.com, “Henry Gantt,” http://www.reference.com/browse/wiki/Henry_Gantt (accessed July 27, 2009).
a list of activities, including estimates of their durations, their relationships with others, and the resources assigned to them.
Breaking the activity into smaller units and listing the tasks needed to accomplish that step.
How long will the project take to accomplish from beginning to end.
Time, materials, facilities, and equipment needed to accomplish the project.
An educated guess based on knowledge, experience, and inference.
The process of deriving conclusions based on assumptions.
The making of decisions based on a prejudged perspective.
A calendar that indicates which days they are available and which are days off to consider the availability of team members, consultants, and vendors.
The development of the activity sequence or determining the order in which the activities will be completed.
The relationship between a predecessor activity and a successor activity.
The successor activity starts after and is dependent on the predecessor activity.
Activities that have predecessor-successor relationships occur sequentially—one after the other.
When two or more project activities occur at the same time or concurrently.
Activities can start at different times but they must finish at the same time.
An account of time must go by before a successor activity can begin.
The successor activity can overlap the end of its predecessor activity and begin before the predecessor is finished.
The characteristics and identifiers of an activity.
Significant events in a project which consume no resources and have no duration.
Establishes key dates throughout the life of a project that must be met for the project to finish on time.
A type of bar chart used to illustrate activity relationships in a project. The Gantt chart was developed by Henry Gantt and used on major projects, including building the Hoover Dam and the U.S. interstate highway system.2 The Gantt chart is a time-scaled graphic that represents each activity with a bar that reflects the duration, start, and finish time.
A technique for graphically displaying the logic of the schedule by placing the activities in boxes with arrows between them to show the precedence-successor relationships. This type of diagram is also called a precedence diagram method (PDM).
A technique for graphically displaying the logic of the schedule by placing the activities in boxes with arrows between them to show the precedence-successor relationships. This type of diagram is also called a project network diagram.

