Chapter 13. Psychology in Our Social Lives
13.4 Prejudice, Discrimination, and Stereotyping
Susan T. Fiske
People are often biased against others outside of their own social group, showing prejudice (emotional bias), stereotypes (cognitive bias), and discrimination (behavioral bias). In the past, people used to be more explicit with their biases, but during the 20th century, when it became less socially acceptable to exhibit bias, such things like prejudice, stereotypes, and discrimination became more subtle (automatic, ambiguous, and ambivalent). In the 21st century, however, with social group categories even more complex, biases may be transforming once again.
Learning Objectives
- Distinguish prejudice, stereotypes, and discrimination.
- Distinguish old-fashioned, blatant biases from contemporary, subtle biases.
- Understand old-fashioned biases such as social dominance orientation and right-wing. authoritarianism.
- Understand subtle, unexamined biases that are automatic, ambiguous, and ambivalent.
- Understand 21st century biases that may break down as identities get more complicated.
Introduction

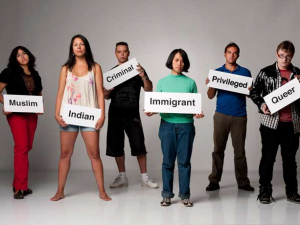
Even in one’s own family, everyone wants to be seen for who they are, not as “just another typical X.” But still, people put other people into groups, using that label to inform their evaluation of the person as a whole—a process that can result in serious consequences. This module focuses on biases against social groups, which social psychologists sort into emotional prejudices, mental stereotypes, and behavioral discrimination. These three aspects of bias are related, but they each can occur separately from the others (Dovidio & Gaertner, 2010; Fiske, 1998). For example, sometimes people have a negative, emotional reaction to a social group (prejudice) without knowing even the most superficial reasons to dislike them (stereotypes).
This module shows that today’s biases are not yesterday’s biases in many ways, but at the same time, they are troublingly similar. First, we’ll discuss old-fashioned biases that might have belonged to our grandparents and great-grandparents—or even the people nowadays who have yet to leave those wrongful times. Next, we will discuss late 20th century biases that affected our parents and still linger today. Finally, we will talk about today’s 21st century biases that challenge fairness and respect for all.
Old-fashioned Biases: Almost Gone
You would be hard pressed to find someone today who openly admits they don’t believe in equality. Regardless of one’s demographics, most people believe everyone is entitled to the same, natural rights. However, as much as we now collectively believe this, not too far back in our history, this ideal of equality was an unpracticed sentiment. Of all the countries in the world, only a few have equality in their constitution, and those who do, originally defined it for a select group of people.
At the time, old-fashioned biases were simple: people openly put down those not from their own group. For example, just 80 years ago, American college students unabashedly thought Turkish people were “cruel, very religious, and treacherous” (Katz & Braly, 1933). So where did they get those ideas, assuming that most of them had never met anyone from Turkey? Old-fashioned stereotypes were overt, unapologetic, and expected to be shared by others—what we now call “blatant biases.”
Blatant biases are conscious beliefs, feelings, and behavior that people are perfectly willing to admit, which mostly express hostility toward other groups (outgroups) while unduly favoring one’s own group (in-group). For example, organizations that preach contempt for other races (and praise for their own) is an example of a blatant bias. And scarily, these blatant biases tend to run in packs: People who openly hate one outgroup also hate many others. To illustrate this pattern, we turn to two personality scales next.
Social Dominance Orientation

Social dominance orientation (SDO) describes a belief that group hierarchies are inevitable in all societies and are even a good idea to maintain order and stability (Sidanius & Pratto, 1999). Those who score high on SDO believe that some groups are inherently better than others, and because of this, there is no such thing as group “equality.” At the same time, though, SDO is not just about being personally dominant and controlling of others; SDO describes a preferred arrangement of groups with some on top (preferably one’s own group) and some on the bottom. For example, someone high in SDO would likely be upset if someone from an outgroup moved into his or her neighborhood. It’s not that the person high in SDO wants to “control” what this outgroup member does; it’s that moving into this “nice neighborhood” disrupts the social hierarchy the person high in SDO believes in (i.e. living in a nice neighborhood denotes one’s place in the social hierarchy—a place reserved for one’s in-group members).
Although research has shown that people higher in SDO are more likely to be politically conservative, there are other traits that more strongly predict one’s SDO. For example, researchers have found that those who score higher on SDO are usually lower than average on tolerance, empathy, altruism, and community orientation. In general, those high in SDO have a strong belief in work ethic—that hard work always pays off and leisure is a waste of time. People higher on SDO tend to choose and thrive in occupations that maintain existing group hierarchies (police, prosecutors, business), compared to those lower in SDO, who tend to pick more equalizing occupations (social work, public defense, psychology).
The point is that SDO—a preference for inequality as normal and natural—also predicts endorsing the superiority of certain groups: men, native-born residents, heterosexuals, and believers in the dominant religion. This means seeing women, minorities, homosexuals, and non-believers as inferior. Understandably, the first list of groups tend to score higher on SDO, while the second group tends to score lower. For example, the SDO gender difference (men higher, women lower) appears all over the world.
At its heart, SDO rests on a fundamental belief that the world is tough and competitive with only a limited number of resources. Thus, those high in SDO see groups as battling each other for these resources, with winners at the top of the social hierarchy and losers at the bottom (see Table 13.1).

Right-wing Authoritarianism
Right-wing authoritarianism (RWA) focuses on value conflicts, whereas SDO focuses on the economic ones. That is, RWA endorses respect for obedience and authority in the service of group conformity (Altemeyer, 1988). Returning to an example from earlier, the homeowner who’s high in SDO may dislike the outgroup member moving into his or her neighborhood because it “threatens” one’s economic resources (e.g. lowering the value of one’s house; fewer openings in the school; etc.). Those high in RWA may equally dislike the outgroup member moving into the neighborhood but for different reasons. Here, it’s because this outgroup member brings in values or beliefs that the person high in RWA disagrees with, thus “threatening” the collective values of his or her group. RWA respects group unity over individual preferences, wanting to maintain group values in the face of differing opinions. Despite its name, though, RWA is not necessarily limited to people on the right (conservatives). Like SDO, there does appear to be an association between this personality scale (i.e. the preference for order, clarity, and conventional values) and conservative beliefs. However, regardless of political ideology, RWA focuses on groups’ competing frameworks of values. Extreme scores on RWA predict biases against outgroups while demanding in-group loyalty and conformity Notably, the combination of high RWA and high SDO predicts joining hate groups that openly endorse aggression against minority groups, immigrants, homosexuals, and believers in non-dominant religions (Altemeyer, 2004).
20th Century Biases: Subtle but Significant
Fortunately, old-fashioned biases have diminished over the 20th century and into the 21st century. Openly expressing prejudice is like blowing second-hand cigarette smoke in someone’s face: It’s just not done any more in most circles, and if it is, people are readily criticized for their behavior. Still, these biases exist in people; they’re just less in view than before. These subtle biases are unexamined and sometimes unconscious but real in their consequences. They are automatic, ambiguous, and ambivalent, but nonetheless biased, unfair, and disrespectful to the belief in equality.
Automatic Biases

Most people like themselves well enough, and most people identify themselves as members of certain groups but not others. Logic suggests, then, that because we like ourselves, we therefore like the groups we associate with more, whether those groups are our hometown, school, religion, gender, or ethnicity. Liking yourself and your groups is human nature. The larger issue, however, is that own-group preference often results in liking other groups less. And whether you recognize this “favoritism” as wrong, this trade-off is relatively automatic, that is, unintended, immediate, and irresistible.
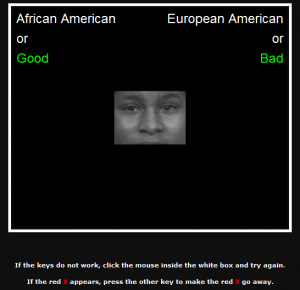
Social psychologists have developed several ways to measure this relatively automatic own-group preference, the most famous being the Implicit Association Test (IAT; Greenwald, Banaji, Rudman, Farnham, Nosek, & Mellott, 2002; Greenwald, McGhee, & Schwartz, 1998). The test itself is rather simple and you can experience it yourself if you Google “implicit” or go to understandingprejudice.org. Essentially, the IAT is done on the computer and measures how quickly you can sort words or pictures into different categories. For example, if you were asked to categorize “ice cream” as good or bad, you would quickly categorize it as good. However, imagine if every time you ate ice cream, you got a brain freeze. When it comes time to categorize ice cream as good or bad, you may still categorize it as “good,” but you will likely be a little slower in doing so compared to someone who has nothing but positive thoughts about ice cream. Related to group biases, people may explicitly claim they don’t discriminate against outgroups—and this is very likely true. However, when they’re given this computer task to categorize people from these outgroups, that automatic or unconscious hesitation (a result of having mixed evaluations about the outgroup) will show up in the test. And as countless studies have revealed, people are mostly faster at pairing their own group with good categories, compared to pairing others’ groups. In fact, this finding generally holds regardless if one’s group is measured according race, age, religion, nationality, and even temporary, insignificant memberships.
This all-too-human tendency would remain a mere interesting discovery except that people’s reaction time on the IAT predicts actual feelings about individuals from other groups, decisions about them, and behavior toward them, especially nonverbal behavior (Greenwald, Poehlman, Uhlmann, & Banaji, 2009). For example, although a job interviewer may not be “blatantly biased,” his or her “automatic or implicit biases” may result in unconsciously acting distant and indifferent, which can have devastating effects on the hopeful interviewee’s ability to perform well (Word, Zanna, & Cooper, 1973). Although this is unfair, sometimes the automatic associations—often driven by society’s stereotypes—trump our own, explicit values (Devine, 1989). And sadly, this can result in consequential discrimination, such as allocating fewer resources to disliked outgroups (Rudman & Ashmore, 2009). See Table 13.2 for a summary of this section and the next two sections on subtle biases.

Ambiguous Biases

As the IAT indicates, people’s biases often stem from the spontaneous tendency to favor their own, at the expense of the other. Social identity theory (Tajfel, Billig, Bundy, & Flament, 1971) describes this tendency to favor one’s own in-group over another’s outgroup. And as a result, outgroup disliking stems from this in-group liking (Brewer & Brown, 1998). For example, if two classes of children want to play on the same soccer field, the classes will come to dislike each other not because of any real, objectionable traits about the other group. The dislike originates from each class’s favoritism toward itself and the fact that only one group can play on the soccer field at a time. With this preferential perspective for one’s own group, people are not punishing the other one so much as neglecting it in favor of their own. However, to justify this preferential treatment, people will often exaggerate the differences between their in-group and the outgroup. In turn, people see the outgroup as more similar in personality than they are. This results in the perception that “they” really differ from us, and “they” are all alike. Spontaneously, people categorize people into groups just as we categorize furniture or food into one type or another. The difference is that we people inhabit categories ourselves, as self-categorization theory points out (Turner, 1975). Because the attributes of group categories can be either good or bad, we tend to favor the groups with people like us and incidentally disfavor the others. In-group favoritism is an ambiguous form of bias because it disfavors the outgroup by exclusion. For example, if a politician has to decide between funding one program or another, s/he may be more likely to give resources to the group that more closely represents his in-group. And this life-changing decision stems from the simple, natural human tendency to be more comfortable with people like yourself.
A specific case of comfort with the ingroup is called aversive racism, so-called because people do not like to admit their own racial biases to themselves or others (Dovidio & Gaertner, 2010). Tensions between, say, a White person’s own good intentions and discomfort with the perhaps novel situation of interacting closely with a Black person may cause the White person to feel uneasy, behave stiffly, or be distracted. As a result, the White person may give a good excuse to avoid the situation altogether and prevent any awkwardness that could have come from it. However, such a reaction will be ambiguous to both parties and hard to interpret. That is, was the White person right to avoid the situation so that neither person would feel uncomfortable? Indicators of aversive racism correlate with discriminatory behavior, despite being the ambiguous result of good intentions gone bad.
Bias Can Be Complicated – Ambivalent Biases
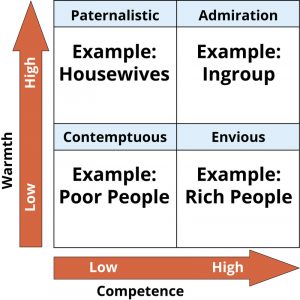
Not all stereotypes of outgroups are all bad. For example, ethnic Asians living in the United States are commonly referred to as the “model minority” because of their perceived success in areas such as education, income, and social stability. Another example includes people who feel benevolent toward traditional women but hostile toward nontraditional women. Or even ageist people who feel respect toward older adults but, at the same time, worry about the burden they place on public welfare programs. A simple way to understand these mixed feelings, across a variety of groups, results from the Stereotype Content Model (Fiske, Cuddy, & Glick, 2007).
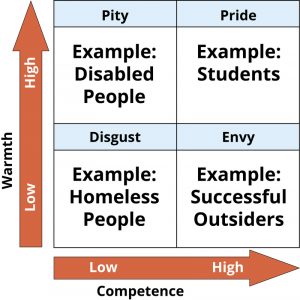
When people learn about a new group, they first want to know if its intentions of the people in this group are for good or ill. Like the guard at night: “Who goes there, friend or foe?” If the other group has good, cooperative intentions, we view them as warm and trustworthy and often consider them part of “our side.” However, if the other group is cold and competitive or full of exploiters, we often view them as a threat and treat them accordingly. After learning the group’s intentions, though, we also want to know whether they are competent enough to act on them (if they are incompetent, or unable, their intentions matter less). These two simple dimensions—warmth and competence—together map how groups relate to each other in society.

There are common stereotypes of people from all sorts of categories and occupations that lead them to be classified along these two dimensions. For example, a stereotypical “housewife” would be seen as high in warmth but lower in competence. This is not to suggest that actual housewives are not competent, of course, but that they are not widely admired for their competence in the same way as scientific pioneers, trendsetters, or captains of industry. At another end of the spectrum are homeless people and drug addicts, stereotyped as not having good intentions (perhaps exploitative for not trying to play by the rules), and likewise being incompetent (unable) to do anything useful. These groups reportedly make society more disgusted than any other groups do.
Some group stereotypes are mixed, high on one dimension and low on the other. Groups stereotyped as competent but not warm, for example, include rich people and outsiders good at business. These groups that are seen as “competent but cold” make people feel some envy, admitting that these others may have some talent but resenting them for not being “people like us.” The “model minority” stereotype mentioned earlier includes people with this excessive competence but deficient sociability.
The other mixed combination is high warmth but low competence. Groups who fit this combination include older people and disabled people. Others report pitying them, but only so long as they stay in their place. In an effort to combat this negative stereotype, disability- and elderly-rights activists try to eliminate that pity, hopefully gaining respect in the process.
Altogether, these four kinds of stereotypes and their associated emotional prejudices (pride, disgust, envy, pity) occur all over the world for each of society’s own groups. These maps of the group terrain predict specific types of discrimination for specific kinds of groups, underlining how bias is not exactly equal opportunity.

Conclusion: 21st Century Prejudices
As the world becomes more interconnected—more collaborations between countries, more intermarrying between different groups—more and more people are encountering greater diversity of others in everyday life. Just ask yourself if you’ve ever been asked, “What are you?” Such a question would be preposterous if you were only surrounded by members of your own group. Categories, then, are becoming more and more uncertain, unclear, volatile, and complex (Bodenhausen & Peery, 2009). People’s identities are multifaceted, intersecting across gender, race, class, age, region, and more. Identities are not so simple, but maybe as the 21st century unfurls, we will recognize each other by the content of our character instead of the cover on our outside.
Outside Resources
Web: Website exploring the causes and consequences of prejudice. http://www.understandingprejudice.org/
Discussion Questions
- Do you know more people from different kinds of social groups than your parents did?
- How often do you hear people criticizing groups without knowing anything about them?
- Take the IAT. Could you feel that some associations are easier than others?
- What groups illustrate ambivalent biases, seemingly competent but cold, or warm but incompetent?
- Do you or someone you know believe that group hierarchies are inevitable? Desirable?
- How can people learn to get along with people who seem different from them?
Image Attribution
Figure 13.21: caseorganic, https://goo.gl/PuLI4E, CC BY-NC 2.0, https://goo.gl/VnKlK8
Figure 13.22: Thomas Hawk, https://goo.gl/qWQ7jE, CC BY-NC 2.0, https://goo.gl/VnKlK8
Figure 13.23: Courtesy of Anthony Greenwald from Project Implicit
Figure 13.24: Keira McPhee, https://goo.gl/gkaKBe, CC BY 2.0, https://goo.gl/BRvSA7
References
Altemeyer, B. (2004). Highly dominating, highly authoritarian personalities. The Journal of Social Psychology, 144(4), 421-447. doi:10.3200/SOCP.144.4.421-448
Altemeyer, B. (1988). Enemies of freedom: Understanding right-wing authoritarianism. San Francisco: Jossey-Bass.
Bodenhausen, G. V., & Peery, D. (2009). Social categorization and stereotyping in vivo: The VUCA challenge. Social and Personality Psychology Compass, 3(2), 133-151. doi:10.1111/j.1751-9004.2009.00167.x
Brewer, M. B., & Brown, R. J. (1998). Intergroup relations. In D. T. Gilbert, S. T. Fiske, & G. Lindzey (Eds.), The handbook of social psychology, Vols. 1 and 2 (4th ed.) (pp. 554-594). New York: McGraw-Hill.
Devine, P. G. (1989). Stereotypes and prejudice: Their automatic and controlled components. Journal of Personality and Social Psychology, 56(1), 5-18. doi:10.1037/0022-3514.56.1.5
Dovidio, J. F., & Gaertner, S. L. (2010). Intergroup bias. In S. T. Fiske, D. T. Gilbert, & G. Lindzey (Eds.), Handbook of social psychology, Vol. 2 (5th ed.) (pp. 1084-1121). Hoboken, NJ: John Wiley.
Fiske, S. T. (1998). Stereotyping, prejudice, and discrimination. In D. T. Gilbert, S. T. Fiske, & G. Lindzey (Eds.), The handbook of social psychology, Vols. 1 and 2 (4th ed.) (pp. 357-411). New York: McGraw-Hill.
Fiske, S. T., Cuddy, A. J. C., & Glick, P. (2007). Universal dimensions of social cognition: Warmth and competence. Trends in Cognitive Sciences, 11(2), 77-83. doi:10.1016/j.tics.2006.11.005
Greenwald, A. G., Banaji, M. R., Rudman, L. A., Farnham, S. D., Nosek, B. A., & Mellott, D. S. (2002). A unified theory of implicit attitudes, stereotypes, self-esteem, and self-concept. Psychological Review, 109(1), 3-25. doi:10.1037/0033-295X.109.1.3
Greenwald, A. G., McGhee, D. E., & Schwartz, J. L. K. (1998). Measuring individual differences in implicit cognition: The implicit association test. Journal of Personality and Social Psychology, 74(6), 1464-1480. doi:10.1037/0022-3514.74.6.1464
Greenwald, A. G., Poehlman, T. A., Uhlmann, E. L., & Banaji, M. R. (2009). Understanding and using the Implicit Association Test: III. Meta-analysis of predictive validity. Journal of Personality and Social Psychology, 97(1), 17-41. doi:10.1037/a0015575
Katz, D., & Braly, K. (1933). Racial stereotypes of one hundred college students. The Journal of Abnormal and Social Psychology, 28(3), 280-290. doi:10.1037/h0074049
Rudman, L. A., & Ashmore, R. D. (2007). Discrimination and the implicit association test. Group Processes & Intergroup Relations, 10(3), 359-372. doi:10.1177/1368430207078696
Sidanius, J., & Pratto, F. (1999). Social dominance: An intergroup theory of social hierarchy and oppression. New York: Cambridge University Press.
Tajfel, H., Billig, M. G., Bundy, R. P., & Flament, C. (1971). Social categorization and intergroup behaviour. European Journal of Social Psychology, 1(2), 149-178. doi:10.1002/ejsp.2420010202
Turner, J. C. (1975). Social comparison and social identity: Some prospects for intergroup behaviour. European Journal of Social Psychology, 5(1), 5-34. doi:10.1002/ejsp.2420050102
Word, C. O., Zanna, M. P., & Cooper, J. (1974). The nonverbal mediation of self-fulfilling prophecies in interracial interaction. Journal of Experimental Social Psychology, 10(2), 109-120. doi:10.1016/0022-1031(74)90059-6

