
12 Module 12: Population, Urbanization and Environment

Learning Objectives
- Define the meaning of demographic measurements, such as fertility and mortality rates.
- Compare and contrast a variety of demographic theories, such as Malthusian, cornucopian, zero population growth, and demographic transition theories.
- Describe current population trends and patterns.
- Describe the process of urbanization in Canada.
- Explain the function of suburbs, exurbs, and concentric zones.
- Compare and contrast various sociological perspectives to urbanization.
- Apply the concept of carrying capacity to environmental concerns.
- Describe and discuss the challenges presented by pollution, garbage, e-waste, and toxic hazards.
- Describe climate change and its importance.
12.0 Introduction to Population, Urbanization, and the Environment

The Alberta tar sands (or bituminous sands) in the northeast of the province have been recognized as an important petroleum resource since the 19th century when the first extensive surveys were made. They cover about 140,000 square kilometres of boreal forest and muskeg, largely in the Athabasca River basin. The petroleum is in the form of crude bitumen, which is a dense, tar-like substance mixed with sand and clay. Extracting bitumen and heavy oils from the tar sands requires pit mining or surface mining; processing the ore with water, steam, and caustic soda; and storing the toxic by-products in tailings ponds. In 1967, when Suncor began the first intensive commercial development of the tar sands, oil was just over $3 a barrel and the high cost of production limited the rate at which the resource was developed. In 1967, Suncor was producing 15,000 barrels/day. When prices sometimes exceeded $100 a barrel, production was projected to increase from 2.3 million barrels/day in 2014 to in excess of 3.8 million barrels/day by 2023. Industry projected that eventually 9 million barrels of bitumen would be produced per day (Gosselin et al. 2010; Grant, Angen, and Dyer 2013). The collapse of global oil demand amidst the coronavirus pandemic in 2020, the increased influence of a global environmental movement and alternative sources of energy has placed the future of the Alberta tar sands in jeopardy.
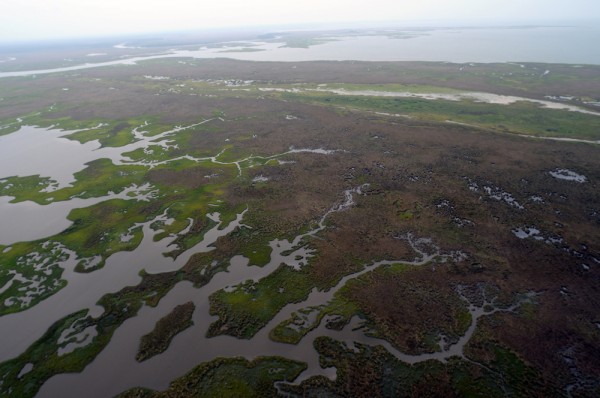
The controversy over developing the tar sands sets two competing logics against one another: environmental sustainability versus capital accumulation. Environmental sustainability is the degree to which a human activity can be sustained without damaging or undermining basic ecological support systems. Environmental critics of the tar sands development note that the process of bitumen extraction requires vast amounts of energy, fresh water, and land, while producing significant environmental impacts in the form of greenhouse gases, reduction in air quality, destruction of peat bogs and wetlands, and accumulation of toxic waste in tailings ponds (Grant, Angen, and Dyer 2013). There are also health impacts: local Indigenous groups have experienced a 30 percent greater risk of cancer over expected cancer rates since 1998 (Droitsch and Simieritsch 2010). These are factors in addition to the basic problem of sustainability—they involve human reliance on fossil fuels in the face of potentially catastrophic climate change.
On the other hand, Canada has a capitalist economy based on private investment and capital accumulation (although both the federal and provincial governments have invested in tar sands development at various times). Capital accumulation refers to the reinvestment of profit in order to increase capital assets (rather than for any specific social use). Since 1996 when capital investment exceeded $1 billion per year for the first time, investment has continued to increase reaching $4.2 billion/year in 2000 and $16 billion/year between 2006 and 2008. Net profits for the industry increased from $3.1 billion to $37.8 billion between 1998 and 2008. Over the same period, the number of people directly employed in tar sands operations rose from 6,000 to 12,000, not including spin-off jobs in construction and maintenance of facilities and other services. Royalties and other land-related payments to the government of Alberta were $3.8 billion in 2008 (Gosselin et al. 2010).
During this period when the price of oil was high, the tar sands boomed economically. Industry representatives argued that building refineries in Alberta to refine the raw bitumen rather than piping it to distant refineries would “overheat” the economy (i.e., create too many jobs). Some pointed to the “Dutch disease” effect of this economic development (i.e., that the artificially high petro-dollar was responsible for undermining other important sectors of the economy, notably manufacturing in Ontario and Quebec) (Stanford 2012), and others pointed to the problem of foreign ownership of Canadian resources (two-thirds of tar sands production is owned by foreign corporations) (De Souza 2012). The overall argument from the point of view of capital accumulation is that the benefits to the Canadian economy outweigh the drawbacks. However, the precarious nature of the oil export economy was revealed when the collapse of oil prices in 2014, like in 1986, and more recently in 2020 lead to a massive flight of capital investment out of Alberta (along with tens of thousands of layoffs and loss of tax royalties to the province). As oil is an export commodity whose price depends on the logic of market values, it is a fundamentally unstable source of capital accumulation. Various aspects of the controversies that surround the development of the Alberta tar sands are outlined below in the YouTube video, “Alberta: The End of Dirty Oil?”
12.0.1 How does sociological research help to understand and respond to these issues?
As the competing frameworks for understanding the Alberta tar sands illustrate, there are important societal issues connected to the environment and to how and where people live. Sociologists begin to examine these issues through demography, or the study of population dynamics, and urbanization, the study of the social, political, and economic relationships in cities. Environmental sociologists study how humans interact with their environments.
Today, as has been the case many times in history, we are at a point of conflict in a number of these areas. The world’s population has recently reached 7 billion. A mid-range estimate suggests it will reach 8 billion by 2025 (UN 2013). Can our planet sustain such a population? We generate more trash than ever, from Starbucks’ coffee cups to obsolete cell phones with toxic chemicals to food waste that could be composted. Where is it all going? Until it developed the Green Lane landfill site, the city of Toronto was sending up to 140 garbage trucks a day to Michigan State. When the Green Lane site is full in 2027 it is not clear where the trash will go (Hasham 2013). Cities and city living create new challenges for both society and the environment. These kinds of interactions between people and places are of critical importance.
How do sociologists study these issues? Functionalists note that one of the primary functions that any society needs to perform to ensure its survival is to adapt to the environment. According to Talcott Parsons’ AGIL schema, adaptation was the first of the primary “needs” that a society has to satisfy (1961). The economic system performs the function in human society of adapting to the natural environment to provide for human needs. In a functionalist analysis, when the norms of one system–like the economic system–become detached from or unresponsive to, the other systems (like the ecological system on which society depends), disequilibrium is felt throughout society. In the 1982 film Koyaanisqatsi, this point was illustrated by showing contrasting images of living in balance with nature with images of living out of balance with nature. The title Koyaanisqatsi is a Hopi Indian word meaning “life out of balance.” In the scenes depicting the lifestyle of the fast-paced, urban, consumer society, people pass by in fast motion like sausages on an assembly line. Not only is the economy unhinged from nature in this film, but individual life is shown to have lost meaningful connection with nature. One type of question that can be asked from a functionalist perspective is therefore: How can society be organized in a manner that restores balance with nature?
A critical sociologist will note that disequilibrium in a society’s relationship with the environment does not “just happen.” There are vested interests that promote unrestricted exploitation of natural resources for short-term private profit. Capitalism is a system in which non-economic values—community life, ecological values, long-term sustainability, etc.—have no role in economic calculations of returns on investment. From the critical sociology point of view, changes in the human/nature relationship have to be examined as outcomes of relations of power and patterns of capital investment. Environmental issues are therefore not distributed equally around the world. Changes in the global mode of production lead to the creation of unsustainable population increases, slum cities, and lax controls on toxic waste in some parts of the world, while in other parts of the world, people consume resources, throw away surplus, and contribute to the problem of global warming at rates that are equally unsustainable.
A symbolic interactionist interested in the day-to-day interaction of groups and individuals might research topics such as how attitudes toward the environment have changed, how individuals negotiate contradictory messages about industrial development and the environment, or how new practices in everyday life (e.g., recycling, smoking, bicycling, the “100-mile” diet, protest activities) emerge as a result of environmental concerns. One interesting question is how discredited theories that challenge research on global warming continue to circulate and produce doubt about the effects of greenhouse gases. Although the days are gone when a premier of Alberta can proclaim that climate science is a hoax, the divide between what is a publicly credible theory and what is not remains more a matter of symbolic interaction than pure science per se.
12.1 Demography and Population
We recently hit a population milestone of 7 billion humans on Earth’s surface. It took approximately 12 years to grow from 6 billion to 7 billion people (United Nations Population Fund 2011). In short, the planet is filling up. It is estimated we will we go from 7 billion to 8 billion by 2025. How will that population be distributed? Where is population the highest? Where is it slowing down? Where will people live? To explore these questions, we turn to demography, or the study of populations. Three of the most important components affecting the issues above are fertility, mortality, and migration.
The fertility rate of a society is a measure noting the number of children born. The fertility number is generally lower than the fecundity number, which measures the potential number of children that could be born to women of childbearing age. Sociologists measure fertility using the crude birthrate (the number of live births per 1,000 people per year); just as fertility measures childbearing, the mortality rate is a measure of the number of people who die. The crude death rate is a number derived from the number of deaths per 1,000 people per year. When analyzed together, fertility and mortality rates help researchers understand the overall growth occurring in a population.
Another key element in studying populations is the movement of people into and out of an area. This movement is called migration. Migration may take the form of immigration, which describes movement into an area to take up permanent residence, or emigration, which refers to movement out of an area to another place of permanent residence. Migration might be voluntary (as when university students study abroad), involuntary (as when Somalians left the drought and famine-stricken portion of their nation to stay in refugee camps), or forced (as when many First Nations were removed from the lands they had lived in for generations).
The growth rate of a population, or how much the population of defined area grows or shrinks in a specific time period, is therefore a function of the number of births and deaths as well as the number of people migrating to and from a country. It is calculated as the current population minus the initial population (at the beginning of the time period) divided by the initial population (then multiplied by 100).

12.1.1 Population Growth
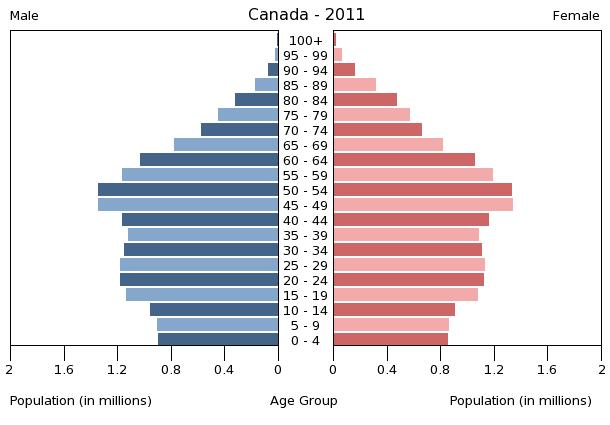
Changing fertility, mortality, and migration rates make up the total population composition, a snapshot of the demographic profile of a population. This number can be measured for societies, nations, world regions, or other groups. The population composition includes the sex ratio (the number of men for every hundred women) as well as the population pyramid (a picture of population distribution by sex and age).
| Country | Populations (in millions) | Fertility Rate | Mortality Rate | Sex Ration Male to Female |
|---|---|---|---|---|
| Afghanistan | 29.8 | 5.4% | 14.1% | 1.03 |
| Sweden | 9.1 | 1.9% | 9.5% | 0.98 |
| United States | 313.2 | 2.0% | 8.24% | 0.97 |
| Canada | 34.8 | 1.6% | 8.3% | 0.99 |
As Table 12.1 illustrates, countries vary greatly in fertility rates and mortality rates—the components that make up a population composition. Comparing these four countries reveals that in Afghanistan, there are more men than there are women, whereas the reverse is true in Canada, Sweden, and the United States. Afghanistan also has significantly higher fertility and mortality rates than any of the other three countries have. Do these statistics surprise you? How do you think the population makeup impacts the political climate and economics of the different countries? What factors lead to a sex ratio in which men outnumber women? The interaction between the demographic profile of a population and its internal dynamics is explored further in the TedEd YouTube video, “Population Pyramids: Powerful predictors of the future”.
12.1.2 Demographic Theories
Sociologists have long looked at population issues as central to understanding human interactions. Below we will look at four theories about population that inform sociological thought: Malthusian, zero population growth, cornucopian, and demographic transition theories.
Malthusian Theory
Thomas Malthus (1766–1834) was an English clergyman who made dire predictions about Earth’s ability to sustain its growing population. According to Malthusian theory, three factors would control human population that exceeded the earth’s carrying capacity, or how many people can live in a given area considering the amount of available resources. He identified these factors as war, famine, and disease (Malthus 1798). He termed these “positive checks” because they increased mortality rates, thus keeping the population in check, so to speak. These are countered by “preventive checks,” which also seek to control the population, but by reducing fertility rates; preventive checks include birth control and celibacy. Thinking practically, Malthus saw that people could only produce so much food in a given year, yet the population was increasing at an exponential rate. Eventually, he thought people would run out of food and begin to starve. They would go to war over the increasingly scarce resources, reduce the population to a manageable level, and the cycle would begin anew.
Of course, this has not exactly happened. The human population has continued to grow long past Malthus’s predictions. So what happened? Why did we not die off? There are three reasons that sociologists suggest we continue to expand the population of our planet. First, technological increases in food production have increased both the amount and quality of calories we can produce per person. Second, human ingenuity has developed new medicine to curtail death through disease. Finally, the development and widespread use of contraception and other forms of family planning have decreased the speed at which our population increases. But what about the future? Some still believe that Malthus was correct and that ample resources to support the Earth’s population will soon run out.
Zero Population Growth
A neo-Malthusian researcher named Paul Ehrlich brought Malthus’s predictions into the 20th century. However, according to Ehrlich, it is the environment, not specifically the food supply, that will play a crucial role in the continued health of planet’s population (Ehrlich 1968). His ideas suggest that the human population is moving rapidly toward complete environmental collapse, as privileged people use up or pollute a number of environmental resources, such as water and air. He advocated for a goal of zero population growth (ZPG), in which the number of people entering a population through birth or immigration is equal to the number of people leaving it via death or emigration. While support for this concept is mixed, it is still considered a possible solution to global overpopulation.
Cornucopian Theory
Of course, some theories are less focused on the pessimistic hypothesis that the world’s population will meet a detrimental challenge to sustaining itself. Cornucopian theory scoffs at the idea of humans wiping themselves out; it asserts that human ingenuity can resolve any environmental or social issues that develop. As an example, it points to the issue of food supply. If we need more food, the theory contends, agricultural scientists will figure out how to grow it, as they have already been doing for centuries. After all, in this perspective, human ingenuity has been up to the task for thousands of years and there is no reason for that pattern not to continue (Simon 1981).
Demographic and Epidemiological Transition Theory
Whether you believe that we are headed for environmental disaster and the end of human existence as we know it, or you think people will always adapt to changing circumstances, some sociologists argue there are clear patterns that can be seen in population growth. Modernization theorists argue that societies develop along a predictable continuum as they evolve from unindustrialized to postindustrial. Following this model, demographic transition theory (Caldwell and Caldwell 2006) suggests that future population growth will develop along a predictable four-stage model.
In Stage 1, birth, death, and infant mortality rates are all high, while life expectancy is short. An example of this stage is 19th century North America. As countries begin to industrialize, they enter Stage 2, where birth rates are higher while infant mortality and the death rates drop. Life expectancy also increases. Afghanistan is currently in this stage. Stage 3 occurs once a society is thoroughly industrialized; birth rates decline, while life expectancy continues to increase. Death rates continue to decrease. Mexico’s population is at this stage. In the final phase, Stage 4, we see the postindustrial era of a society. Birth and death rates are low, people are healthier and live longer, and society enters a phase of population stability. Overall population may even decline. Sweden and Canada are considered Stage 4. Details of the demographic and epidemiological transition theories are explore further in the following videos.
12.1.3 Current Population Trends
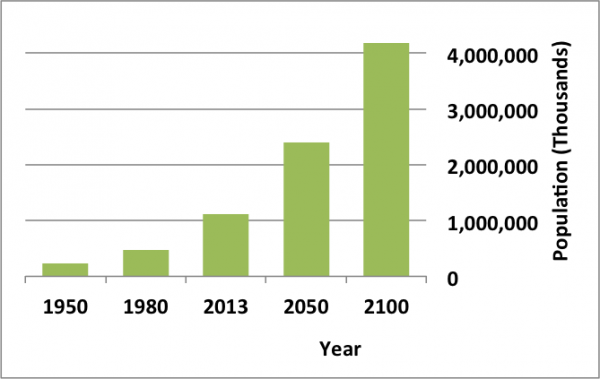
As mentioned earlier, the Earth’s population is 7 billion. That number might not seem particularly jarring on its own; after all, we all know there are lots of people around. But consider the fact that human population grew very slowly for most of our existence, then doubled in the span of half a century to reach 6 billion in 1999. And now, just over ten years later, we have added another billion. A look at the graph of projected population indicates that growth is not only going to continue, but it will continue at a rapid rate.
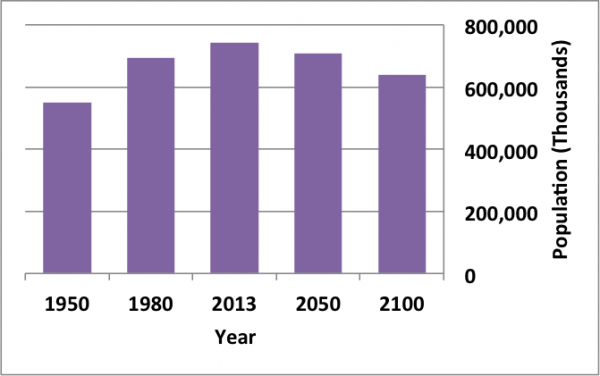
The United Nations Population Fund (2008) categorizes nations as high fertility, intermediate fertility, or low fertility. It anticipates the population growth to triple between 2011 and 2100 in high-fertility countries, which are currently concentrated in sub-Saharan Africa. For countries with intermediate fertility rates (the United States, India, and Mexico all fall into this category), growth is expected to be about 26 percent. And low-fertility countries like China, Australia, and most of those in Europe will actually see population declines of approximately 20 percent. Figures 20.5 and 20.6 illustrate this trend.
It would be impossible to discuss population growth and trends without addressing access to family planning resources and birth control. As the stages of population growth indicate, more industrialized countries see birth rates decline as families limit the number of children they have. Today, many people—over 200 million—still lack access to safe family planning, according to USAID (2010). By its report, this need is growing, with demand projected to increase by 40 percent in the next 15 years. Many social scholars would assert that until women are able to have only the children they want and can care for, the poorest countries would always bear the worst burden of overpopulation.
12.2 Urbanization

Urbanization is the study of the social, political, and economic relationships in cities, and someone specializing in urban sociology would study those relationships. In some ways, cities can be microcosms of universal human behaviour, while in others they provide a unique environment that yields their own brand of human behaviour. There is no strict dividing line between rural and urban; rather, there is a continuum where one bleeds into the other. However, once a geographically concentrated population has reached approximately 100,000 people, it typically behaves like a city regardless of what its designation might be.
12.2.1 The Growth of Cities
According to sociologist Gideon Sjoberg (1965), there are three prerequisites for the development of a city: First, good environment with fresh water and a favourable climate; second, advanced technology, which will produce a food surplus to support non-farmers; and third, strong social organization to ensure social stability and a stable economy. Most scholars agree that the first cities were developed somewhere in ancient Mesopotamia, though there are disagreements about exactly where. Most early cities were small by today’s standards, and the largest city around 100 CE was most likely Rome, with about 650,000 inhabitants (Chandler and Fox 1974). The factors limiting the size of ancient cities included lack of adequate sewage control, limited food supply, and immigration restrictions. For example, serfs were tied to the land, and transportation was limited and inefficient. Today, the primary influence on cities’ growth is economic forces.
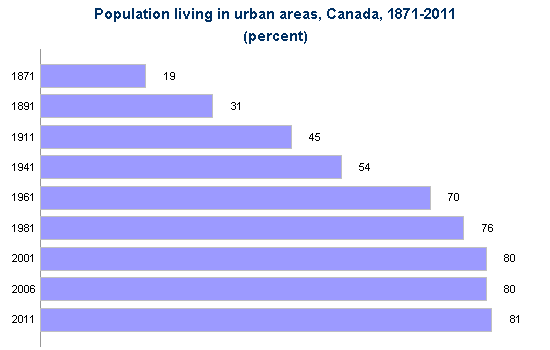
12.2.2 Urbanization in Canada
Urbanization in Canada proceeded rapidly during the Industrial Era of 1870 to 1920. This was the origin of the industrial city in Canada, a city in which the major business and employment activities revolve around manufacturing, building, machining. The percentage of Canadians living in cities went from 19 percent in 1871 to 49 percent in 1920 (Statistics Canada 2011). As more and more opportunities for work appeared in factories, workers left farms (and the rural communities that housed them) to move to the cities. Urban development in Canada in this period focused on Montreal and Toronto, which were the two major hubs of transportation, commerce, and industrial production in the country. These cities began to take on a modern industrial urban form with tall office towers downtown and a vast spatial expansion of suburbs surrounding them.

Following the Industrial Era, urbanization in Canada from the 1940s onward took the form of the corporate city. Stelter (1986) describes the corporate city as being more focused economically on corporate management and financial (and other related professional) services than industrial production. Five features define the form of corporate cities: dispersal of population in suburbs, high-rise apartment buildings, isolated industrial parks, downtown cores of office towers, and suburban shopping malls. This development was made possible by the reorientation of the city to automobile and truck use, deindustrialization and the rise of the service and knowledge economy, and a spatial decentralization of the population.
Finally we might note the transformation of the corporate city into a postmodern city form. Postmodern cities are defined by their orientation to circuits of global consumption, the fragmentation of previously homogeneous urban cultures, and the emergence of multiple centres or cores. John Hannigan (1998) describes three related developments that characterize the postmodern city: the edge city, dual city, and fantasy city. Edge cities are urban areas in suburbs or residential areas that have no central core or clear boundaries but form around clusters of shopping malls, entertainment complexes, and office towers at major transportation intersections. Dual cities are cities that are divided into wealthy, high-tech, information-based zones of urban development and poorer, run-down, marginalized zones of urban underdevelopment and informal economic activity. Mike Davis (1990) used the term “fortress city” to describe the way that cities abandon the commitment to creating viable public spaces and universal access to urban resources in favour of the privatization of public spaces, a “militarization” of private and public security services, and the creation of exclusive gated communities for the wealthy and middle classes. Fantasy cities are cities that choose to transform themselves into Disneyland-like “theme parks” or sites of mega-events (like the Olympics or FIFA World Cup competitions) to draw international tourists. Victoria, B.C., for example, has branded itself as a safe, historical—“more English than the English”—heritage destination for cruise ship and other types of tourism.
Suburbs and Exurbs
As cities grew more crowded, and often more impoverished and costly, more and more people began to migrate back out of them; but instead of returning to rural small towns (like they had resided in before moving to the city), these people needed close access to the cities for their jobs. In the 1850s, as the urban population greatly expanded and transportation options improved, suburbs developed. Suburbs are the communities surrounding cities, typically close enough for a daily commute in, but far enough away to allow for more space than city living affords. The bucolic suburban landscape of the early 20th century has largely disappeared due to sprawl. Suburban sprawl contributes to traffic congestion, which in turn contributes to commuting time. Commuting times and distances have continued to increase as new suburbs developed farther and farther from city centres. Simultaneously, this dynamic contributed to an exponential increase in natural resource use, like petroleum, which sequentially increased pollution in the form of carbon emissions.
In Canada, most consider the suburbs home to upper- and middle-class people with private homes. In other countries, like France, the suburbs––or “banlieues”–– are synonymous with housing projects and impoverished communities. In fact, the banlieues of Paris are notorious for their ethnic violence and crime, with higher unemployment and more residents living in poverty than in the city centre. Further, the banlieues have a much higher immigrant population, which in Paris is mostly Arabic and African immigrants. This contradicts the clichéd Canadian image of a typical white-picket-fence suburb.
As the suburbs became more crowded and lost their charm, those who could afford it turned to the exurbs, communities that exist outside the ring of suburbs. Exurbs are typically populated by even wealthier families who want more space and have the resources to lengthen their commute. It is interesting to note that unlike U.S. cities, Canadian cities have always retained a fairly large elite residential presence in enclaves around the city centres, a pattern that has been augmented in recent decades by patterns of inner-city resettlement by elites (Caulfield 1994; Keil and Kipfer 2003). As cities evolve from industrial to postindustrial, this practice of gentrification becomes more common. Gentrification refers to members of the middle and upper classes entering city areas that have been historically less affluent and renovating properties while the poor urban underclass are forced by resulting price pressures to leave those neighbourhoods. This practice is widespread and the lower class is pushed into increasingly decaying portions of the city.
Together, the city centres, suburbs, exurbs, and metropolitan areas all combine to form a metropolis. New York was the first North American megalopolis, a huge urban corridor encompassing multiple cities and their surrounding suburbs. The Toronto-Hamilton-Oshawa, Vancouver-Abbotsford-Chilliwack, and Calgary-Edmonton corridors are similar megalopolis formations. These metropolises use vast quantities of natural resources and are a growing part of the North American landscape.
12.2.3 Urbanization around the World
As was the case in North America, other urban centres experienced a growth spurt during the Industrial Era. In 1800, the only city in the world with a population over 1 million was Beijing, but by 1900, there were 16 cities with a population over 1 million (United Nations 2008). The development of factories brought people from rural to urban areas, and new technology increased the efficiency of transportation, food production, and food preservation. For example, from the mid-1670s to the early 1900s, London increased its population from 550,000 to 7 million (Old Bailey Proceedings Online 2011). The growth in global urbanization in the 20th and 21st centuries is following the blueprint of North American cities, but is occurring much more quickly and at larger scales, especially in peripheral and semi-peripheral countries. Shanghai almost tripled its population from 7.8 million to 20.2 million between 1990 and 2011, adding the equivalent of the population of New York City in 20 years. It is projected to reach 28.4 million by 2025, third in size behind Tokyo (38.7 million) and New Delhi (32.9 million) (United Nations 2012).
Global urbanization reached the 50 percent mark in 2008, meaning that more than half of the global population was living in cities compared to only 30 percent 50 years ago (United Nations 2008). Global urbanization has been uneven between core countries and the rest of the world, however. Two developments might serve to illustrate some of the stark differences in the global experience of urbanization: the formation of slum cities and global cities.
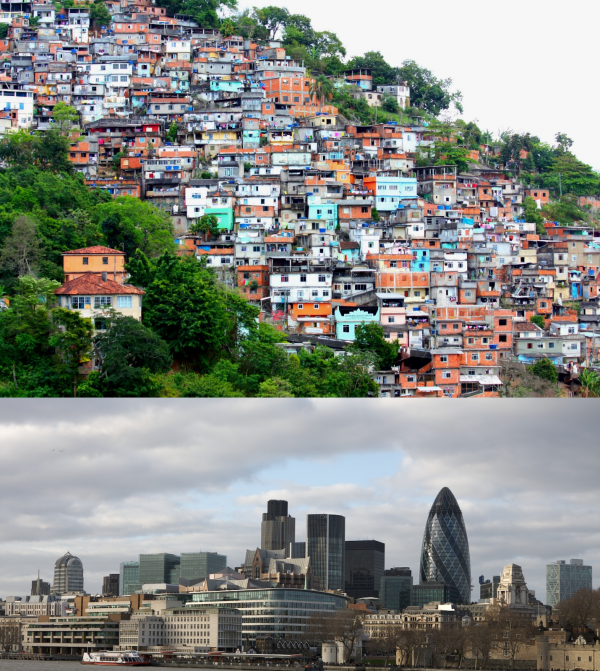
Slum cities refer to the development on the outskirts of cities of unplanned shantytowns or squats with no access to clean water, sanitation, or other municipal services. These slums exist largely outside the rule of law and have become centres for child labour, prostitution, criminal activities, and struggles between gangs and paramilitary forces for control. Mike Davis (2006) estimates that there are 200,000 slum cities worldwide including Quarantina in Beirut, the Favéla in Rio de Janeiro, the “City of the Dead” in Cairo, and Santa Cruz Meyehualco in Mexico City. He notes that while slum residents constitute only 6 percent of the urban population in developed countries, they constitute 78.2 percent of city dwellers in semi-peripheral countries. In Davis’s analysis, neoliberal restructuring and the Structural Adjustment Programs of the World Bank and the International Monetary Fund (IMF) are largely responsible for the creation of the informal economy and the withdrawal of the state from urban planning and the provision of services. As a result, slum cities have become the blueprint for urban development in the developing world.
On the other side of the phenomenon of global urbanization are global cities like London, New York, and Tokyo. Saskia Sassen (2001) describes the global city as a unique development based on the new role of cities in the circuits of global information and global capital circulation and accumulation. Global cities become centres for financial and corporate services, providing a technical and information infrastructure and a pool of human resources (skills, professional and technical services, consulting services, etc.) to service the increasingly complex operations of global corporations. As such, they are progressively detached, economically and socially, from their local and national political-geographic contexts. They become instead nodes in a global network of informational, economic, and financial transactions or flows. It becomes possible in this sense to say that New York is closer to Tokyo and London in terms of the number of direct transactions between them than it is to Philadelphia or Baltimore.
Sassen (2005) emphasizes three important tendencies that develop from the formation of global cities: a concentration of wealth in the corporate sectors of these cities, a growing disconnection between the cities and their immediate geographic regions, and the development of a large marginalized population that is excluded from the job market for these high-end activities. The increasing number of global cities:
- Host the headquarters of multinational corporations, such as Coca-Cola
- Exercise significant international political influence, such as that from Beijing or Berlin
- Host the headquarters of international nongovernmental organizations (NGOs), such as the United Nations
- Host influential media, such as the BBC and Al Jazeera
- Host advanced communication and transportation infrastructure, such as that in Shanghai (Sassen 2001)
https://www.youtube.com/watch?v=p4zM3C1gLrI&feature=emb_logo
12.2.4 Theoretical Perspectives on Urbanization
As the examples above illustrate, the issues of urbanization play significant roles in the study of sociology. Race, economics, and human behaviour intersect in cities. We can look at urbanization through the sociological perspectives of functionalism and conflict theory. Functional perspectives on urbanization focus generally on the ecology of the city, while conflict perspective tends to focus on political economy.
Human ecology is a functionalist field of study that focuses on the relationship between people and their built and natural physical environments (Park 1915). According to this Chicago School approach, urban land use and urban population distribution occurs in a predictable pattern once we understand how people relate to their living environment. For example, in Canada, we have a transportation system geared to accommodate individuals and families in the form of interprovincial highways built for cars. In contrast, most parts of Europe emphasize public transportation such as high-speed rail and commuter lines, as well as walking and bicycling. The challenge for a human ecologist working in Canadian urban planning would be to design landscapes and waterscapes with natural beauty, while also figuring out how to provide for free-flowing transport of innumerable vehicles—not to mention parking!
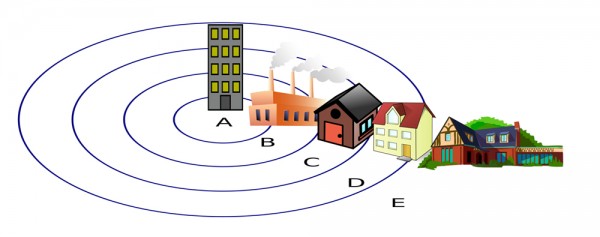
The concentric zone model (Burgess 1925) is perhaps the most famous example of human ecology. This model views a city as a series of concentric circular areas, expanding outward from the centre of the city, with various “zones” invading (new categories of people and businesses overrun the edges of nearby zones) and succeeding adjacent zones (after invasion, the new inhabitants repurpose the areas they have invaded and push out the previous inhabitants). In this model, Zone A, in the heart of the city, is the centre of the business and cultural district. Zone B, the concentric circle surrounding the city centre, is composed of formerly wealthy homes split into cheap apartments for new immigrant populations; this zone also houses small manufacturers, pawnshops, and other marginal businesses. Zone C consists of the homes of the working class and established ethnic enclaves. Zone D consists of wealthy homes, white-collar workers, and shopping centres. Zone E contains the estates of the upper class (exurbs) and the suburbs.
In contrast to the functionalist approach, the critical perspective focuses on the dynamics of power and influence in the shaping of the city. One way to do this is to examine how urban areas change according to specific decisions made by political and economic leaders. Cities are not so much the product of a quasi-natural “ecological” unfolding of social differentiation and succession, but of a dynamic of capital investment and disinvestment. City space is acted on primarily as a commodity that is bought and sold for profit. The dynamics of city development are better understood therefore as products of what Logan and Molotch (1987) call “growth coalitions”—coalitions of politicians, real estate investors, corporations, property owners, urban planners, architects, sports teams, cultural institutions, etc.—who work together to attract private capital to the city and lobby government for subsidies and tax breaks for investors. These coalitions generally benefit business interests and the middle and upper classes while marginalizing the interests of working and lower classes.
For example, sociologists Feagin and Parker (1990) suggested three aspects to understanding how political and economic leaders control urban growth. First, economic and political leaders work alongside each other to effect change in urban growth and decline, determining where money flows and how land use is regulated. Second, exchange value and use value are balanced to favour the middle and upper classes so that, for example, public land in poor neighbourhoods may be rezoned for use as industrial land. Finally, urban development is dependent on both structure (groups such as local government) and agency (individuals including business people and activists), and these groups engage in a push-pull dynamic that determines where and how land is actually used. For example, NIMBY (not in my backyard) movements are more likely to emerge in middle- and upper-class neighbourhoods, so these groups have more control over the usage of local land.
At the micro-level of interaction, sociologists have been interested in how human interaction is affected by living in cities. In his famous study “The Metropolis and Mental Life,” Simmel described how the built environment and the sheer size and anonymity of the modern city had become a social form, which he called the “metropolitan way of life.” Although the metropolis, its architecture, and the variety of ways of life it contained were products of human creation and expression, as an entity it confronted the individual as a kind of overwhelming monstrosity that threatened to swallow him or her up in its “social-technological mechanism” (Simmel 1903). As a means of self-protection against the city’s overpowering sensory input, people cut themselves off from potentially enriching contact with others and become cold, callous, indifferent, impatient, and blasé.
12.3 The Environment and Society
The subfield of environmental sociology studies how humans interact with their environments. This field is closely related to human ecology, which focuses on the relationship between people and their built and natural environment. This area is garnering more attention as extreme weather patterns and policy battles over climate change dominate the news. The primary point of analysis has to do with the ways in which human activity transforms the natural environment and human interactions with other species. Two key concepts in environmental sociology are the concepts of carrying capacity, which refers to the maximum amount of life that can be sustained within a given area, and the commons, which refers to the collective resources that humans share in common. These collective resources are typically shared natural resources like air, water, plant and animal life, or ecosystems that have remained outside of private ownership or processes of commodification and trade.
In an environmental context, the carrying capacity of different environments depends on the commons to the degree that the commons are necessary for sustaining life. When the commons are threatened through pollution or over-exploitation the carrying capacity of the environment is degraded. While both concepts can refer to local grazing lands or to rivers, they can also be applied to the Earth as a whole. Climate change is a global issue in which the degradation of the global commons through ecologically unsustainable human activities threatens the earth’s carrying capacity as a whole.
You might have heard the expression “the tragedy of the commons.” In 1968, an article of the same title written by Garrett Hardin describes how a common pasture is ruined by overgrazing. In England, “the commons” referred to land that the community held in common. Hardin was not the first to notice the phenomenon. Back in the 1800s, Oxford economist William Forster Lloyd looked at the devastated public grazing commons and the unhealthy cattle subject to such limited grazing, and saw, in essence, that the carrying capacity of the commons had been exceeded. However, since no one held responsibility for the land (as it was open to all), no one was willing to make sacrifices to improve it. This is a classical problem of the collective outcome of individual “rational” choices. If each user makes a rational choice by weighing their individual costs and benefits with respect to the use of common resources, the collective outcome ultimately undermines each user’s ability to benefit from the common resource. Their rational choices have an irrational outcome. Cattle grazers benefited from adding more cattle to their herd, but they did not have to take on the responsibility of the destroyed lands that were being damaged by overgrazing. So there was an incentive for them to add more head of cattle, and no incentive for restraint.
Satellite photos of Africa taken in the 1970s showed this practice to dramatic effect. The images depicted a dark irregular area over 300 miles around. When seen from above, there was a large fenced area, where plenty of grass was growing. Outside the fence, the ground was bare and devastated. The reason was simple: the fenced land was privately owned by informed farmers who carefully rotated their grazing animals and allowed the fields to lie fallow periodically. Outside the fence was land used by nomads. The nomads, like the herdsmen in 1800s Oxford, increased their heads of cattle without planning for its impact on the greater good. The soil eroded, the plants died, then the cattle died, and, ultimately, some of the people died.
How does this affect those of us who do not need to graze our cattle? Well, like the cows, we all need food, water, and clean air to survive. With the increasing consumption of resources in the West, increasing world population, and the ever-larger megalopolises with tens of millions of people, the limit of Earth’s carrying capacity is called into question. Earth’s carrying capacity is in itself the global commons. As in the tragedy of the commons Hardin described for the pasturelands of England, each economic and state actor in the world has an interest in maximizing its own economic benefit from exploiting the environment with little compelling incentive to conserve it in the global interest. Whether for cattle or humans, when too many take with too little thought to the rest of the population, the result is usually tragedy.
12.3.1 Pollution
Pollution describes the introduction of contaminants into an environment (water, air, land) at levels that are damaging. Directly related to carrying capacity, environments can often sustain a limited amount of contaminants without marked change, and water, air, and soil can “heal” themselves to a certain degree. However, once contaminant levels reach a certain point, the results can be catastrophic.
Water
Look at your watch. Wait 15 seconds. Then another 15. In that time, two children have died from lack of access to clean drinking water. Access to safe water is one of the most basic human needs, and it is woefully out of reach for millions of people on the planet. Many of the major diseases that peripheral countries battle, such as diarrhea, cholera, and typhoid, are caused by contaminated water. Often, young children are unable to go to school because they must instead walk several hours a day just to collect potable water for their family. The situation is only getting more dire as the global population increases. Water is a key scarce resource in the 21st century.
As every child learns in school, 70 percent of Earth is made of water. Despite that figure, there is a finite amount of water useable by humans and it is constantly used and reused in a sustainable water cycle. The way that humans use this abundant natural resource, however, renders much of it unsuitable for consumption and unable to sustain life. For instance, it takes two and a half litres of water to produce a single litre of Coca-Cola. The company and its bottlers use close to 300 billion litres of water a year, often in locales that are short of useable water (Blanchard 2007). Industrial processes like tars sands extraction (discussed above) use vast amounts of water that is not returned to the natural cycle.
As a consequence of population concentrations, water close to human settlements is frequently polluted with untreated or partially treated human waste (sewage), chemicals, radioactivity, and levels of heat sufficient to create large “dead zones” incapable of supporting aquatic life. The methods of food production used by many core nations rely on liberal doses of nitrogen and pesticides, which end up back in the water supply. In some cases, water pollution affects the quality of the aquatic life consumed by water and land animals. As we move along the food chain, the pollutants travel from prey to predator. Since humans consume at all levels of the food chain, we ultimately consume the carcinogens, such as mercury, accumulated through several branches of the food web.
Soil
Steinbeck’s 1930 tale of the Joads, driven out of their home by the Dust Bowl in The Grapes of Wrath, is still playing out today. In China, as in Depression-era Oklahoma, over-tilling soil in an attempt to expand agriculture has resulted in the disappearance of large patches of topsoil.
Soil erosion and desertification are just two of the many forms of soil pollution. In addition, all of the chemicals and pollutants that harm our water supplies can also leach into soil with similar effects. Brown zones where nothing can grow are common results of soil pollution. One demand of the population boom on the planet is an attendant requirement for more food to be produced. The so-called Green Revolution in the 1960s saw chemists and world aid organizations working together to bring modern farming methods, complete with pesticides, to peripheral and semi-peripheral countries. The immediate result was positive: food yields went up and burgeoning populations were fed. But as time has gone on, these areas have fallen into even more difficult straits as the damage done by modern methods leave traditional farmers with less than they had to start.
Dredging certain beaches in an attempt to maintain valuable beachfront property from coastal erosion has resulted in greater storm impact on shorelines, and damage to beach ecosystems (Turneffe Atoll Trust 2008). The results of these dredging projects have damaged reefs, sea grass beds, and shorelines, and can kill off large swaths of marine life. Ultimately, this damage threatens local fisheries, tourism, and other parts of the local economy.
Garbage
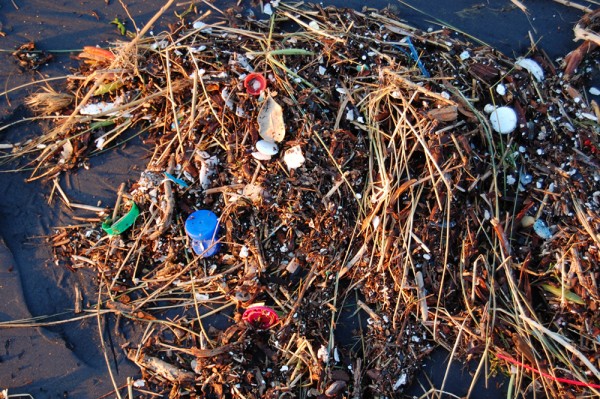
Where is your last cell phone? What about the one before that? Or the huge old television set your family had before flat screens became popular? For most of us, the answer is a sheepish shrug. In several provinces, there are product stewardship programs that oblige manufacturers and retailers to pay a per-item fee to fund electronic recycling (Fishlock 2011), but it is not always clear what happens to the items after they are recycled. As individuals, we do not pay attention to the demise of old items, and since electronics drop in price and increase in innovation at an incredible clip, we have been trained by their manufacturers to upgrade frequently.
Garbage creation and control are major issues for most core and industrializing nations, quickly becoming one of the most critical environmental issues faced in North America. North Americans buy products, use them, and then throw them away. When you put your garbage out in the trash can where does it go after that?
There are two primary means of waste disposal in Canada: landfill and incineration. When it comes to dangerous toxins, neither is a good choice. In the case of more innocuous trash, the synthetic Styrofoam and plastics that many of us use every day do not dissolve in a natural way. Burn them, and they release carcinogens into the air. Their improper (intentional or not) incineration adds to air pollution and increases smog. Dump them in landfills, and they do not decompose. As landfill sites fill up, we risk an increase in groundwater contamination.
Electronic waste, or e-waste, is one of the fastest growing segments of garbage. And it is far more problematic than even the mountains of broken plastic and rusty metal that plague the environment. E-waste is the name for obsolete, broken, and worn-out electronics—from computers to mobile phones to televisions. The challenge is that these products, which are multiplying at alarming rates thanks in part to planned obsolescence (designing products to quickly become outdated and then replaced by the constant emergence of newer and cheaper electronics), have toxic chemicals and precious metals in them, which makes for a dangerous combination.
So where do they go? Many companies ship their e-waste to developing nations in Africa and Asia to be “recycled.” While they are, in some senses, recycled, the result is not exactly clean. In fact, it is one of the dirtiest jobs around. Overseas, without the benefit of environmental regulation, e-waste dumps become a kind of boomtown for entrepreneurs willing to sort through endless stacks of broken-down electronics for tiny bits of valuable copper, silver, and other precious metals. Unfortunately, in their hunt, these workers are exposed to deadly toxins.
Governments are beginning to take notice of the impending disaster, and the European Union and Canadian provinces have put stricter regulations in place. These regulations both limit the amount of toxins allowed in electronics and address the issue of end-of-life recycling. But not surprisingly, corporations, while insisting they are greening their process, often fight stricter regulations. Meanwhile, many environmental groups, including the activist group Greenpeace, have taken up the cause. Greenpeace states that it is working to get companies to:
- Measure and reduce emissions with energy efficiency, renewable energy, and energy policy advocacy
- Make greener, efficient, longer-lasting products that are free of hazardous substance
- Reduce environmental impacts throughout company operations, from materials and energy used to make products right through to global take-back programs for old products (Greenpeace 2011)
Greenpeace produces annual ratings of how well companies are meeting these goals so that consumers can see how brands stack up. For instance, Apple moved up five spots since the 2010 report. Hopefully, consumers will vote with their wallets, and the greener companies will be rewarded.
Air
China’s fast-growing economy and burgeoning industry have translated into notoriously poor air quality. Smog hangs heavily over the major cities, sometimes grounding aircraft that cannot navigate through it. Pedestrians and cyclists wear masks to protect themselves. In Beijing, citizens are skeptical that the government-issued daily pollution ratings are trustworthy. Increasingly, they are taking their own pollution measurements in the hopes that accurate information will galvanize others to action. Given that some days they can barely see down the street, they hope that action comes soon (Papenfuss 2011).
Humanity, with its growing population, use of fossil fuels, and increasingly urbanized society, is putting too much stress on Earth’s atmosphere. The amount of air pollution varies from locale to locale, and you may be more personally affected than you realize. Along with breathing in oxygen, most of the time we are also breathe in soot, hydrocarbons, carbon, nitrogen, and sulfur oxides. Ground-level ozone (O3), which is associated with eye irritation, respiratory problems, and heart diseases, is a colourless gas that forms when nitrous oxides and volatile organic compounds from engine exhaust and industrial processes combine in sunlight. Approximately 5,000 people a year die prematurely in Canada due to air pollution (Office of the Auditor General of Canada 2007) and more than half of all Canadians live in areas where ground-level ozone during the summer smog season reaches unacceptable levels (Duncan et al. 1998). Much of the smog in Canada is the product of coal-fired electrical generation stations and industries south of the border. The nitrous oxides and other contaminants drift north with the prevailing winds. The hot and stagnant summers in the Windsor-to-Quebec-City corridor are unfortunately ideal for the creation of ground-level ozone.
Much of the pollution in the air comes from human activity. How many university students move their cars across campus at least once a day? Vancouver and the lower Fraser Valley have the dubious distinction of having the highest per capita car ownership in Canada. Eighty percent of the ground-level ozone in this area comes from automobile exhaust (Vincent and Fick 2000). The volatile organic compounds in the air come from vehicles, printing and surface coating, solvents, and other industrial processes (Ontario Ministry of the Environment and Climate Change 2010). Who checks the environmental report card on how many pollutants each company throws into the air before purchasing a cell phone? Many of us are guilty of taking our environment for granted without concern for how everyday decisions add up to a long-term global problem. How many minor adjustments can you think of, like walking instead of driving, that would reduce your overall carbon footprint?
Remember the example of the “tragedy of the commons.” Each of us is affected by air pollution. But like the herder who adds one more head of cattle to realize the benefits of owning more cows, but who does not have to pay the price of the overgrazed land, we take the benefit of driving or buying the latest cell phones without worrying about the end result. Air pollution accumulates in the body, much like the effects of smoking cigarettes accumulate over time, leading to more chronic-illnesses. And in addition to directly affecting human health, air pollution affects crop quality as well as heating and cooling costs. In other words, we all pay a lot more than the price at the pump when we fill up our tank with gas.
Toxic and Radioactive Waste
While nuclear energy promises a safe and abundant power source, increasingly it is looked upon as a danger to the environment and those who inhabit it. The meltdown of three nuclear reactors in Fukushima, Japan, in 2011 resulted in the release of substantial amounts of radioactive material into the environment. It is estimated that cleanup will take decades. In addition to the problems of accidental meltdown, regular operation of nuclear power plants leads to the accumulation of nuclear waste, which we must then keep track of long term. This leads to the problem of how to store the toxic waste material without damaging the environment or putting future generations at risk.
The 2011 earthquake in Japan illustrates the dangers of even safe, government-monitored nuclear energy. When disaster occurs, how can we safely evacuate the large numbers of affected people? Indeed, how can we even be sure how far the evacuation radius should extend? Radiation can also enter the food chain, causing damage from the bottom (phytoplankton and microscopic soil organisms) all the way to the top. Once again, the price paid for power is much greater than what is seen on the electric bill.
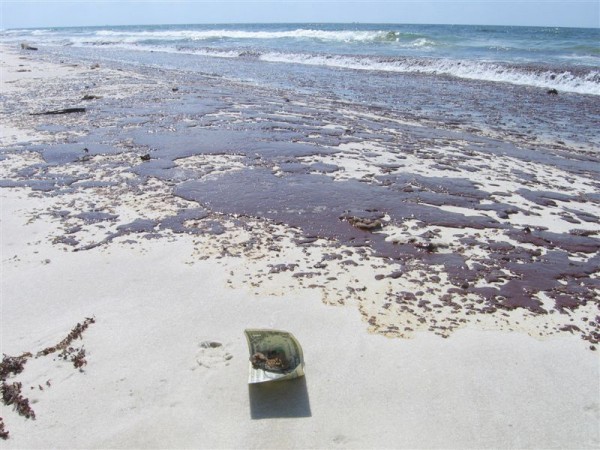
The enormous oil disaster that hit the Louisiana Gulf Coast is just one of a frighteningly high number of environmental crises that have led to toxic residue. From the Exxon Valdez oil tanker crash of 1989 to the Enbridge pipeline spill in the Kalamazoo River in 2010, from the Chernobyl disaster of 1986 to Japan’s Fukushima nuclear plant incident in 2011—the list goes on. Often, the stories are not newsmakers, but simply an unpleasant part of life for the people who live near toxic sites such as in the stories of Fort Chipweyan, Alberta, and Hinkley, California. In many cases, people in these neighbourhoods can be part of a cancer cluster without realizing the cause.
12.3.2 Climate Change
World systems analysis suggests that core nations (like the United States and those of western Europe) were historically the greatest source of greenhouse gases, but have now evolved into postindustrial societies. Now that semi-peripheral and peripheral nations are industrializing, the core nations wish to enact strict protocols regarding the causes of global warming (since their economies are no longer so dependent on greenhouse-gas-causing industries). However, the semi-peripheral and peripheral nations rightly point out that they only want the same economic chance to evolve their economies, and since they were unduly affected by the progress of core nations, if the core nations now insist on “green” policies, they should pay offsets or subsidies of some kind. There are no easy answers to this conflict. It may well not be “fair” that the core nations benefited from ignorance during their industrial boom. But with China leading the way as a top greenhouse gas emitter, it matters less to the planet whether they get their fair shake at polluting. The international community continues to work toward a way to manage climate change. The Durban Talks that concluded in December 2011 point to a willingness by both core countries and peripheral nations to move toward a legally binding instrument for all countries (World Resources Institute 2011).
Climate change, which used to be called global warming, has been made into a deeply controversial subject, despite decades of scientific research that demonstrates its existence. Climate change refers to long-term shifts in temperatures due to human activity and, in particular, the release of greenhouse gases into the environment. While the planet as a whole is warming––hence the term global warming––the term climate change is now used because the short-term variations can include higher or lower temperatures, despite the overarching trend toward warmth. Another effect is more extreme weather. There are increasingly more record-breaking weather phenomena, from the number of Category 4 hurricanes to the amount of snowfall in a given winter. These extremes, while they make for dramatic television coverage, can cause immeasurable damage to crops, property, and even lives.
So why is climate change a controversy? The National Oceanographic and Atmospheric Association (NOAA) recognizes its existence. So do the close to 200 countries that signed the Kyoto Protocol, a document intended to engage countries in voluntary actions to limit the activity that leads to climate change. (The United States was not one of the 200 nations committed to this initiative to reduce environmental damage; while Canada did sign on, the Conservative government withdrew from the Kyoto accord in 2011.) So what’s the argument about? Well, for the companies making billions of dollars in the production of goods and services, climate change is a dirty concept indeed. The idea of costly regulations that would require expensive operational upgrades has been a source of great anxiety to much of the business community, and as a rebuttal they argue, via lobbyists, that such regulations would be disastrous for the economy. Some go so far as to question the science used as evidence. There is a lot of finger-pointing among countries, especially when the issue arises of who “gets” to pollute. It is only reasonable perhaps, to give the last word to youth, as it is they who will reap the consequences of the political and economic decisions that have been made in the past, and are being made in the present. What do members of the Youth Climate Movement make of the economic justifications for ‘business as usual’ in the face of mounting scientific evidence that it is business as usual that is contributing to the current ‘tragedy of the commons’?
Key Terms and Concepts
cancer cluster: A geographic area with high levels of cancer within its population
capital accumulation: The reinvestment of profit in order to increase capital assets (rather than for any specific social use).
carrying capacity: How many people can live in a given area considering the amount of available resources
climate change: Long-term shifts in temperature and climate due to human activity
commons: Collective resources that humans share in common
concentric zone model: A model of human ecology that views cities as a series of circular rings or zones
cornucopian theory: Theory which asserts that human ingenuity will rise to the challenge of providing adequate resources for a growing population
corporate city: A city form based economically on corporate management and financial services
demographic transition theory: Theory that describes four stages of population growth, following patterns that connect birth and death rates with stages of industrial development
demography: The study of population
dual cities: Cities that are divided into wealthy, high-tech, information-based zones of urban development and poorer, run-down, marginalized zones of urban underdevelopment and informal economic activity
edge cities: Urban formations based on clusters of shopping malls, entertainment complexes, and office towers at major transportation intersections
environmental sociology: The sociological subfield that addresses the relationship between humans and the environment
environmental sustainability: The degree to which a human activity can be sustained without damaging or undermining basic ecological support systems
e-waste: The disposal of broken, obsolete, and worn-out electronics
exurbs: Communities that arise farther out than the suburbs and are typically populated by residents of high socioeconomic status
fantasy cities: Cities that choose to transform themselves into Disneyland-like theme parks or sites of mega-events to draw international tourists
fertility rate: A measure noting the actual number of children born
gentrification: When upper- and middle-class residents renovate and live in properties in certain city areas or communities that have been historically less affluent
global city: A unique development based on the new role of cities in the circuits of global information and global capital circulation and accumulation
human ecology: A functional perspective that looks at the relationship between people and their built and natural environment
industrial city: A city in which the major business and employment activities revolve around manufacturing, building, machining.
Malthusian theory: Theory which asserts that population is controlled through positive checks (war, famine, disease) and preventive checks (measures to reduce fertility)
megalopolis: A large urban corridor that encompasses several cities and their surrounding suburbs and exurbs
metropolis: The area that includes a city and its suburbs and exurbs
migration: The movement of people into and out of an area
mortality rate: A measure of the number of people who die
NIMBY: “not in my back yard,” describing the tendency of people to protest poor environmental practices when those practices will impact them directly
pollution: When contaminants are introduced into an environment at levels that are damaging
population composition: A snapshot of the demographic profile of a population based on fertility, mortality, and migration rates
population pyramid: Graphic representation that depicts population distribution according to age and sex
postmodern city: A city defined by its orientation to circuits of global consumption, the fragmentation of previously homogeneous cultures, and the emergence of multiple centres or cores
sex ratio: The ratio of men to women in a given population
slum cities: The development on the outskirts of cities of unplanned shantytowns or squats with no access to clean water, sanitation, or other municipal services
suburbs: The communities surrounding cities, typically close enough for a daily commute
urban sociology: The subfield of sociology that focuses on the study of urbanization
urbanization: The study of the social, political, and economic relationships of cities
zero population growth: A theoretical goal in which the number of people entering a population through birth or immigration is equal to the number of people leaving it via death or emigration
12.4 References
Blanchard, B. (2007). Coke vows to reduce water used in drink production. Reuters. Retrieved December 14, 2011 from http://www.reuters.com/article/2007/06/05/environment-coke-water-dc-idUSSP28630420070605
Burgess, E. (1925). The growth of the city. In R. Park & E. Burgess (Eds.), The City, (pp. 47-62) . Chicago: University of Chicago Press.
Caldwell, J. C. & Caldwell, B. K., Caldwell, P., McDonald, P.F., & Schindlmayr, T. (2006). Demographic Transition Theory. Dordrecht: Springer.
Caulfield, J. (1994). City form and everyday life: Toronto’s gentrification and critical social practice. Toronto: University of Toronto Press
Chandler, T. & Fox, G. (1974). 3000 years of urban history. New York: Academic Press.
CIA World Factbook. (2011). Guide to Country Comparisons. Central Intelligence Agency World Factbook. Retrieved January 23, 2012 from https://www.cia.gov/library/publications/the-world-factbook/rankorder/rankorderguide.html
Davis, M. (1990). City of quartz: Excavating the future in Los Angeles. London: Verso.
Davis, M. (2006). Planet of slums. London: Verso.
De Souza, M. (2012). “Majority of oil sands ownership and profits are foreign, says analysis.” Financial Post. Retrieved September 25, 2014 from http://business.financialpost.com/2012/05/10/majority-of-oil-sands-ownership-and-profits-are-foreign-says-analysis/?utm_source&utm_medium&utm_campaign=http%3A%2F%2F
Droitsch, D. & Simieritsch, T. (2010). Canadian aboriginal concerns with oil sands: A compilation of key issues, resolutions and legal activities. [PDF] Pembina Institute. Retrieved September 25, 2014 from https://www.pembina.org/reports/briefingnoteosfntoursep10.pdf
Duncan, K., Guidotti, T., Cheng, W., Naidoo, K., Gibson, G., Kalkstein, L., … Last, J. (1998). Health sector. [PDF] In G. Koshida, and W. Avis (Eds.), The Canada country study: Climate impacts and adaptation. (pp. 501-590). Environment Canada. Retrieved August 9, 2014 from http://publications.gc.ca/collections/Collection/En56-119-6-1998E.pdf
Ehrlich, P. R. (1968). The Population Bomb. New York: Ballantine.
Employment and Social Development Canada. (2014). Canadians in Context – Geographic Distribution. Indicators of Well-being in Canada. Retrieved August 8, 2014 from http://www4.hrsdc.gc.ca/.3ndic.1t.4r@-eng.jsp?iid=34
Feagin, J., & Parker, R. (1990). Building American cities: The urban real estate game. (2nd ed.) Englewood Cliffs, NJ: Prentice Hall.
Fishlock, R. (2011). Summary of electronic waste regulations in Canada. [PDF] Blake, Cassels and Graydon LLP Bulletins. Retrieved August 13, 2014 from http://blakesfiles.com/Bulletins/legal_updates/environmental/jan_2012/E_waste_Regs_Canada.pdf
France24. (2010). Sarkozy promises war without mercy for Paris suburbs. France24. Retrieved December 9, 2011 from http://www.france24.com/en/20100420-sarkozy-war-suburbs-drugs-crime-violence-truancy-tremblay-en-france-saint-denis-france
Gosselin, P., Hrudey, S.E., Naeth, M.A., Plourde, A., Therrien. R., Van der Kraak, G., & Xu, Z. (2010). Environmental and health impacts of Canada’s oil sands industry. [PDF] Royal Society of Canada Expert Panel report. Ottawa, ON. December. Retrieved September 25, 2014 from http://rsc-src.ca/sites/default/files/pdf/RSC%20Oil%20Sands%20Panel%20Main%20Report%20Oct%202012.pdf
Grant, J., Eli A., & Dyer, S. (2013). Forecasting the impacts of oilsands expansion: Measuring the land disturbance, air quality, water use, greenhouse gas emissions, and tailings production associated with each barrel of bitumen production. [PDF] June 2013 report. The Pembina Institute and The Pembina Foundation, Drayton Valley, AB. Retrieved September 25, 2014 from http://www.pembina.org/reports/oilsands-metrics.pdf
Greenpeace. (2011). Greenpeace guide to greener electronics [PDF]. Retrieved June 30, 2016 from http://www.greenpeace.org/international/en/campaigns/detox/electronics/Guide-to-Greener-Electronics/
Hannigan, J. (1998). Fantasy city: Pleasure and profit in the postmodern metropolis. NY: Routledge
Hasham, A. (2013). Landfill or incinerator: What’s the future of Toronto’s trash? Toronto Star. Retrieved Aug. 8, 2014 from http://www.thestar.com/news/gta/2013/03/12/landfill_or_incinerator_whats_the_future_of_torontos_trash.html
Hardin, G. (1968). The tragedy of the commons, Science 162(3859), 1243–1248. Retrieved December 10, 2011 from http://www.sciencemag.org/content/162/3859/1243.full
Keil, R. & Kipfer, S. (2003). The urban experience and globalization. In W. Clement and L. Vosko (Ed.s). Changing Canada: Political economy as transformation. Montreal: McGill-Queen’s Press.
Logan, J. & Molotch, H. (1987). Urban fortunes: The political economy of place. Berkeley, CA: University of California Press.
Malthus, T. R. (1965 [1798]). An Essay on Population. New York: Augustus Kelley.
Office of the Auditor General of Canada. (2007). Exhibit 4.1—Annual deaths in Canada related to air pollution exceed those from other causes. In 2000 May Report of the Commissioner of the Environment and Sustainable Development. Retrieved August 8, 2014 from http://www.oag-bvg.gc.ca/internet/English/att_c004xe01_e_11124.html
Old Bailey Proceedings Online. (2011). Population history of London. Retrieved December 11, 2011 from http://www.oldbaileyonline.org/static/Population-history-of-london.jsp
Ontario Ministry of the Environment and Climate Change. (2010). Ground-level ozone. Air Quality Ontario. Retrieved August 9, 2014 from http://www.airqualityontario.com/science/pollutants/ozone.php
Papenfuss, M. (2011). Cynical Chinese taking own smog readings. Newser. Retrieved January 23, 2012 from http://www.newser.com/story/134966/cynical-chinese-taking-own-smog-readings.html
Park, R. (1934 [1915]). The city: Suggestions for investigations of human behavior in the city. American Journal of Sociology 20, 577–612.
Parsons, T., & Shils, E., (Eds.). (1961). Theories of Society: Foundations of Modern Sociological Theory. New York: Free Press.
Sassen, S. (2001). The global city: New York, London, Tokyo. Princeton, NJ: Princeton University Press.
Sassen, S. (2005). The global city: Introducing a concept. Brown Journal of World Affairs. 11(2), 27-43.
Simon, J. L. (1981). The Ultimate Resource. Princeton, NJ: Princeton University Press.
Sjoberg, G. (1965). The preindustrial city: Past and present. New York: Free Press.
Statistics Canada. (2011). Population, urban and rural, by province and territory. Statistics Canada Summary Tables. Feb. 4. Retrieved August 8, 2014 from http://www.statcan.gc.ca/tables-tableaux/sum-som/l01/cst01/demo62a-eng.htm
Stelter, G. (1986). Power and the place in urban history. In G. Stelter and A. Artibise, (Eds). Power and place : Canadian urban development in the North American context. Vancouver: University of British Columbia Press
Stanford, J. (2012). A cure for Dutch disease: Active sector strategies for Canada’s economy. [PDF] Ottawa, ON: Canadian Centre for Policy Alternatives. Retrieved September 25, 2014 from http://www.policyalternatives.ca/sites/default/files/uploads/publications/National%20Office/2012/04/Cure%20For%20Dutch%20Disease.pdf
Turneffe Atoll Trust. (2008). Improper development: Recommendations of the Turneffe Atoll Coastal Advisory Committee. Retrieved December 14, 2011 from http://www.turneffeatoll.org/threats-to-turneffe-atoll/improper-development-practices
United Nations. (2011). World Population Prospects: The 2010 Revision. Volume II: Demographic Profiles. [PDF] Department of Economic and Social Affairs, Population Division. ST/ESA/SER.A/317. Retrieved August 8, 2014 from http://esa.un.org/wpp/documentation/pdf/WPP2010_Volume-II_Demographic-Profiles.pdf
United Nations Population Fund. (2008). Linking Population, Poverty, and Development [PDF]. Retrieved December 9, 2011 from http://www.un.org/esa/population/publications/wup2007/2007WUP_Highlights_web.pdf
United Nations Population Fund. (2011). The State of World Population [PDF]. Retrieved August 8, 2014 from http://foweb.unfpa.org/SWP2011/reports/EN-SWOP2011-FINAL.pdf
United Nations. (2008). World urbanization prospects: The 2007 revision. [PDF] New York: United Nations. Retrieved August 13, 2014 from http://www.un.org/esa/population/publications/wup2007/2007WUP_Highlights_web.pdf
United Nations. (2012). World urbanization prospects: The 2011 revision. [PDF] New York: United Nations. Retrieved June 30, 2016 from http://www.un.org/en/development/desa/population/publications/pdf/urbanization/WUP2011_Report.pdf
USAID. (2010). Family Planning: The World at 7 Billion. Retrieved December 10, 2011
Vincent, M., & Fick, S. (2000). Blowin’ in the wind: Canada’s smoggiest places. [PDF] Canadian Geographic. Retrieved August 9, 2014 from http://www.canadiangeographic.ca/wildlife-nature/articles/pdfs/urbanization-blowin-in-the-wind.pdf
World Resources Institute. (2011). Statement: A climate change agreement in Durban. Retrieved June 30, 2016 from http://www.wri.org/news/2011/12/statement-climate-deal-comes-together-durban
