Evaluation of Solid Tissue Samples
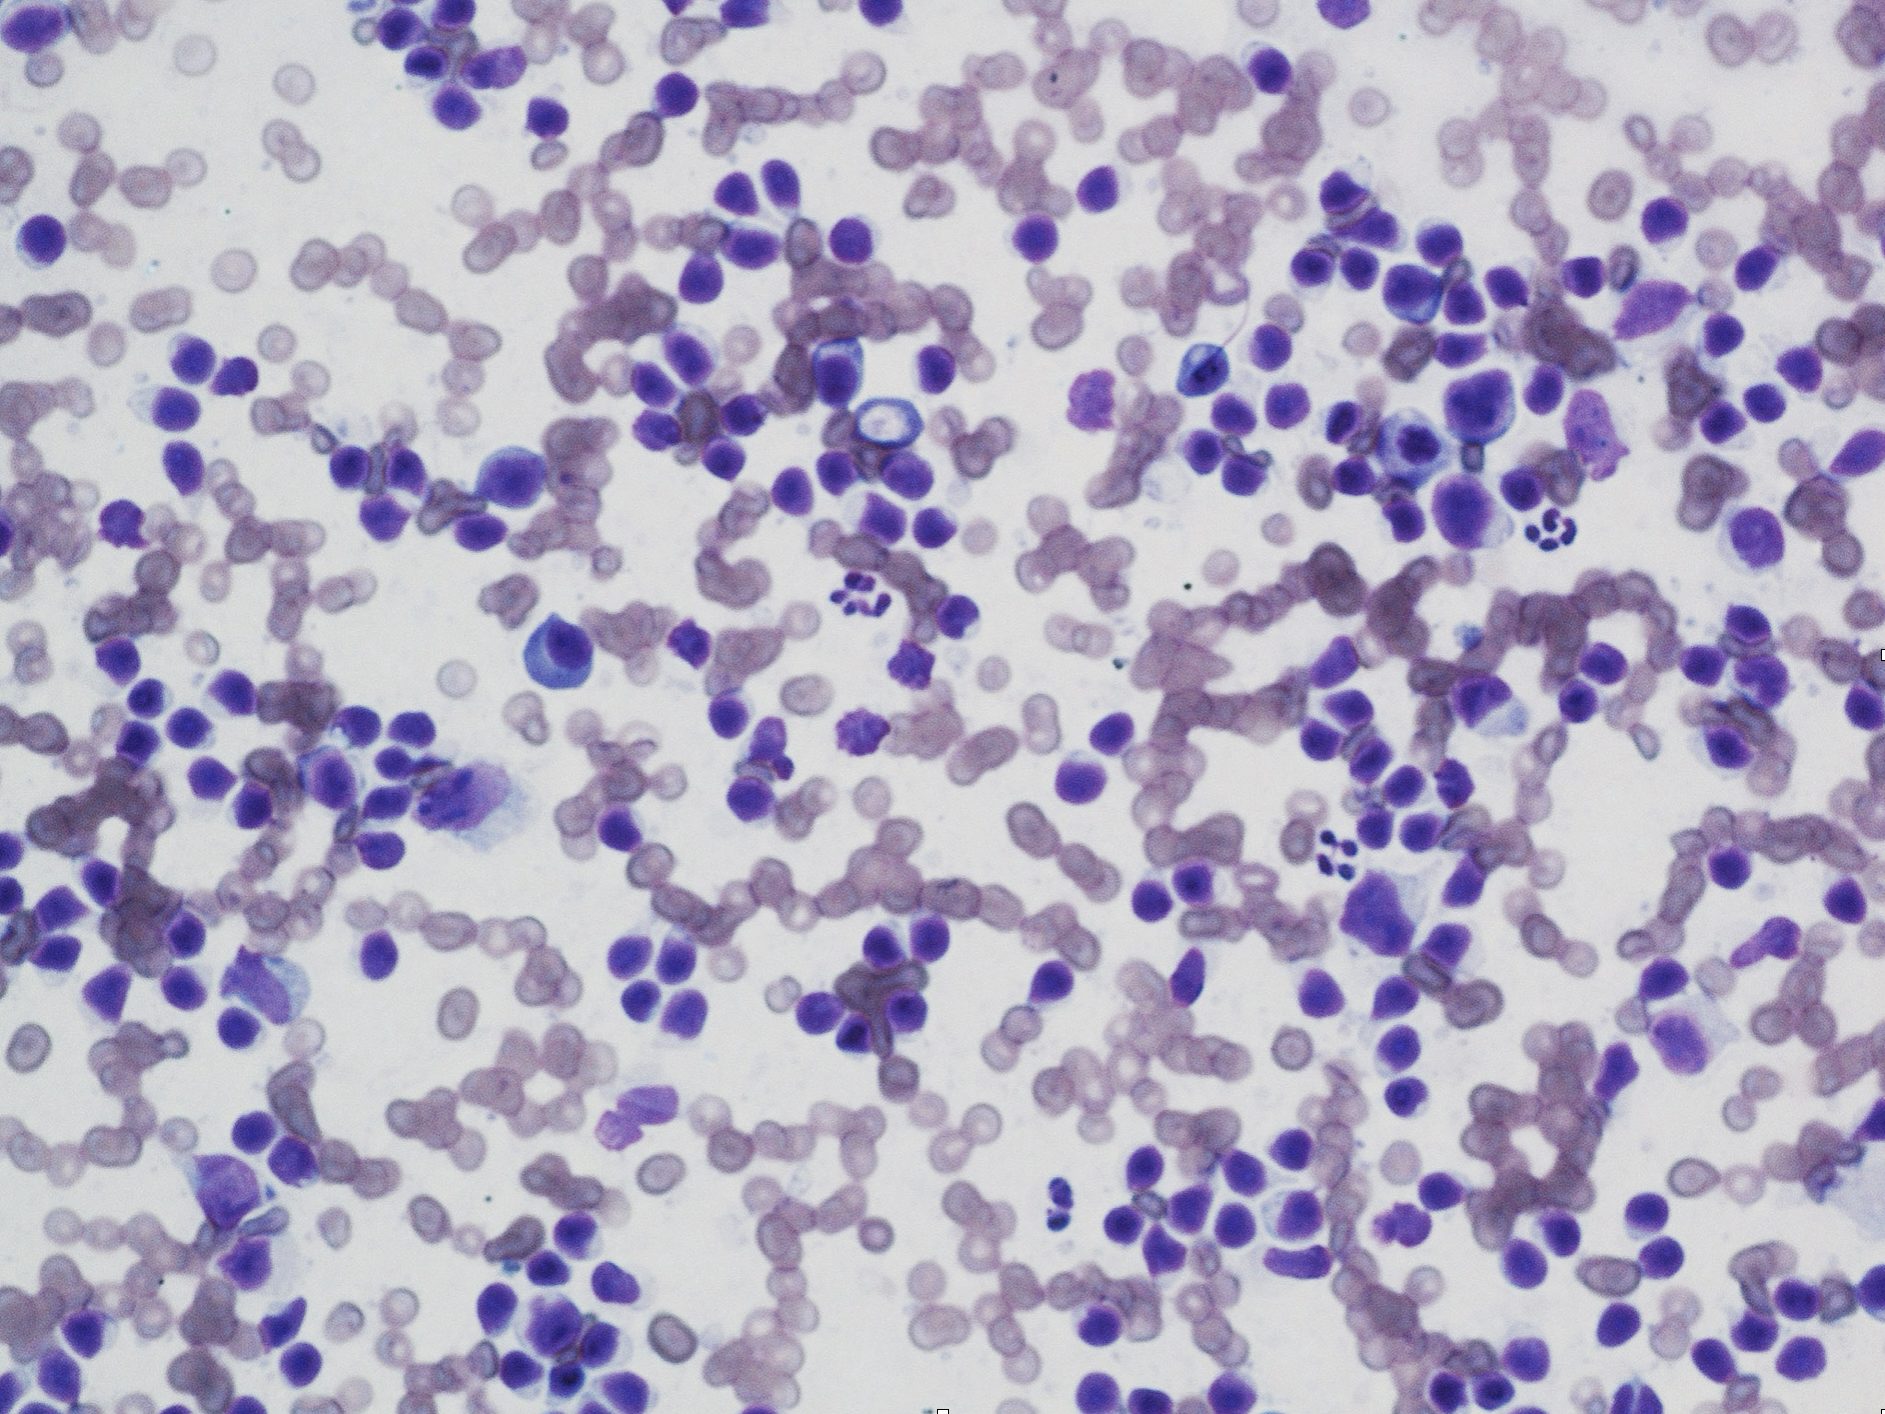
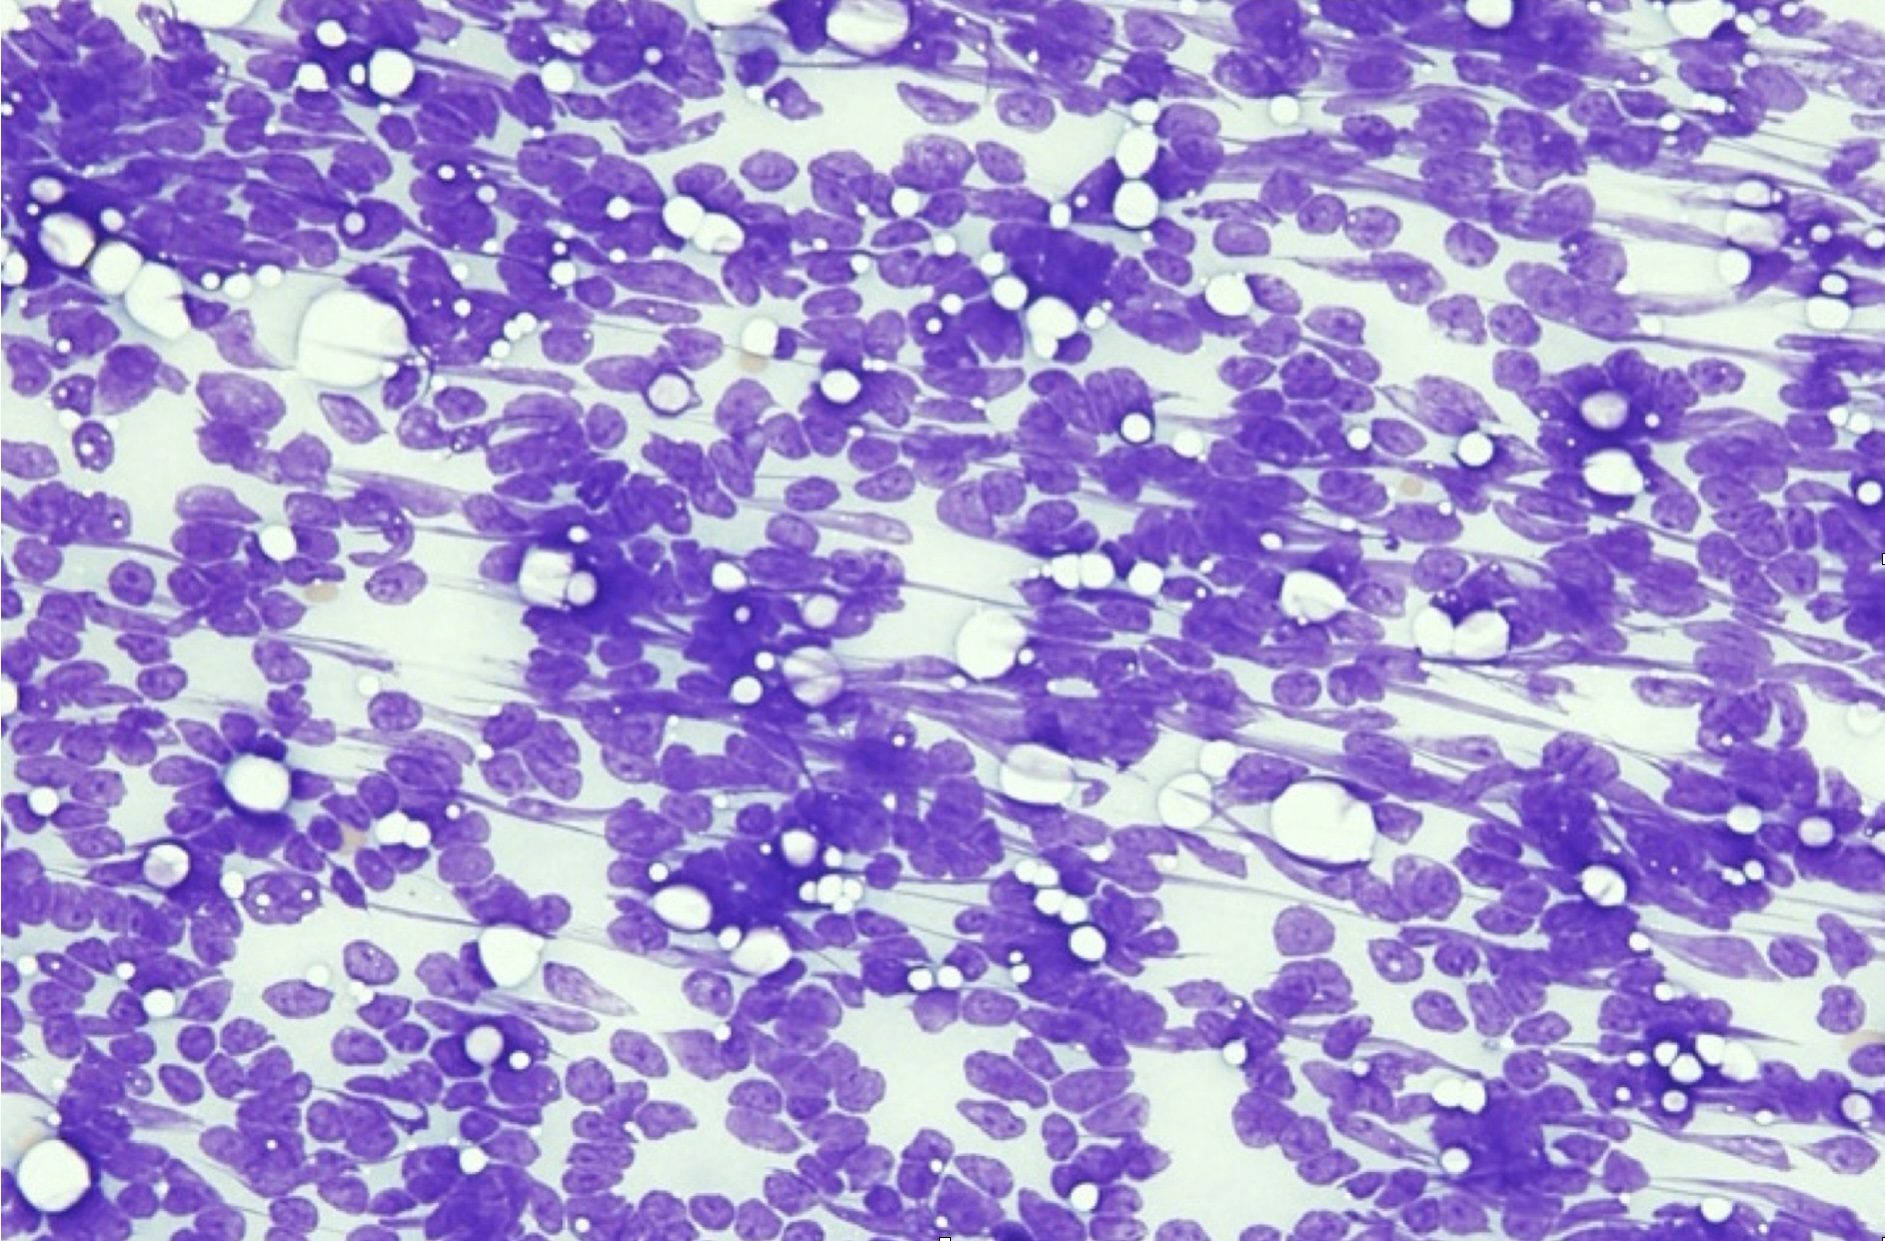
There are several steps to follow when conducting the microscopic examination of stained cytology smears (Video: Cytology Microscopy), beginning with a low power (4x objective) evaluation of sample quality. Samples may be poorly cellular due to technique or due to the nature of the lesion. In this case, biopsy or repeat sampling may be necessary. The presence or degree of peripheral blood contamination (Fig. 5.1) may help determine the vascularity of the lesion, but if abundant, peripheral blood can obscure the cells of primary interest. The smears should be scanned to look for large objects (e.g. pollen grains, large yeast organisms), debris, background composition, and to localize areas for further examination at higher magnification. In any given smear, there may be areas where cells are disintegrated or disrupted (Fig. 5.2) and other areas where cells are intact, or areas where cells are too thick to evaluate and other areas where cells are ideally spread in a single layer.
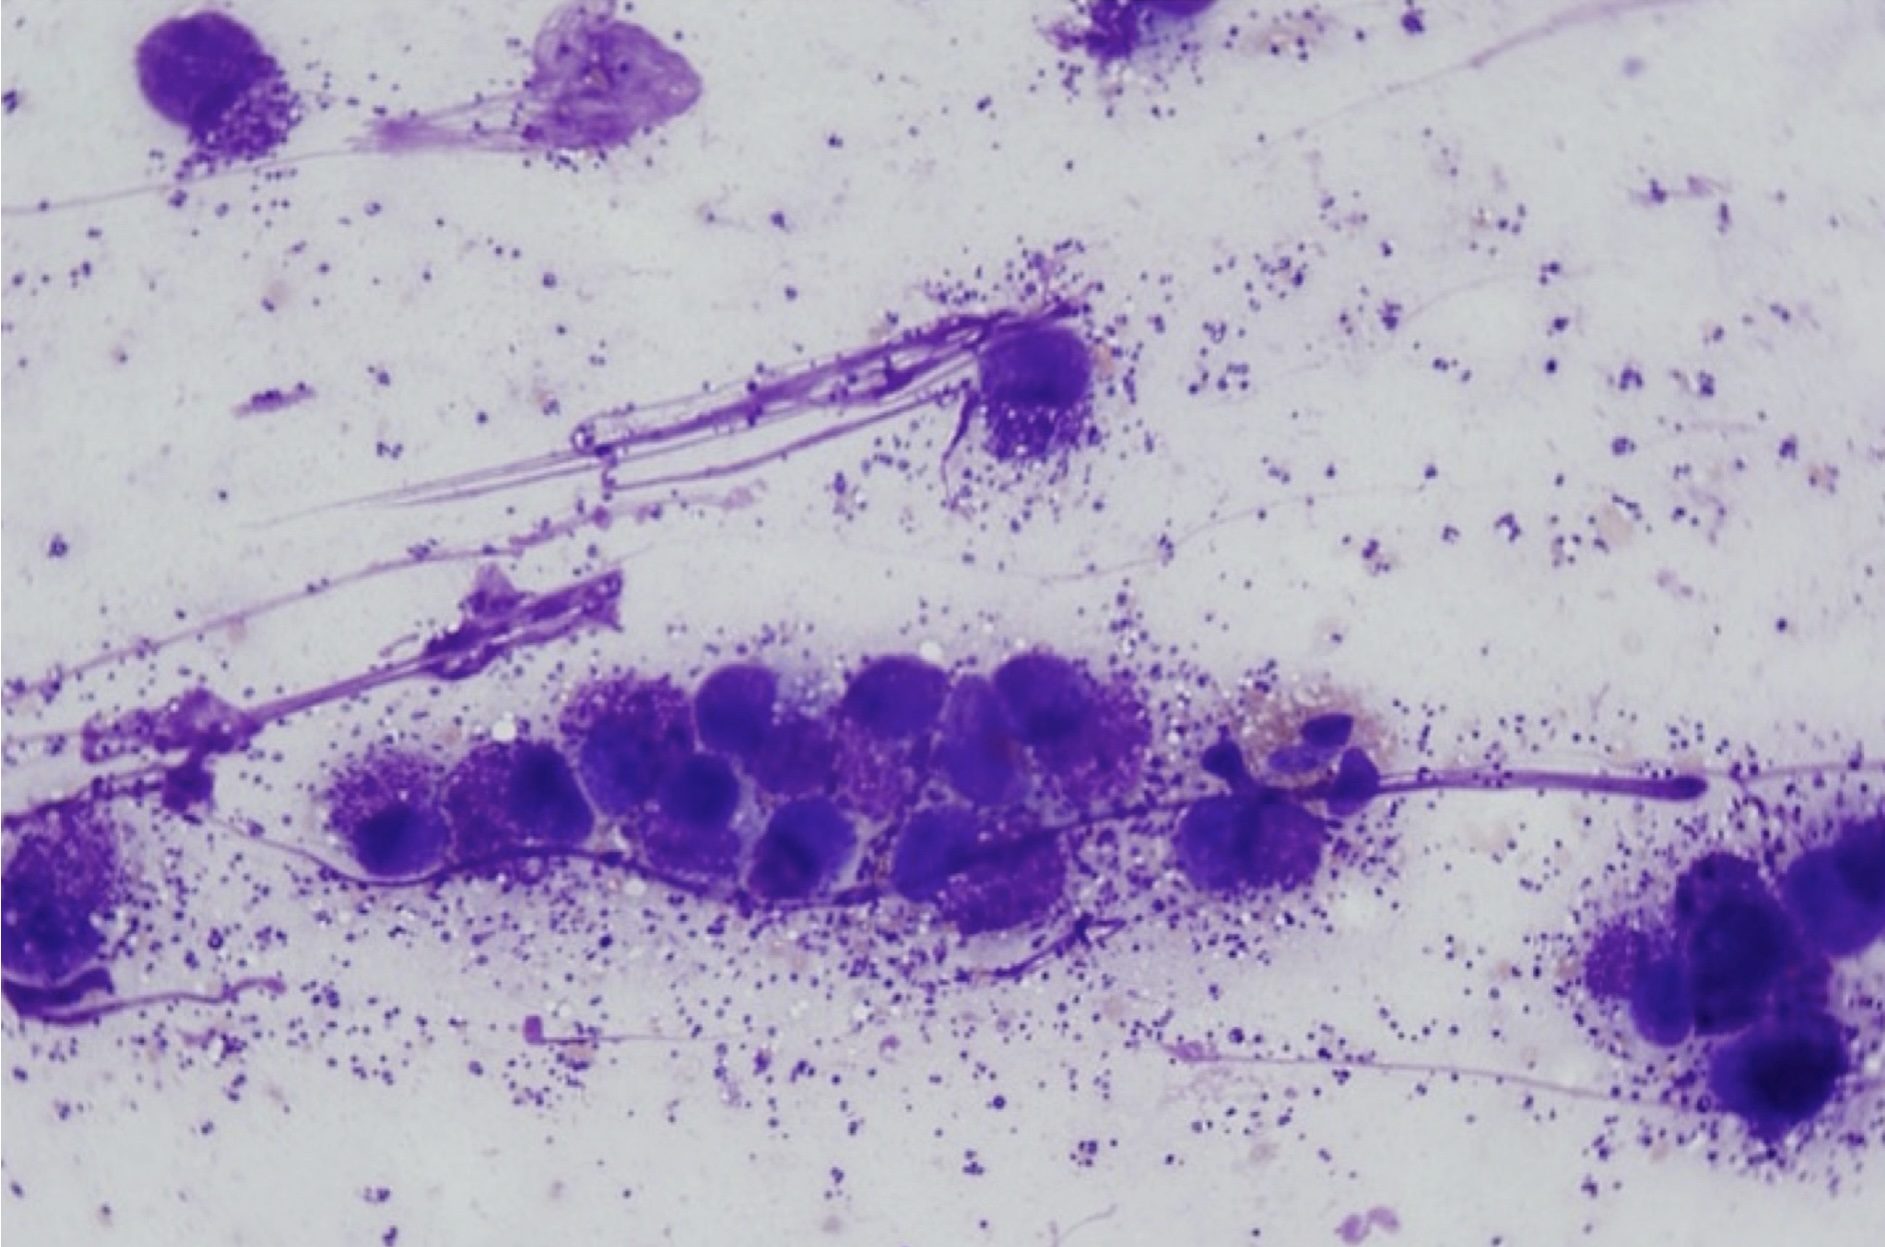
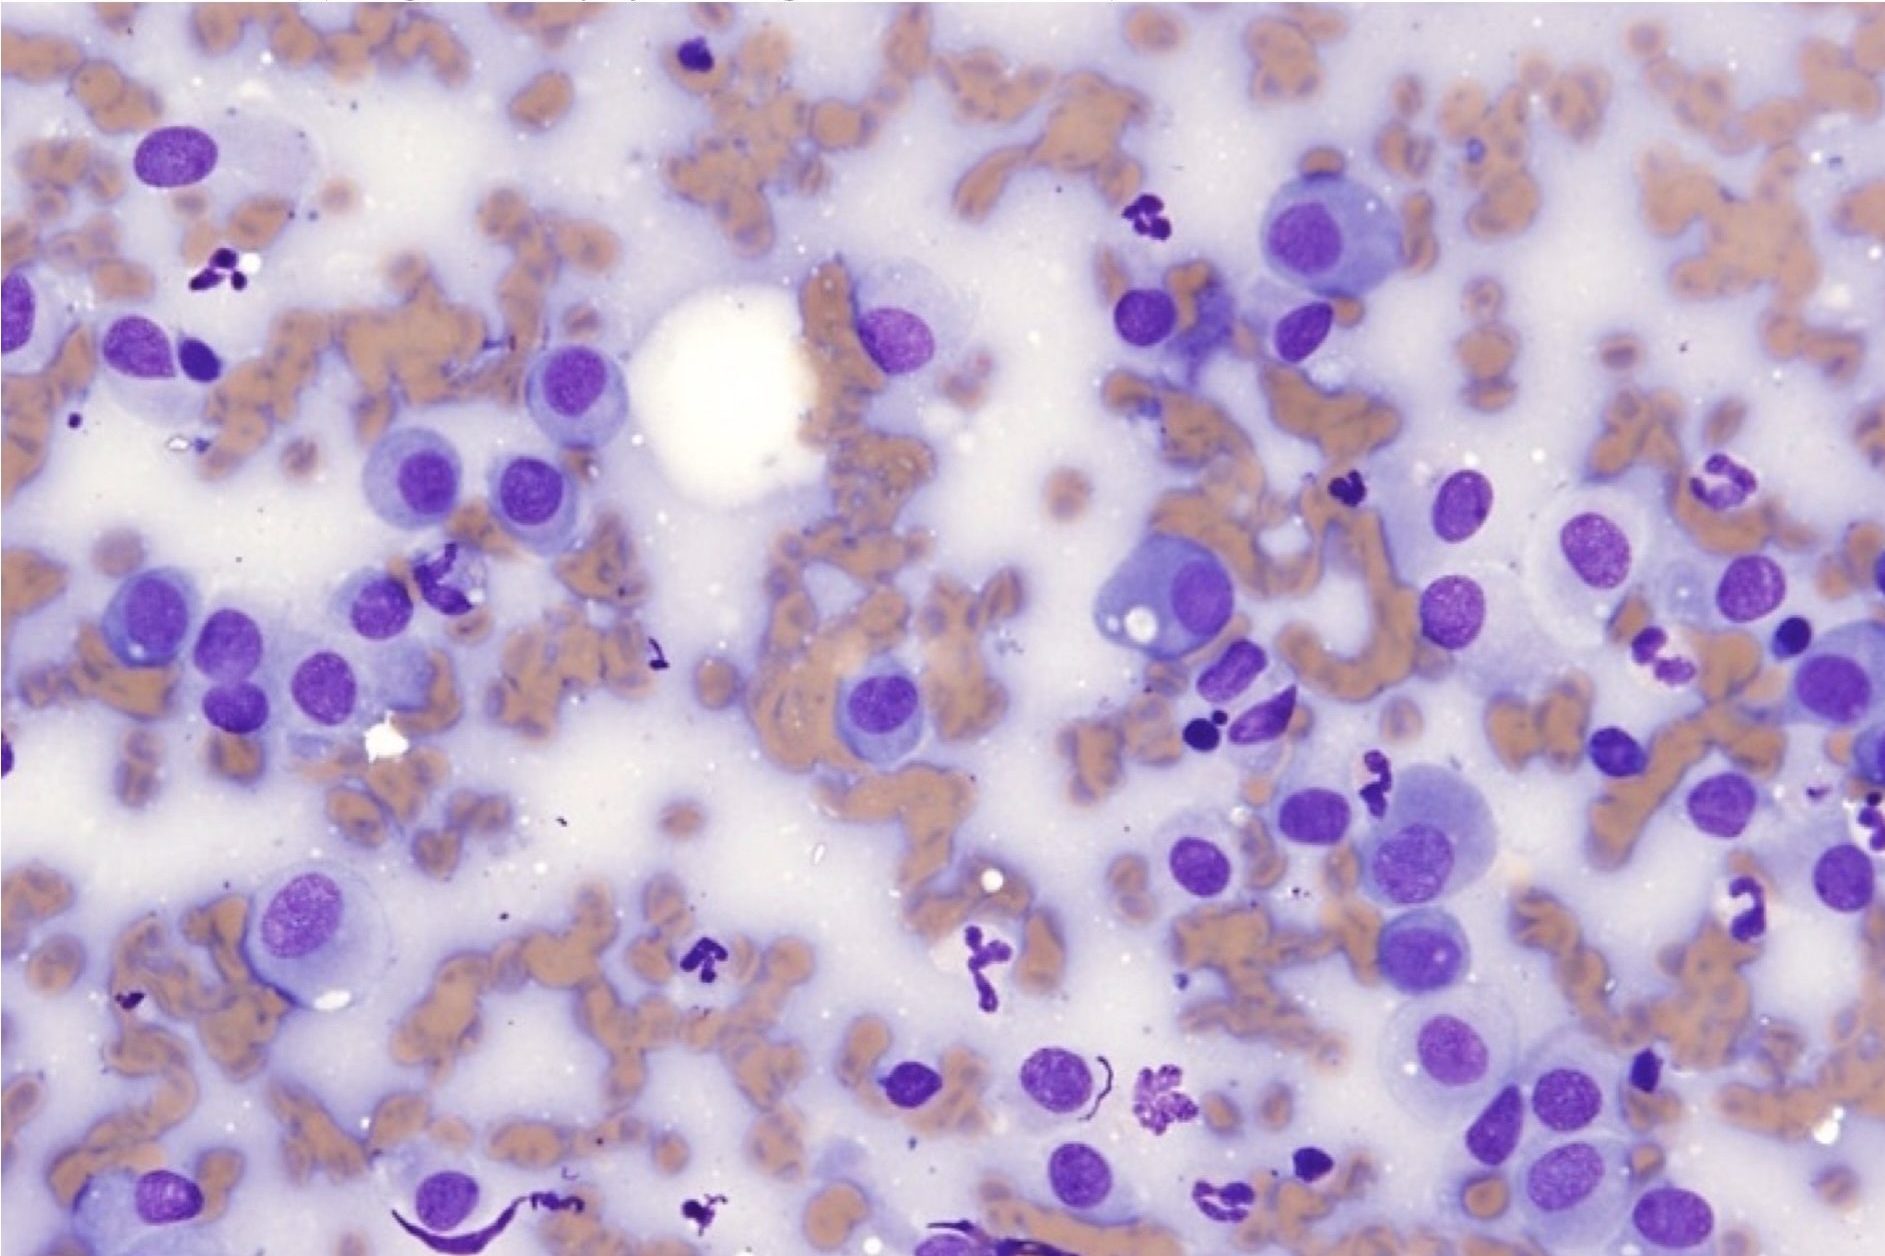
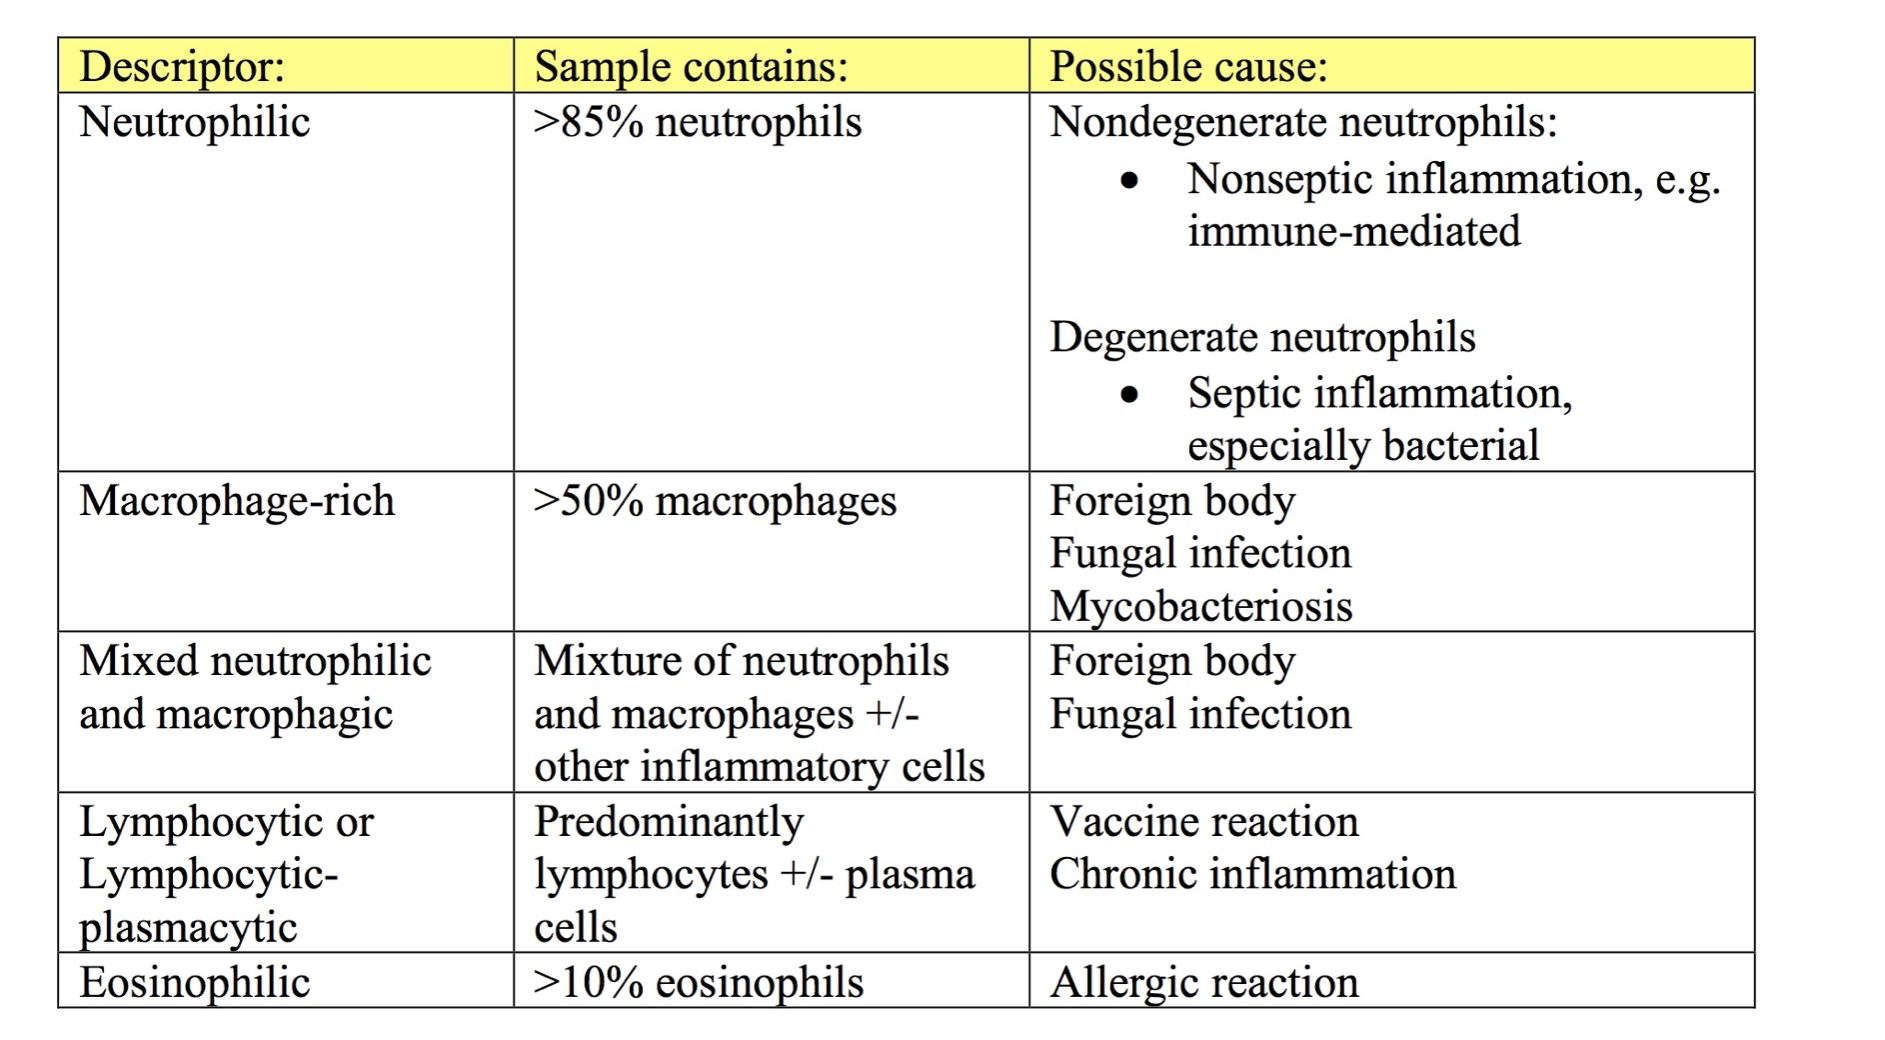
At higher magnification (40x or 50x objective), determine if the cell population is comprised of inflammatory or noninflammatory cells. If the cell population is inflammatory, decide on the predominant cell type(s). Inflammatory lesions can include any combination of degenerate and nondegenerate neutrophils (Fig. 5.3 and Fig. 5.4), macrophages (Fig. 5.5), multinucleate giant cells, lymphocytes, eosinophils, mast cells (Fig. 5.6), and plasma cells (Fig. 5.7; see Chapter 2: Leukocytes for more images). The sample is described based on the proportions of inflammatory cells present (see Table 5.1). Some terms, such as granulomatous or pyogranulomatous, are best used for describing histologic samples, but may occasionally be used to describe cytologic samples.
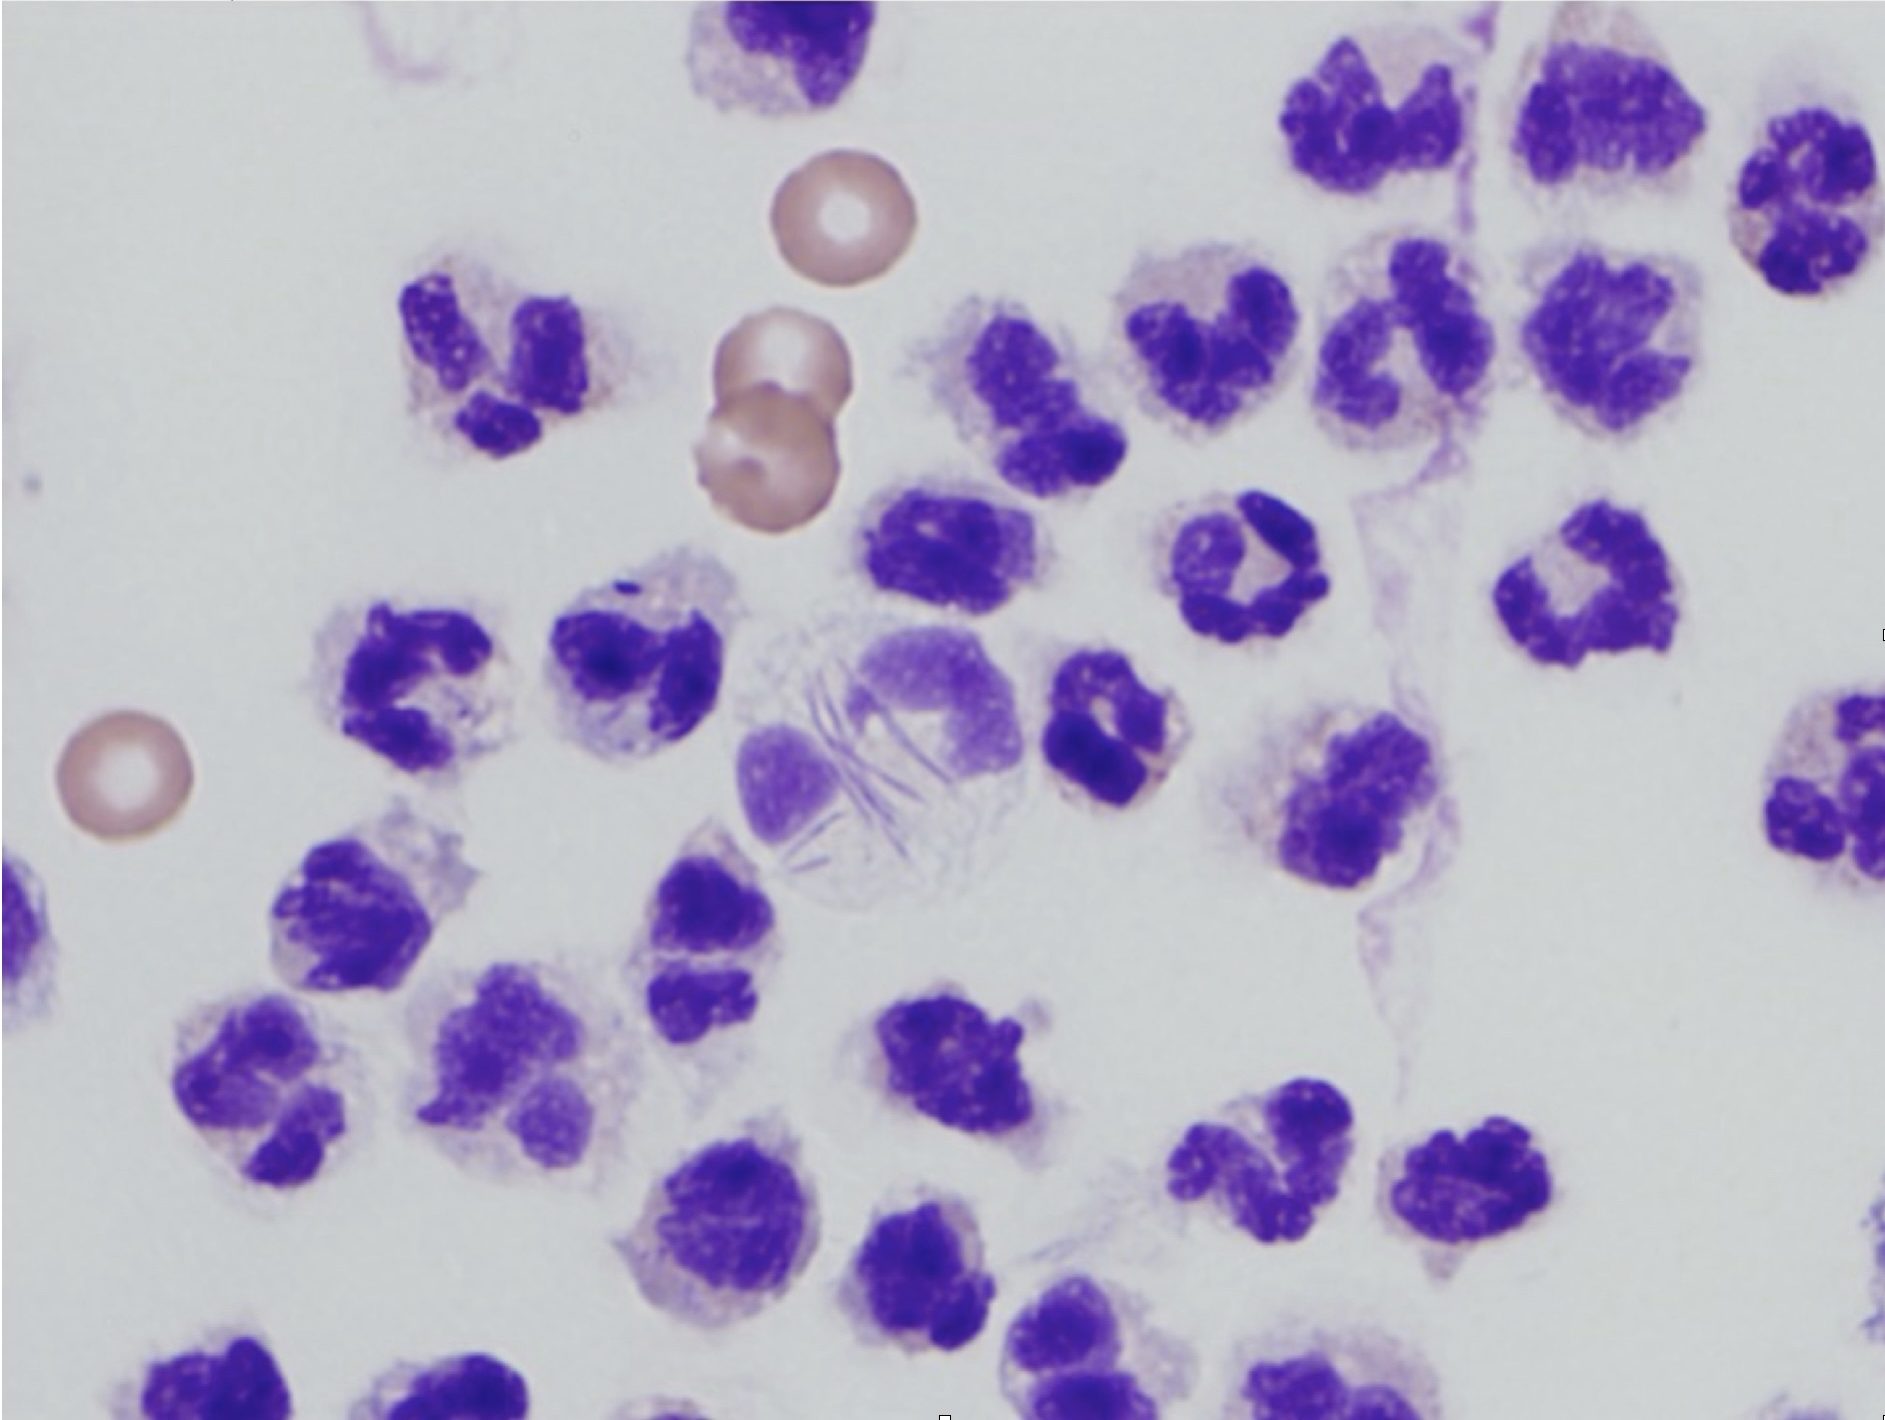
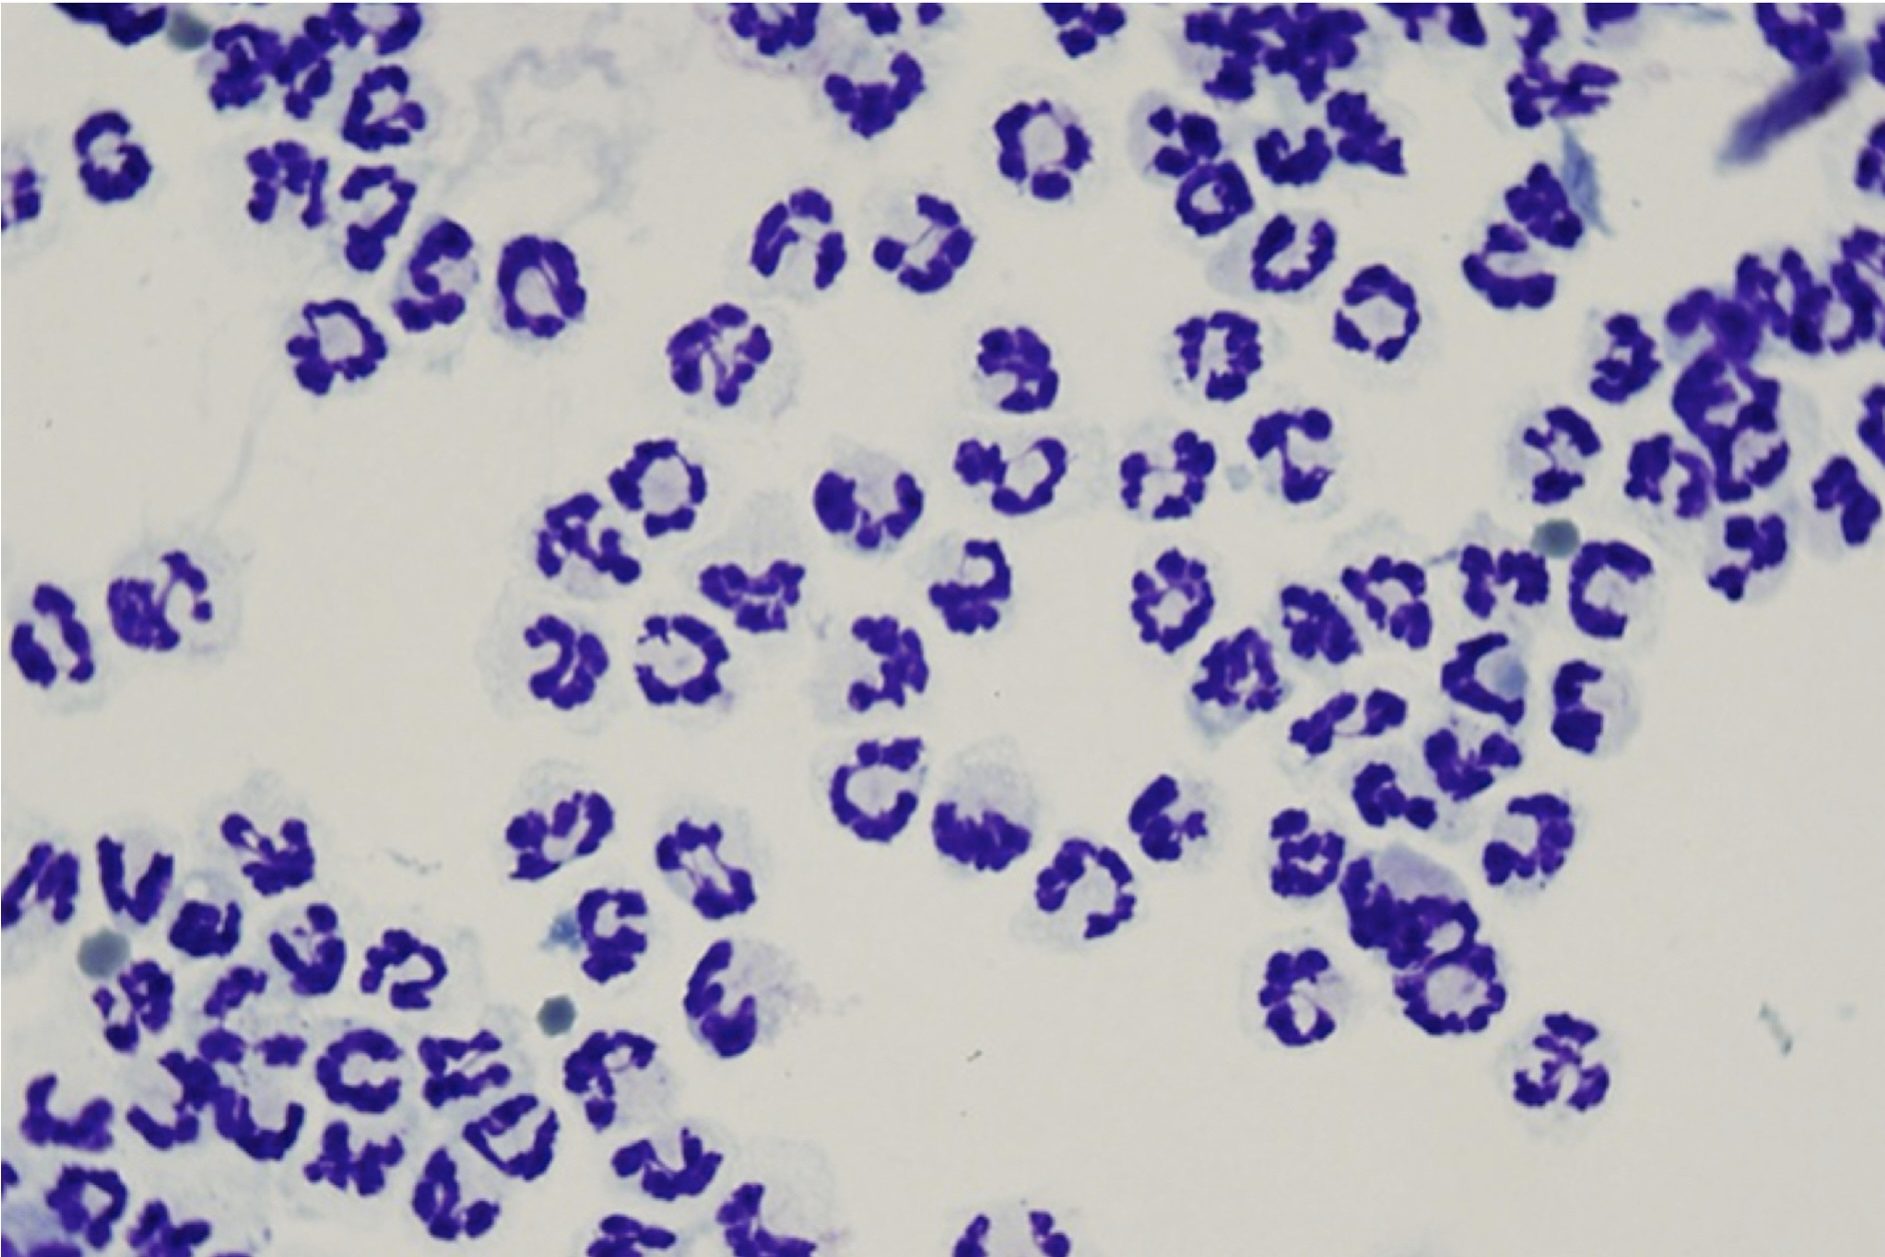
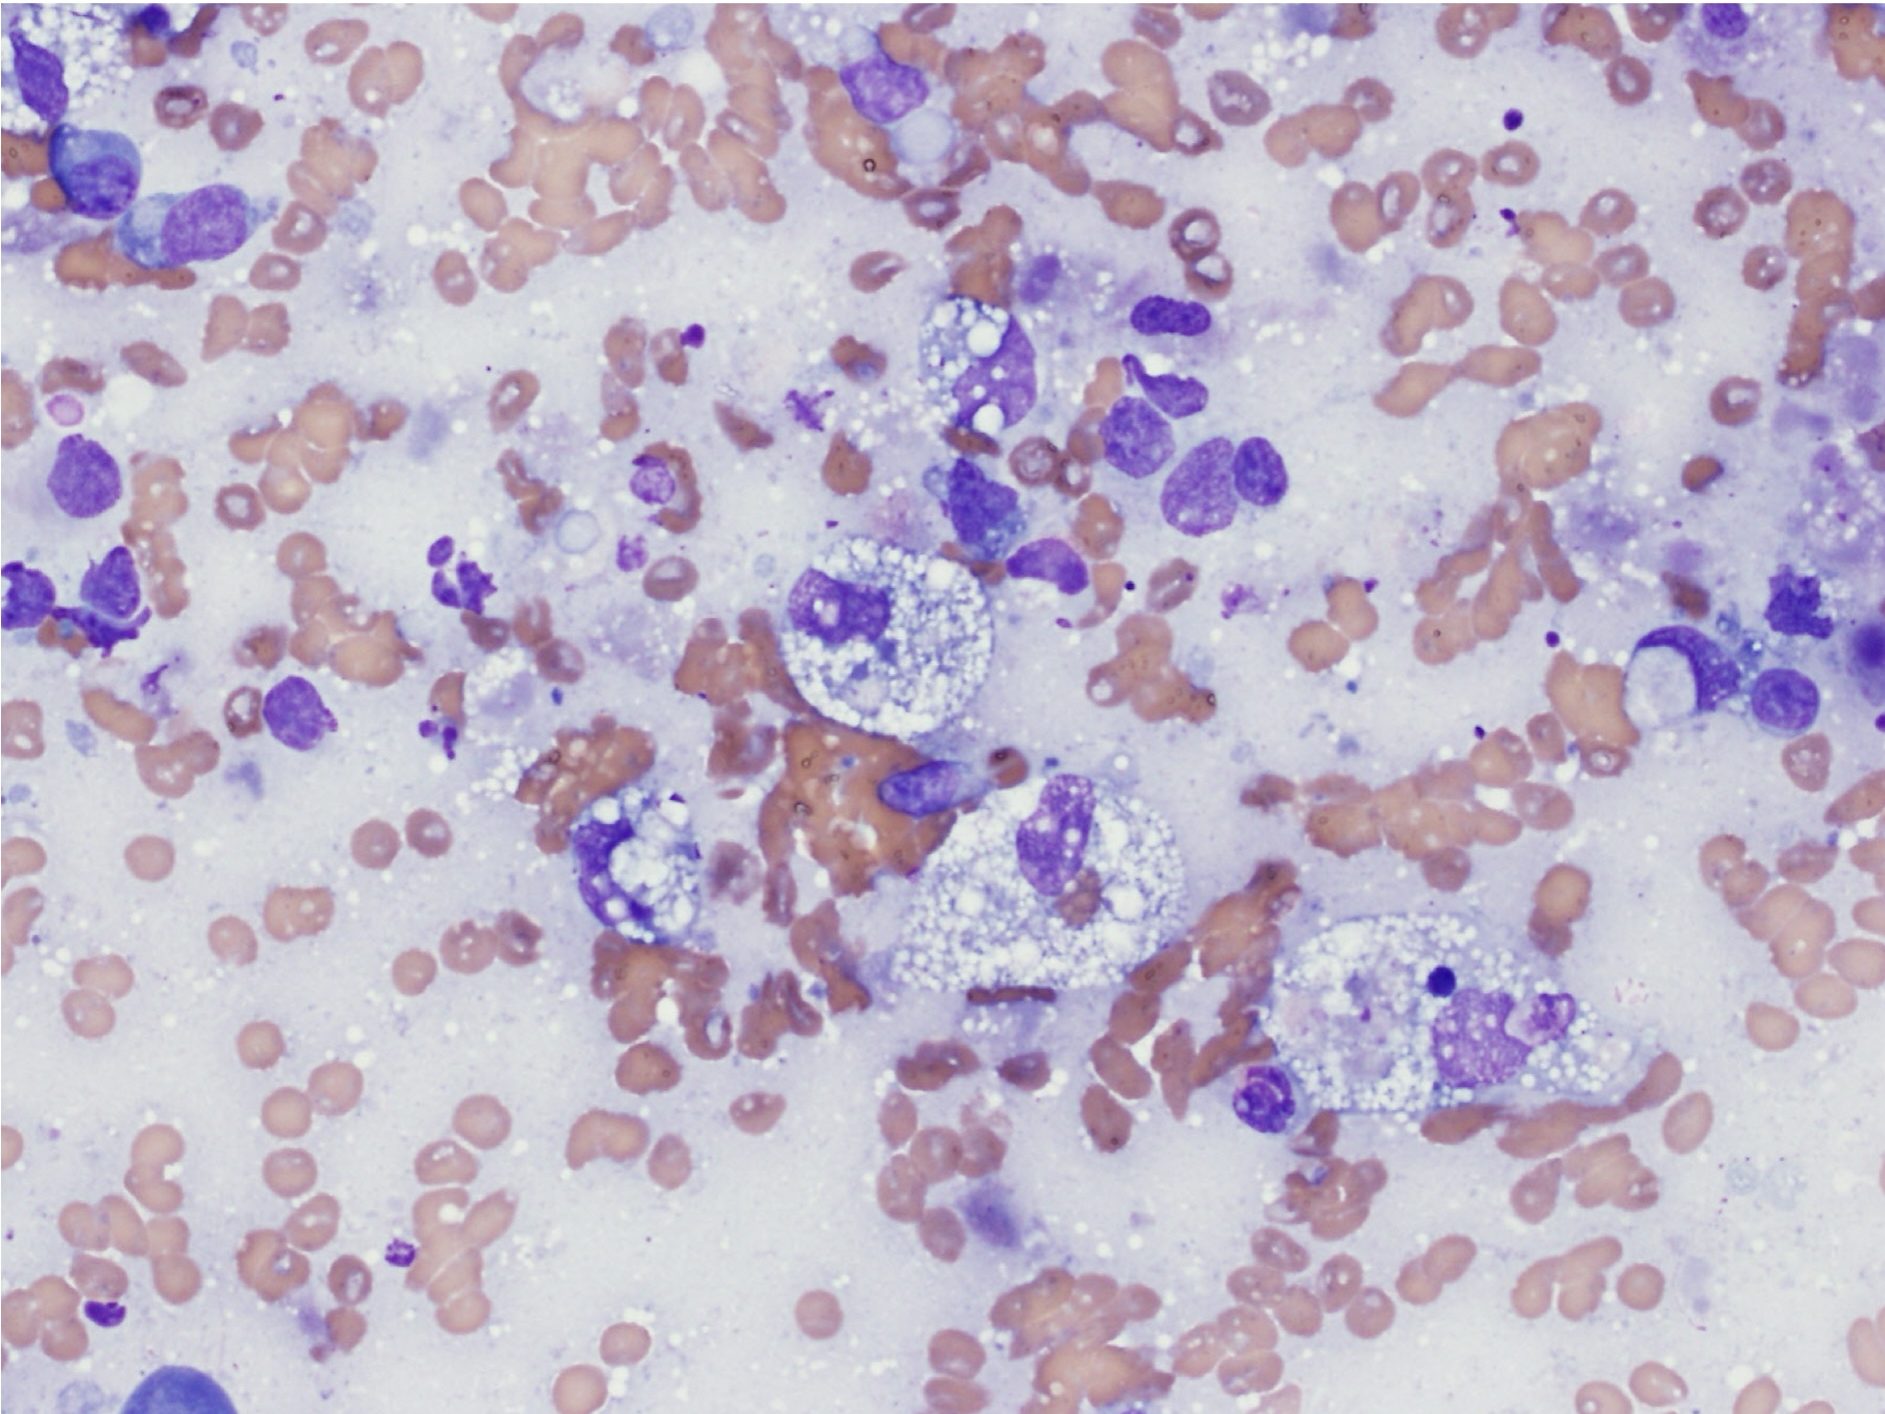
Degenerate change, a descriptor applied only to neutrophils in cytologic preparations, is characterized by swelling and lysis of the nucleus (karyolysis; Fig. 5.3). This should not be confused with toxic change, which describes cytoplasmic changes seen in peripheral blood neutrophils that have been released prematurely from the bone marrow due to increased demand.
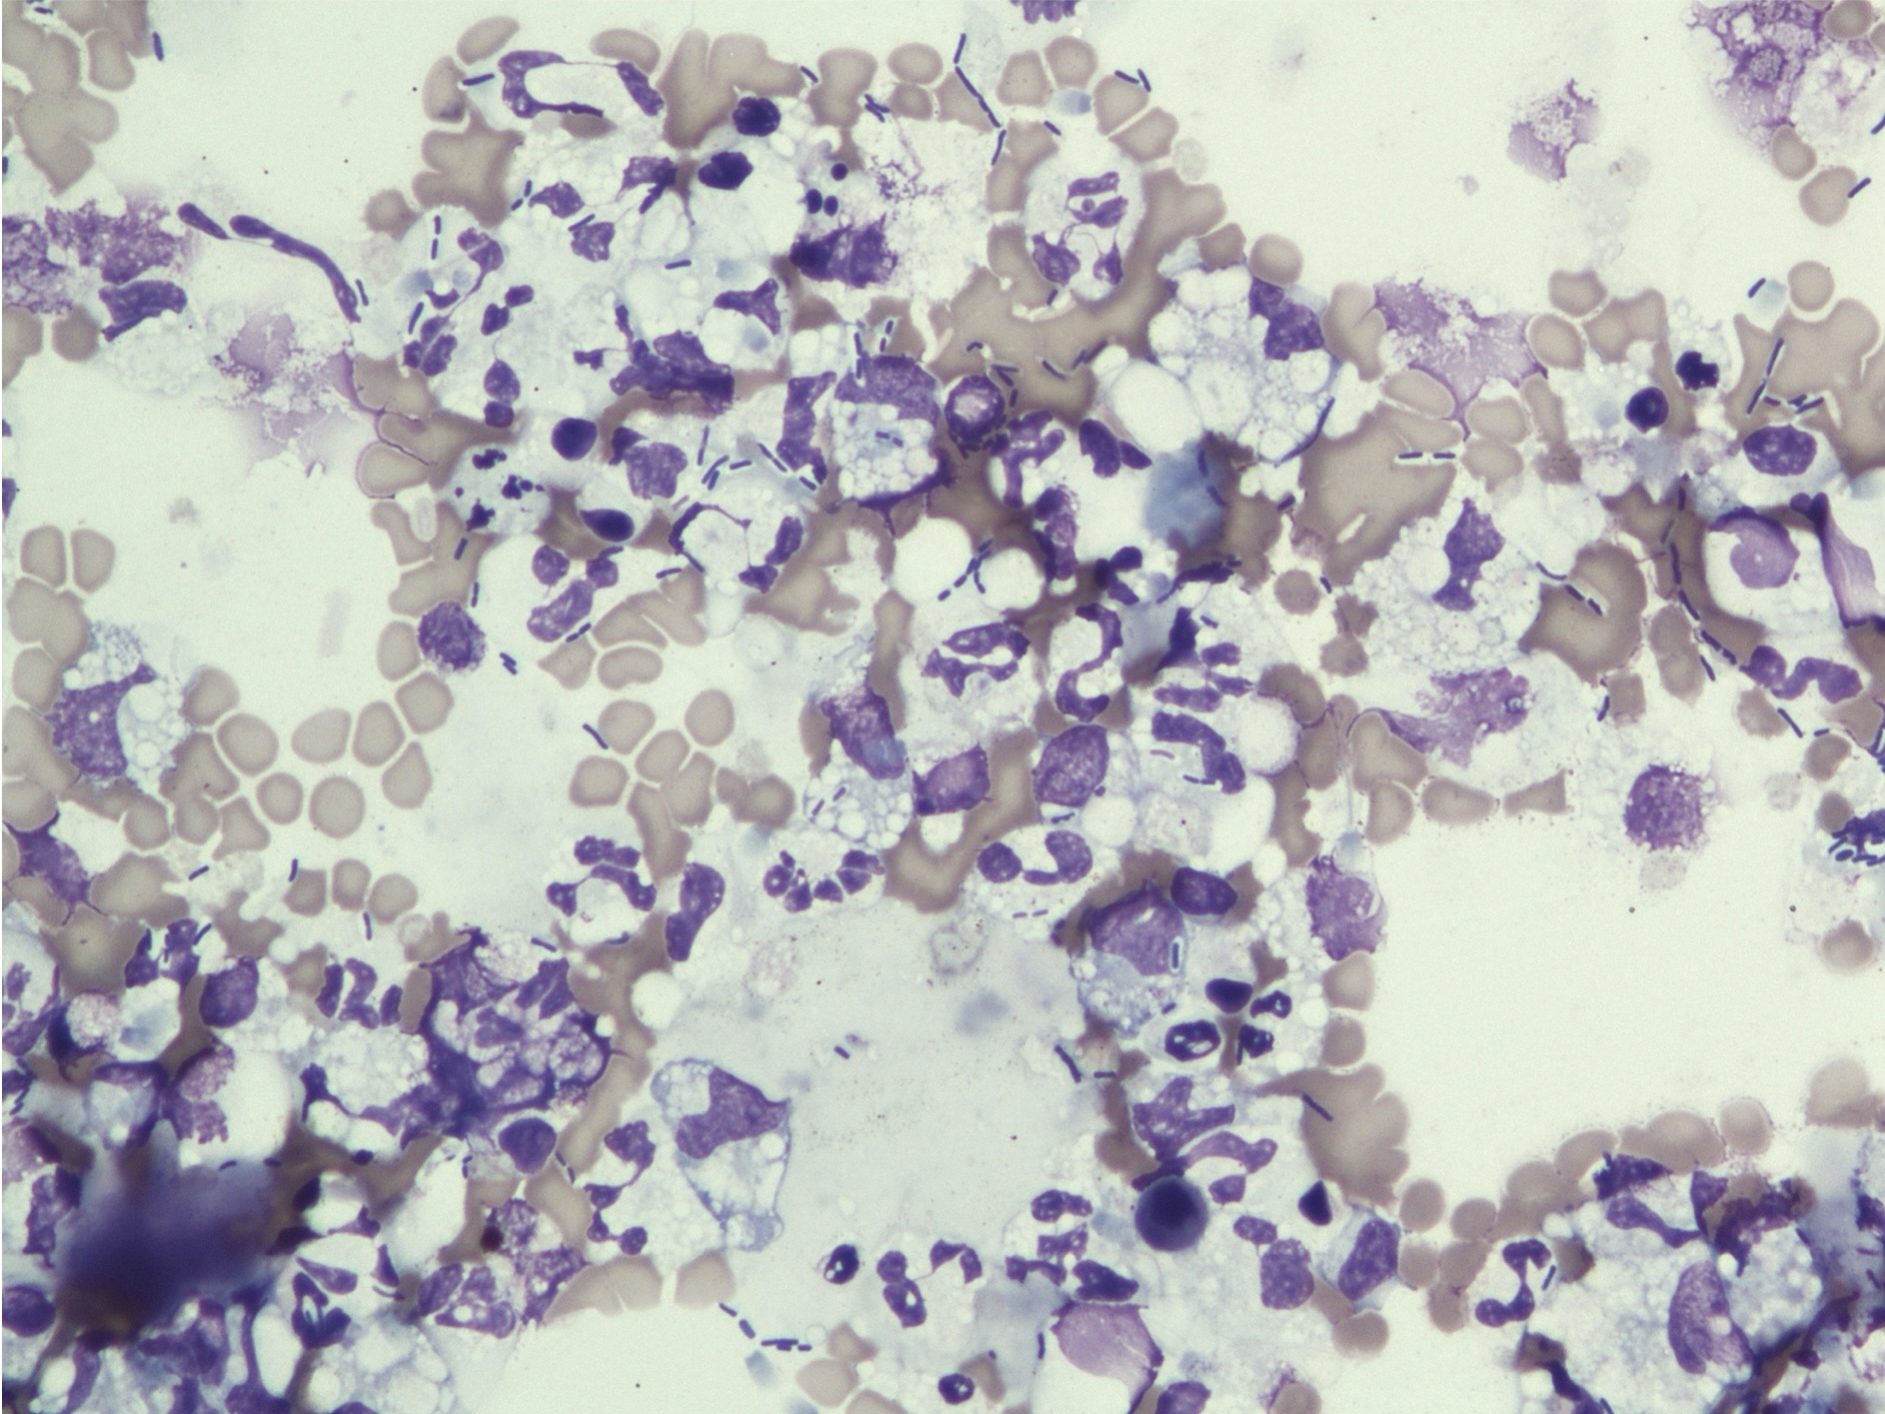
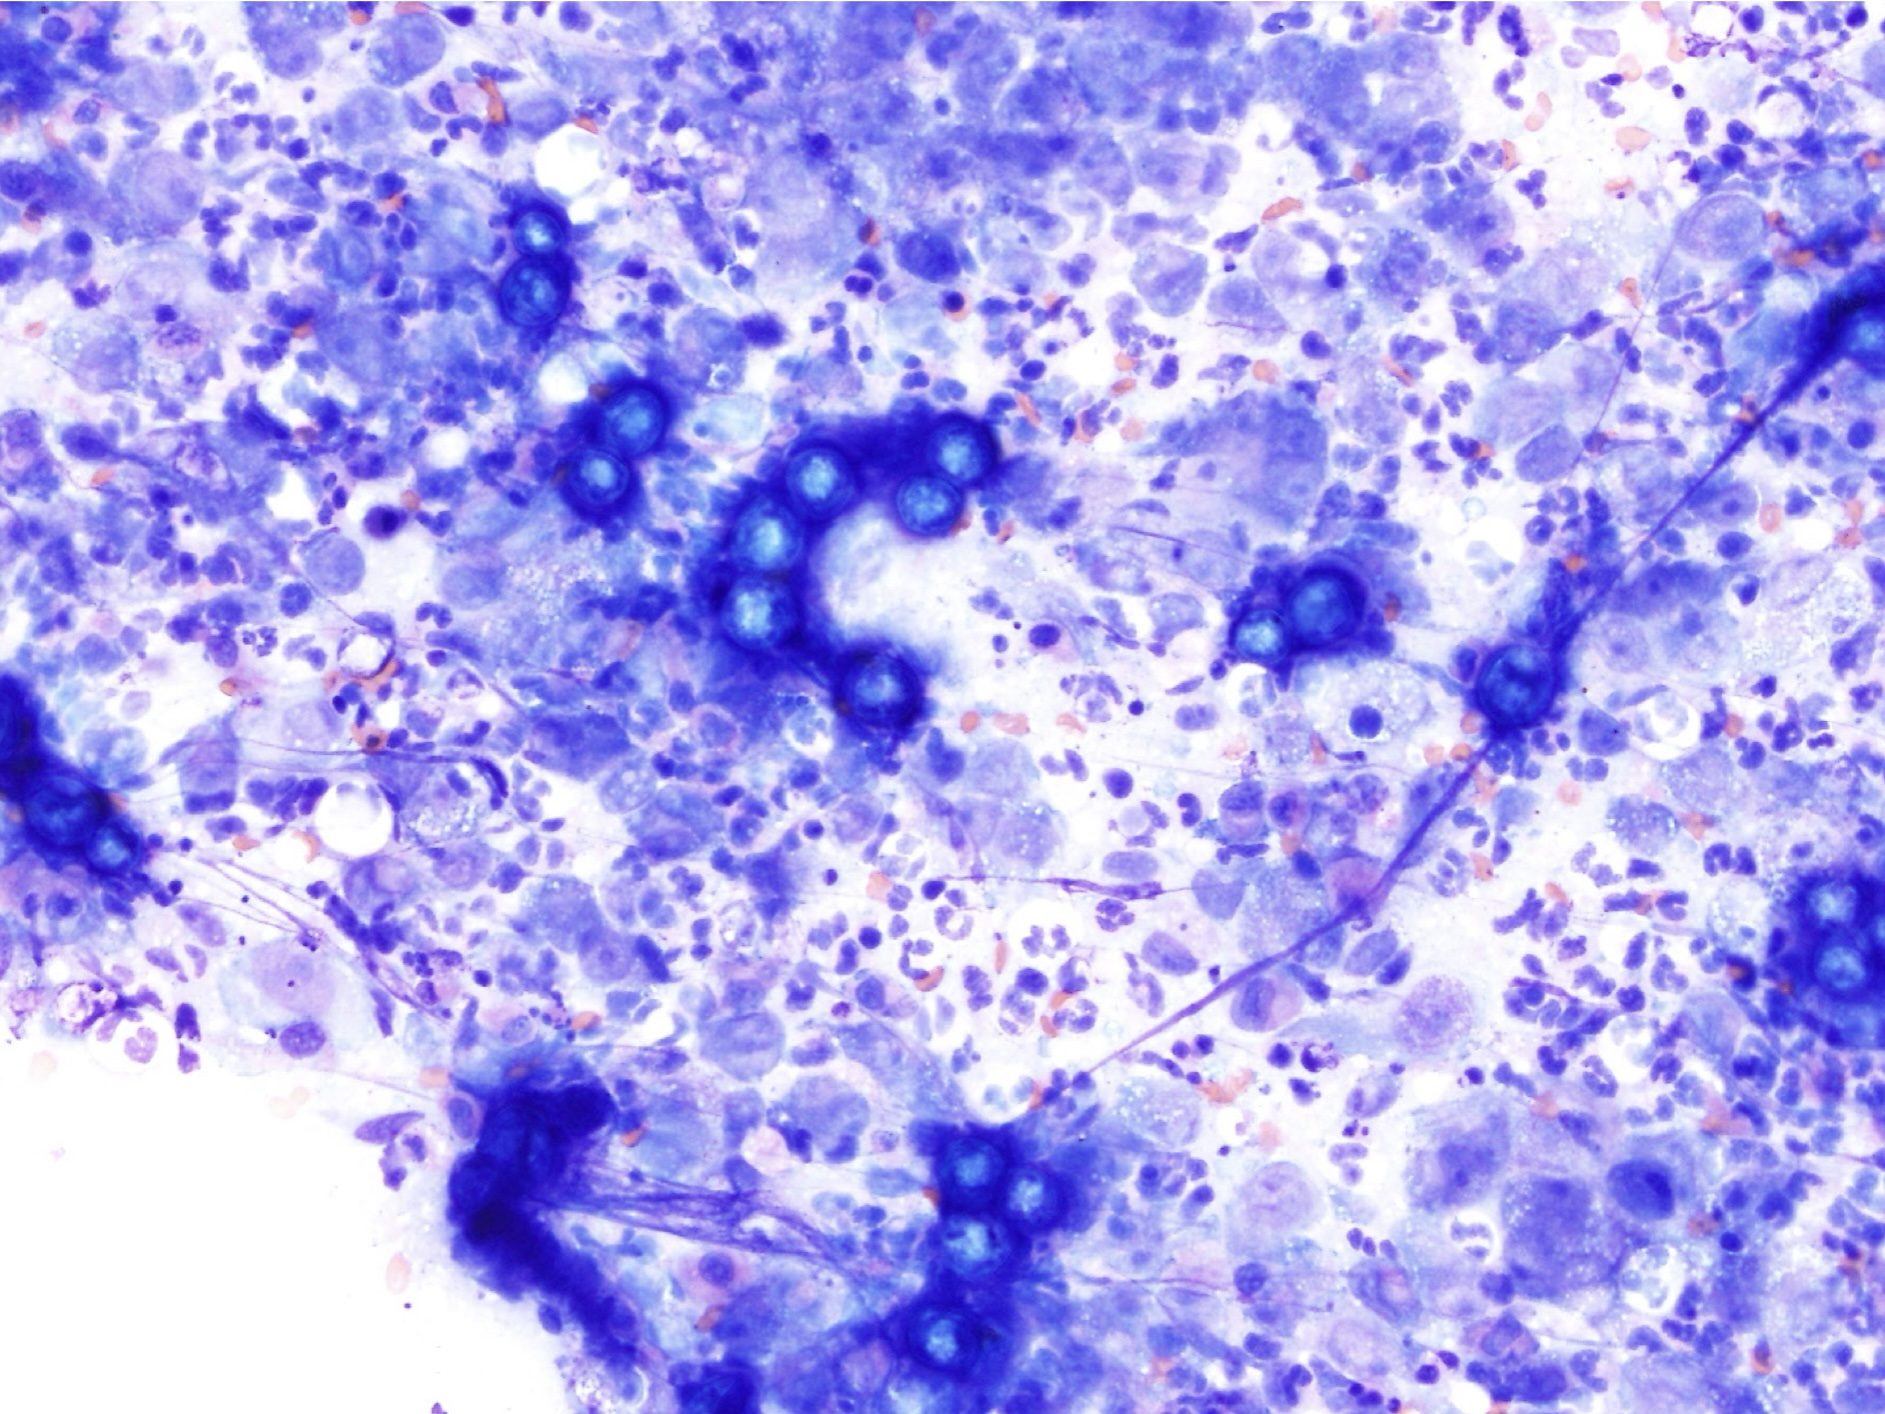
Subsequently, decide if the inflammatory lesion is septic or nonseptic. Septic refers to the presence of any infectious organism, whether bacterial, fungal, or parasitic. The predominant cell type can aid in making this decision, for example, if degenerate neutrophils predominate, bacteria are likely present (Fig. 5.8). The 100x objective may be needed in order to definitively identify bacteria. Mixed neutrophilic and macrophagic inflammation may be seen with fungal infection or foreign body reactions (Fig. 5.9). The more homogeneous the cell population, particularly in the case of mast cells, plasma cells, and lymphocytes, the greater the likelihood that the lesion is neoplastic rather than inflammatory.
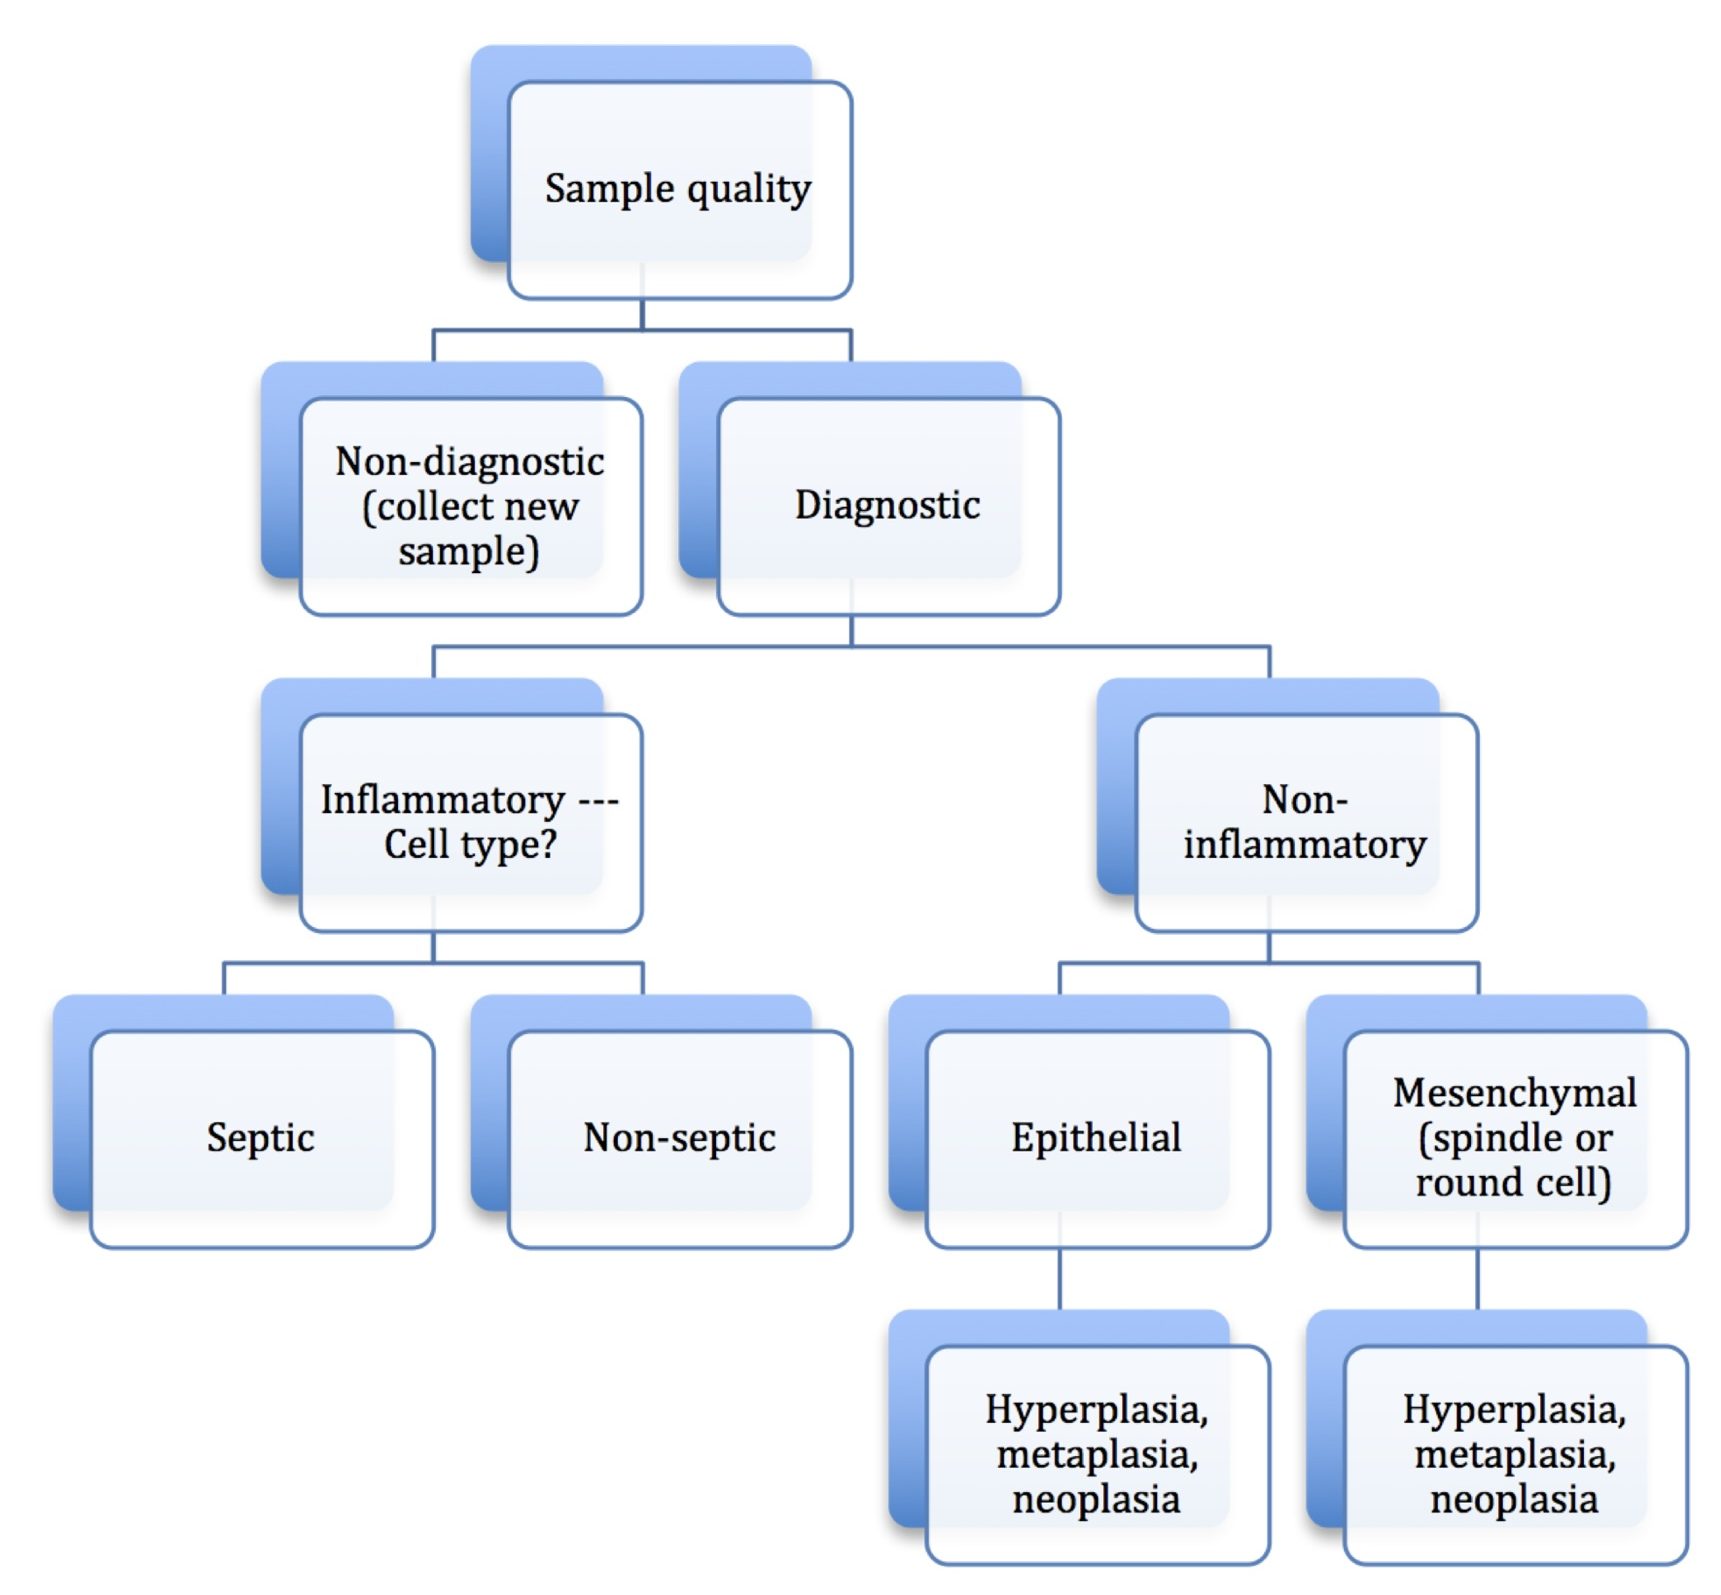
Noninflammatory aspirates are composed of tissue cells that may be hyperplastic, metaplastic, or neoplastic (see glossary for definitions). Neoplastic lesions should be distinguished as epithelial or mesenchymal, and malignant or benign. These categories are not necessarily mutually exclusive, that is, neoplastic masses sometimes have concurrent inflammation. Malignant tumors may contain cells which appear relatively normal or hyperplastic, in addition to more typically malignant cells. However, the overall impression by viewing several slides and several areas generally allows one to follow this stepwise process (Fig. 5.10).
Mononuclear phagocyte found in tissues that develops from circulating blood monocytes and fulfills many roles in normal immune function including antigen presentation.
Large, multinucleated macrophage associated with chronic inflammation.
Granulocyte with large, round, pink to orange (eosinophilic) cytoplasmic granules and an often bi-lobed nucleus; important in host response to allergens and defense against parasites.
Mononuclear, granular leukocyte important in hypersensitivity reactions.
Terminally differentiated B lymphocyte that secretes specific antibody.
Lysis of the nucleus.
Cytoplasmic abnormalities seen in neutrophils that have not matured normally in the bone marrow. Abnormalities include retention of primary granules, vacuolation, darker staining due to retention of ribosomes, and deposits of rough endoplasmic reticulum (Döhle bodies).
Term used to describe neutrophils in cytologic preparations indicating swelling and lysis of the neutrophil nucleus, e.g. due to bacterial infection.
Referring to cells of the skin and adnexa, lining of the airways, intestines, and urinary tract, renal tubules, liver, and glandular tissues.
Referring to either spindle cells or discrete round cells.

