
Appendix B: General Background
21 Light and its interaction with matter
Learning Objectives
- In this section you will read about the basic properties of light and what astronomers can learn about objects that either produce or absorb light.
Contents
Part 1 Introduction
1.1 Photons are particles of light
1.2 Photons have a guiding wave
1.3 How to describe the brightness of a source of light: flux and luminosity
1.4 Classifying spectra
1.5 Kirchhoffs’s laws for spectra
Part 2 Blackbody spectra
2.1 Blackbody laws
2.2 The magnitude scale for measuring stellar brightness
2.3 Magnitudes and color indices
Part 3 Line spectra
3.1 Atoms and atomic structure
3.2 Atoms, emission lines, absorption lines
Part 4 High-energy processes
4.1 A general discussion of processes that emit light
4.2 Bremsstrahlung
4.3 Synchrotron and curvature radiation
Part 5 Summary
1 Introduction
1.1 Photons are particles of light
The particle nature of light was established by Albert Einstein in 1905. Light is composed of small particles called photons. All photons have energy. Energy is the ability to do work. For example, after taking a shower you might stand under a heat lamp to dry yourself; the heat lamp emits photons; when the photons strike water, their energy is converted to heat energy, and the water will evaporate. In this way, energy is doing work to evaporate the water.
Our eyes are clever: they can measure photon energy. We call this energy “color”. The highest energy our eyes can detect is called violet. The lowest energy our eyes can detect is called red. Between red and violet is a spectrum of colors. A spectrum (plural: spectra) is formed, in general, whenever you classify something based upon its position within a range or scale. For example, one can say that one’s opinion falls towards one end of a spectrum of opinions.
A rainbow is a type of spectrum. White light is composed of all visible colors. White light can be separated out into its individual color components. Sir Isaac Newton, in the 1660s, was the first to enumerate seven colors (ROYGBIV) in the rainbow:
red, orange, yellow, green, blue, indigo, violet.
→ direction of increasing photon energy →
Going from red to violet is moving in the direction of increasing photon energy.
A good analogy for forming a spectrum is a machine that separates coins. You deposit a collection of mixed coins into a slot, and the machine mechanically separates the coins into their individual denominations. Similarly, a stream of white light which passes through a dispersing mechanism, like a chunk of glass, will emerge as a series of streams of individual colors.

There are photon energies which our eyes cannot detect, but are still within the spectrum of light. At energies slightly lower than red is the infrared part of the spectrum, from the Latin “under red”. At energies slightly higher than violet is the ultraviolet, from the Latin “beyond violet”. The list below identifies all types of light in the spectrum:
radio, microwave, infrared, visible, ultraviolet, X-ray, gamma ray.
→ direction of increasing photon energy →
Going from radio to gamma ray is moving in the direction of increasing photon energy. They are all photons. They have different names because they were discovered at different times, and require different types of detectors. For example, radio waves are detected using antennas, but antennas are unable to detect visible light.
Let’s learn some nomenclature (from the Latin: in ancient Rome, a nomenclator was a “name-caller” or a servant who announced the names of visitors to the home). The words red and blue are used by astronomers quite differently than is usual in everyday spoken language. Astronomers use red to refer to the low-energy end of the spectrum of light, and use blue to refer to the high-energy end of the spectrum. The word “redder” means “lower photon energy”. You can construct the silly-sounding sentence “violet is bluer than blue” and make perfect sense to an astronomer. Also, astronomers interchangeably use the words “light”, “photon”, and “radiation”.
1.2 Photons have a guiding wave
The wave nature of light was demonstrated experimentally by Thomas Young in 1803. Photons exhibit wave-like properties. A wave is an oscillation, or a swing between extreme values. The diagram shows two complete waves frozen in time. The amplitude of a wave is its maximum displacement from its average value. When the wave is at its average value, we say that the wave is at a node. Crests are the portions of the wave above the average value, and troughs are where the wave is below its average value.
The wavelength is defined as the distance between consecutive peaks. The wavelength is interesting because it is a measure of the energy of the photon. Smaller wavelengths correspond to larger photon energies, and longer wavelengths correspond to smaller photon energies. The relationship between wavelength and photon energy is said to be inverse. Whenever two quantities are doomed to change in opposite directions, we say that these two quantities vary inversely to each other.

The frequency of a traveling wave is defined as the number of wave crests per second that arrive at a location. Frequency has units of oscillations per second, or cycles per second. The frequency of a photon is also related to its energy. Higher frequencies correspond to higher photon energies. Lower frequencies correspond to lower photon energies.

The amplitude of a wave is unrelated to the photon’s energy. Amplitude will increase or decrease when two or more waves add together. In the case of photons, many photons traveling together will, as a collection, have a larger amplitude than fewer photons. We use the word, intensity, to describe the amplitude of a collection of photons. In fact, the intensity is directly related to the square of the value of the amplitude.
All told, we have four different ways to describe the energy of a photon: energy, color, wavelength, and frequency. Astronomers use these words interchangeably. In detail, these words are not interchangeable: color is our perception of photon energy, and not photon energy itself. We all see colors differently from each other; for example, what is green to one person might be blue to another, and might be neither to a third.
The speed of light is constant. For example, radio light travels exactly as fast as X-ray light, because both are composed of photons. All photons travel at the same speed. You can try to push a photon to go faster or slower, but you will never succeed in changing its speed. What does change is the photon’s wavelength. If you add energy to a photon, then it adopts a smaller wavelength, but it will never change its speed.
The study of the spectra of light is called spectroscopy. We study spectroscopy because spectra encode a lot of information about the source of the light. We can derive an object’s composition, temperature, pressure, state, size, luminosity, distance, and motion, all from its spectrum. Our methods of derivation include a body of rules which we call radiation laws.
In this course, we will study radiation laws due to Planck, Wien, Stefan & Boltzmann, Kirchhoff, Bohr, and Doppler.
Fun fact: The word spectrum comes from the Latin and has the same root as the word specter, meaning ghost. Medieval Europeans had no explanation for the rainbow because the light seemed to have no source, so they called it ghostly light or spectral light.
A note on units
Wavelength is measured in meters, m (like any other length), and frequency is measured in cycles (complete waves) per second. Cycles per second is called hertz, Hz. Speed is measured in meters per second. The speed of light is about 3e+8 meters/second and is given by the symbol c.
The speed, frequency, and wavelength of a wave are related by
![\[\mathit{frequency} \times \mathit{wavelength} = \mathit{speed} \]](https://openpress.usask.ca/app/uploads/quicklatex/quicklatex.com-5e055af54c56007e03ca8aea2e26f69e_l3.svg "Rendered by QuickLaTeX.com")
Or symbolically,
![\[ f \times \lambda = c\]](https://openpress.usask.ca/app/uploads/quicklatex/quicklatex.com-39ddaa37329d622556d5c37c01efa27a_l3.svg "Rendered by QuickLaTeX.com")
This relation is easy to intuit. If a wave has wavelength in meters/cycle and if it travels to you so that you receive waves with a frequency in cycles/second, then multiplying the two together gives
![\[ \frac{meters}{cycle} \times \frac{cycles}{second} = \frac{meters}{second}\]](https://openpress.usask.ca/app/uploads/quicklatex/quicklatex.com-87b4cd995be1acc24eaa67ec69aebae4_l3.svg "Rendered by QuickLaTeX.com")
The “cycle” appears in both the numerator and denominator and so divides away, and we are left with units of speed.
For historical reasons the radio spectrum is divided into “channels” or “bands” with letter names like L, X, and C. The L-band has a central frequency of 1500 MHz (millions of cycles per second). What is the wavelength of a photon with this frequency?
![\[ \lambda = \frac{c}{f} = \frac{3e8\ m/s}{1500e6\ 1/s} = 0.20\ m\]](https://openpress.usask.ca/app/uploads/quicklatex/quicklatex.com-b50a648bb81816507be6fd7633ecf2d1_l3.svg "Rendered by QuickLaTeX.com")
Thus a photon with a frequency of 1500 MHz has a wavelength of 0.20 meters, or 20 cm.
1.3 How to describe the brightness of a source of light
Flux vs luminosity
Luminosity is the total light energy per second emitted in all directions from a source of light. Luminosity is measured in watts.
Flux is the total light energy per second passing through a detector. The detector can be an eye, an antenna, a camera, or any imaginary flat surface. Flux is measured in watts per square meter.
For example, consider a 20 watt light bulb. Its luminosity is 20 watts. To capture the luminosity of the bulb, you would have to build a shell around the bulb to capture all the light being emitted by the bulb.
In practice we do not build shells. We use bulbs that shed enough light so that the fraction of the light that enters our eyes provides sufficient power for us to see; the fraction of the per-second light energy that our eyes capture is called the flux.
No matter how large a shell you build around the bulb, that shell will always capture all of the light. The luminosity is an intrinsic property of the bulb, not of the shell.

The situation is quite different with capturing flux. The farther away the detector is from the bulb, the less light is intercepted by the detector. Therefore, flux decreases as you get farther away from the source. Flux decreases because light energy spreads out as it travels away from the bulb. Light energy becomes more dilute as it travels outward from a source.
A good example is looking at street lamps at night. Each lamp has the same wattage bulb, so each lamp has the same luminosity. The lamps that are closest to you appear to be brighter, because the light has had less distance to spread out and therefore the flux is higher.
The flux equation
Flux and luminosity are related to each other by a simple relation. We see that light energy spreads out as it travels away from a source. Imagine that all detectors are at the same distance from the source, then all detectors would measure the same flux, because the light is diluted by the same distance. All these detectors would be located on the inside surface of an imaginary sphere. We say that the luminosity is diluted over the surface area of a sphere. We represent dilution by the mathematical operation of division. Therefore, the relation between flux and luminosity is:
![\[ \mathit{flux} = \frac{\mathit{luminosity}}{4 \pi d^2}\]](https://openpress.usask.ca/app/uploads/quicklatex/quicklatex.com-5a493633dd380e4c7775d555841bd6a8_l3.svg "Rendered by QuickLaTeX.com")
This relation is called the flux equation. The surface area of a sphere, 4 pi d^2, contains “d”, which is the distance between the source of the light and any detector located at a distance “d”’ away from the source.
There are 3 unknown quantities in the flux equation: flux, luminosity, and distance. To solve the equation, we need to know the values of any 2 of these 3 variables. In practice, astronomers use the flux equation to find distance; it is done in this way:
- measure the flux,
- estimate the luminosity,
- solve the flux equation to find distance.
Measuring the flux is easy. All you have to do is measure the energy entering your telescope. To measure this energy, astronomers use a variety of different detectors, like digital cameras, or antennas, or photon counters (a Geiger counter is a type of photon counter for X ray and gamma ray photons), or even highly specialized bolometers (these are like blackened thermometers). The flux of our Sun on the Earth is about 1 kilowatt (1 thousand watts) per square meter; this is equivalent to 1 gigawatt (1 billion watts) per square kilometer.
Luminosity cannot be measured directly, so it must be estimated. We estimate luminosities using so-called radiation laws. Learning how to use radiation laws to estimate luminosity will occupy much of the rest of our time on light and light waves.
Use of the flux equation is the primary way that distances are found in astronomy. Sometimes this method is well-disguised, but it is always there.
1.4 Classifying spectra
A spectrum is used to classify something on a scale. A spectrum of light is when you classify photons by their colors (or energies). There are three different types of spectra of light:
- continuous spectrum,
- line emission spectrum (sometimes called an emission spectrum),
- line absorption spectrum (sometimes called an absorption spectrum).
In general, emission means to produce light, and absorption means to remove light. A continuous spectral feature is one that is present over many shades of color. A line spectral feature is one that is present only at a few specific shades of color. Note that there are an infinite number of shades of color available; for example, there are an infinite number of shades of red. We use “shade of color” to refer to a specific energy of a photon.
If we apply these general classes to the 3 different types of spectra, we derive the following descriptions:
- A continuous spectrum has light energy present at all available colors.
- A line emission spectrum has light energy present only at specific shades of color.
- A line absorption spectrum has light energy present at all colors, with the exception of a few specific shades of color.
The diagrams give examples of spectra. The vertical axis scales for light energy output, which is sometimes called brightness, or intensity; brighter light is towards the top of the diagram. The horizontal axis scales for photon energy, which is also called color, or wavelength, or frequency; in these diagrams red is towards the right, but this convention changes from author to author. The plot of energy output versus color is called a spectral curve. The smooth part of the curve is called the continuum, and deviations from the continuum are called spectral features.


1.5 Kirchhoff’s laws for spectra
Kirchhoff’s laws date from the 1860s, and are due to Gustav Kirchhoff and Robert Bunsen. These laws are a set of rules that allow us to predict the physical conditions of a source of light when given its spectrum; conversely, we can predict the type of spectrum emitted by a source when we know the physical conditions of the source. In this context, physical conditions refer to density and temperature. Kirchhoff’s laws are a type of rule called empirical laws, meaning that they
were formulated from experimental evidence only, with no underlying theory of what is physically happening. Kirchhoff’s laws are:
- A gas at high density and high temperature produces light with a continuous emission spectrum.
- A gas at low density and high temperature produces light with a line emission spectrum.
- A gas at high density and high temperature, whose light passes through a gas of lower density and lower temperature along a straight line of sight, produces light with a line absorption spectrum.
All stars produce a line absorption spectrum. Therefore we conclude that a star has at least two components: a high density and high temperature core, and a lower density and lower temperature atmosphere. Star light comes to us from the top of the star’s atmosphere.
Fun fact: Dr Bunsen Honeydew of Muppet Labs (“where the future is being made today’”) was named after Robert Bunsen.

2 Blackbody spectra
2.1 Blackbody laws
Blackbody radiation is the most common type of continuous emission spectral radiation. It is sometimes called thermal radiation, because the radiator’s surface temperature determines the characteristics of its spectrum. These characteristics are (i) the shape of the spectral curve, (ii) the location of the peak of the energy output, and (iii) the total area under the spectral curve. There are 3 laws describing blackbody radiation: Planck’s law, Wien’s law, and the law of Stefan & Boltzmann.
Planck’s law, from 1905, tells us that the blackbody spectral curve has a single peak, or a single color which is brightest.
Wien’s law (sometimes called Wien’s displacement law), from 1893, tells us that the wavelength of the peak of the blackbody spectral curve (lambda in the figure) is inversely proportional to the temperature of the object emitting the blackbody radiation. For example, if the temperature of the object increases, then the wavelength of its spectral peak decreases. Smaller wavelengths are more blue, so the object would appear more blue to the eye. If the temperature of the object increases, then the wavelength of its spectral peak increases. Larger wavelengths are more red, so the object would appear more red to the eye.
The law of Stefan & Boltzmann, from 1884, tells us that the luminosity (the shaded-in portion of the bottom-most spectrum) of a blackbody radiator increases with increasing surface temperature, and also with increasing surface area. For example, for two objects of the same size the one at a higher temperature is more luminous (i.e., emits more light energy per second in all directions). Another example: for two objects at the same surface temperature the larger object is more luminous.

Mathematical representation
Mathematically, Wien’s law can be written in two ways; thus:
![\[\mathit{surface\ temperature} = \mathit{Wien's constant} \times \mathit{wavelength\ of\ peak}\]](https://openpress.usask.ca/app/uploads/quicklatex/quicklatex.com-c21d0ad5413a14da779d8fa4d3b58efe_l3.svg "Rendered by QuickLaTeX.com")
or thus:
![\[\frac{\mathit{surface\ temperature\ 1}}{surface\ temperature\ 2} = \frac{wavelength\ of\ peak\ 2}{wavelength\ of\ peak\ 1}\]](https://openpress.usask.ca/app/uploads/quicklatex/quicklatex.com-1818ed29e13de7f31450dd275fc2eaa1_l3.svg "Rendered by QuickLaTeX.com")
The law of Stefan & Boltzmann can be written in two ways:
![\[\mathit{luminosity} = \mathit{Stefan's\ constant} \times \mathit{surface\ area} \times \mathit{temperature}^4\]](https://openpress.usask.ca/app/uploads/quicklatex/quicklatex.com-1e5d0bf68af37ea44fb044fcf53b26f1_l3.svg "Rendered by QuickLaTeX.com")
Or
![\[\frac{\mathit{luminosity\ 1}}{\mathit{luminosity\ 2}} = \frac{\mathit{surface\ area\ 1}}{\mathit{surface\ area\ 2}} \times \left( \frac{\mathit{surface\ temperature\ 1}}{\mathit{surface\ temperature\ 2}}\right)^4\]](https://openpress.usask.ca/app/uploads/quicklatex/quicklatex.com-32e85fc6c55c75cee1e32c019c0429d0_l3.svg "Rendered by QuickLaTeX.com")
2.2 The magnitude scale for measuring stellar brightness
For this lesson you will want to review the difference between flux and luminosity.
The magnitude scale was invented by Hipparchos of Nicaea, who lived in the second century BCE. He compiled a catalog of 216 stars, recording their positions and apparent brightnesses. To record brightness, he invented the magnitude system. To this day, all star maps and catalogs report stars on the magnitude system.
Magnitude meant importance to Hipparchos, hence the brightest stars were of the first magnitude. Less bright stars were of secondary (2nd) or tertiary (3rd) magnitude. Second magnitude stars were apparently half as bright as first magnitude stars, and third magnitude stars were apparently half as bright again. Therefore, larger magnitude numbers describe fainter stars.
Note that apparent means “as seen by the eye”. Our eyes are highly non-linear detectors, i.e., stars that appear half as bright are NOT emitting half as much energy. In fact, most biological senses are non-linear in their response; from an evolutionary standpoint this makes sense. When there is a lot of light available our eyes become inefficient; there is no need to detect all the light; we detect only enough light to function. However, when the ambient illumination becomes very low, our eyes become highly efficient and (when dark-adapted) are able to detect almost all available light. To achieve this efficiency our eyes dispense with color vision and detect only light intensity, which we call shades of gray. Astronomers in the 20th century modernized the magnitude scale and discovered that the eye is, specifically, a logarithmic detector.
There are two types of magnitude, depending upon whether we are measuring flux or luminosity.
- Apparent magnitude (m) is how bright the star appears from the Earth-bound observer. Apparent magnitude is related to a star’s flux.
- Absolute magnitude (M) is how bright the star would appear if it were at a distance of 10 parsecs. Absolute magnitude is related to a star’s luminosity.
Using the definition of magnitude, we can rewrite the flux equation. In its original form,
![\[ f = \frac{L}{4 \pi d^2}\]](https://openpress.usask.ca/app/uploads/quicklatex/quicklatex.com-3da483c5a34edf8f23c9d78b36e7b215_l3.svg "Rendered by QuickLaTeX.com")
Using magnitudes, the flux equation becomes the so-called distance modulus formula:
![\[m - M = 5 \log_{10} d - 5\]](https://openpress.usask.ca/app/uploads/quicklatex/quicklatex.com-59eb6c52bf50b3b7055804dbb5252393_l3.svg "Rendered by QuickLaTeX.com")
Here, log is the base-10 logarithm, and distance d is in parsecs. The quantity on the left, m-M, is called the distance modulus. When dealing with logarithms, the operations of division and subtraction are related, so the quantity (f/L) becomes a subtraction. The 5s come from our choice of units thus: the logarithm of 10 is 1, so the right side becomes 5-5 = 0; in other words, we force apparent and absolute magnitudes to be equal when the distance to the star is 10 parsecs.
Some numbers will help make sense of the magnitude system. The brightest star in the sky (after the Sun) is Sirius, with m = -1.5 mag. The faintest star that our eyes can see is about m = 6 mag. The North Star, called Polaris or alpha UMi, ranks as about the 46th brightest star and has m = 1.97 mag.
Example: Sirius has a measured apparent magnitude of -1.5, and a geometric parallax of 0.38 arcseconds. What is its absolute magnitude? To respond, we need to know the distance to Sirius. Using the parallax-distance relation, we find that d = 2.6 pc. Using the distance modulus formula, we see that
![\[M = -1.5 - 5 \log(2.6) + 5\ \mathrm{mag}\]](https://openpress.usask.ca/app/uploads/quicklatex/quicklatex.com-612b4caccccc5d2517b177a7fad759ed_l3.svg "Rendered by QuickLaTeX.com")
or M = 1.4 mag.
Does the answer in our example make sense? Look at it this way: if Sirius were exactly 10 pc away from us, then its absolute (M) and apparent (m) magnitudes would be equal. But Sirius is closer than 10 pc, therefore it must be absolutely fainter than apparently (recall that the closer something is, the brighter it appears). Absolutely fainter means a higher value of M than m. The numerical values in the previous paragraph meet this criterion.
Fun fact: dark-adapted vision is called scotopic vision, from the Greek skotos (darkness) and opia (seeing). Related words are myopic, telescopic, and microscopic.
Filters
A filter is a device that allows only a limited range of colors to pass through it. There are many filter systems in astronomy. The most commonly used one is called the Johnson-Morgan system, after Harold Johnson and William Morgan who published the system in 1953. Their system is based upon the MK classification system, in that the filters are colored so that the flux of any star measured through these filters will give a good indication of the star’s surface temperature.
The Johnson-Morgan system is sometimes called the UBVRI system, after its primary filters U, B, V, R, and I. The basic characteristics of each filter are listed in the table.
| Filter name | Spectrum coverage |
| U | ultraviolet |
| B | visible (blue) |
| V | visible (green) |
| R | visible (red) |
| I | infrared |
Using filters to establish stellar surface temperature
In the section on blackbody spectra, it was said that Planck’s law tells us that all blackbody radiators exhibit spectra with a single peak or wavelength of brightest emission. In fact, Planck’s law is more powerful than what was stated there. Planck’s law tells us that all blackbody spectra have a well-defined shape that is unique to the temperature of the radiator. In theory, if you can measure the flux of a blackbody radiator at any two wavelengths (or colors), then you can obtain the surface temperature of the radiator. This idea is illustrated in the accompanying diagram.
In the diagram, the shaded area is the flux allowed through the labeled filter, in this case the two filters B and V. The difference in the flux between the two filters is an indicator of the slope of the blackbody curve between those two filters. For different surface temperatures the shape of the blackbody curve will change, thus the slope between any two filters will change.

Color index
Flux is measured in magnitudes, m. The flux through a filter is given by the subscript of the filter, so for example the apparent magnitude of a star through the V filter is called  , or oftimes just V. The absolute magnitude would be called
  . The distance modulus formula (recall that this is the flux equation as expressed using magnitudes) for this filter is:

Recalling that slope = rise/run, then the rise in the case of filtered magnitudes would be

The magnitude difference between any two filters is called a color index. By convention, color indices are always reported as bluer magnitude minus redder magnitude. One would write  but NEVER
  .
.
Vega is the color standard for stars
Vega, or alpha Lyr, is the apparently 4th brightest star in the sky. Its location on the celestial sphere makes it easily viewable by the majority of the world’s observatories. It was selected as the primary color standard for stars. Its color indices are all defined as zero, i.e.,


Therefore, all stars are compared to Vega with respect to their color. We say that a star is either redder than Vega, or bluer. Redder colors correspond to lower surface temperatures, so a star with redder color indices would have a lower surface temperature than Vega.
Vega has a surface temperature of about 10,000 kelvin, and is on the main sequence.
A worked example: the star Antares
Here is an example of how to use color indices to predict the relative color and temperature of a star. Here is a list of filter magnitudes for Antares (the star in the heart of Scorpius):
| Filter | Apparent magnitude |
| U | +4.08 |
| B | +2.75 |
| V | +0.91 |
| R | -0.64 |
| I | -1.87 |
The U-B color index is 4.08-2.75 = +1.33. Since the color index is positive, therefore the bluer filter has the larger magnitude number. Larger magnitude is fainter. Therefore this star is fainter in the blue than in the red. Therefore this star is redder than Vega. Therefore this star has a lower surface temperature than Vega.
The HR diagram
An HR diagram is a scatter plot of luminosity (y) versus surface temperature (x) for stars. The HR diagram is often drawn as absolute magnitude (y) versus color index (x), in which case it is called a color-magnitude diagram.
Some conventions
When reading “m” for a star, what is usually quoted is V because our eyes are most sensitive in the chartreuse or yellow-green area of the spectrum where this filter is centered. However, “m” could also refer to the magnitude integrated over all wavelengths, which is called the bolometric magnitude,  , from the Greek “bole” meaning “beam of light”. You may have to read the context closely to figure out which magnitude is being used in various locales.
3 Line spectra
3.1 Atoms and atomic structure
The goal is to learn about the interior structure of the atom. Then, we will apply this knowledge to learn how atoms interacting with light can produce emission line spectra and absorption line spectra.
A good model of an atom was proposed by Neils Bohr in 1912. In Bohr’s model, an atom is made up of a positively charged nucleus surrounded by negatively charged electrons.
A discussion of charge
A charge is a property of an object that tells it how to behave when in the presence of other charges. It does not matter what the name of the charge is; terms like positive and negative have historical significance only. As long as you know the names of the charges and the rules governing them, you can make predictions.
The simplest charge is the gravitational charge. There is only one charge, and we call it mass. Gravitational charges always act to attract each other. For gravity, we know the name of the charge, being mass, and the behavior, being to attract, so we can make predictions.
The next simplest charge system is electric. There are two electric charges. Electric charges are called positive and negative. The rule is simple: alike charges repel, unalike charges attract. Neutral refers to a lack of charge; there is no rule for neutrals because they ignore charges.

Bohr’s model of the atom
In Bohr’s model, electrons carrying negative charges will orbit around a central nucleus of positive charge. Only specific orbits are allowed to the electrons; these allowed orbits are called orbitals. Other orbits are forbidden to the electrons and are never drawn. Orbitals are indexed using the letter “n”, and are numbered from the inside out.
The electron occupies one or another of the orbitals in a way depending upon the electron’s energy. When an electron has the lowest energy possible, then it occupies the n=1 orbital. The n=1 orbital is called the ground state. When the electron has higher energies than the lowest, then it occupies orbitals with higher numbers. The higher numbered orbitals n=2, 3, 4, …, are called excited states. The words state and orbital can be used interchangeably. There is no limit to the number of orbitals in an atom.
A good and oft-used analogy is to liken orbitals to steps on a staircase.

A few details: first, orbital energies follow the pattern shown in the diagram, where as you get farther away from the nucleus, the orbital energies get closer to each other. Second, all atoms of the same type have the same pattern of orbitals, but atoms of different types have completely different patterns of orbitals from each other. For example, all hydrogen has the same pattern of orbitals, but hydrogen and helium have completely different patterns.
Since different types of atoms have different orbital patterns, therefore different types of atoms have different internal energy structures. These different internal orbital structures are crucial to being able to identify the type of atom from its spectrum.
3.2 Atoms, emission lines, absorption lines
The goal is to understand how light interacting with atoms can give rise to emission lines and absorption lines.
You must recall the following:
- that electrons follow orbitals around the atom’s nucleus,
- that each orbital has a specific electron energy associated with it,
- that orbitals farther from the nucleus have higher energy.
Process of formation of absorption lines
Start with an atom illuminated by a light field. The field contains photons of all colors. A photon will be absorbed by the atom if the photon has the identical energy as some available “jump up” between any two orbitals. The jump-up energy is the energy difference between two orbitals.
The jump-up energy is the specific energy required to allow an electron to move from one orbital to a higher orbital. The photon is destroyed and all of its energy is accepted by the electron.
The electron moves to a higher energy orbital. That specific energy of the photon is now missing from the light. A missing energy of light is equivalent to a missing specific shade of color. A missing shade of color is the definition of an absorption line.
Process of formation of emission lines
Start with an atom with an electron in an excited state. The electron will release energy by emitting a single photon. The electron jumps down to a lower energy orbital. The photon released has the identical energy to the jump-down energy between the two orbitals, i.e., to the
energy difference between the two orbitals. The light from the atom has only this specific energy of photon present, or only this specific shade of color present. The presence of a specific shade of color is the definition of an emission line.
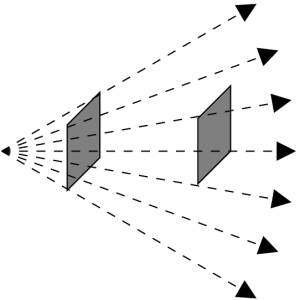
A detailed example
The two figures show an example of an absorption, followed by a pair of emissions. In the first figure, an electron begins in the n=1 state. The atom is illuminated with light. Most of the light is of the wrong energy to cause a jump up, and so passes through the atom and forms the continuum of the spectrum. However, those photons with precisely the right energy to cause a jump up will be absorbed. In this case, the electron jumped up directly to the n=3 level, absorbing a photon far to the blue (short wavelength) end of the spectrum.
In the second figure, the electron is still bound in the atom but is in the n=3 state. The electron will act to shed its energy and return to the ground state (n=1). The electron has more than one path to the ground state: it could jump directly to it, but in the case shown in the figure the electron instead makes two jumps, down to the n=2 level, and then down again to the n=1 level. The electron will emit one photon for each jump; two jumps produce a total of two photons. Therefore two emission lines are produced.
The larger the jump, the bluer (higher energy) the photon. The largest jump shown in this example is between the n=1 and n=3 levels, so it interacts with the bluest photon (in absorption in this case). The next most energetic jump in this example is between the n=2 and n=1
levels, so this interaction is less blue (emission in this case). The least energetic interaction in this example is between the n=3 and n=2 levels, so the emission line produced is less blue than either of the other two lines.
A few notes: first, there is exactly one photon per jump, whether the jump be up or down. Second, emitted photons are emitted in random directions. Third, note that in the second diagram, the intensities of the emission lines are different from each other. The spectra drawn in both of these diagrams assume that there is a light field and many, many atoms for the light to interact with. The difference in the line-to-line intensity is called a line decrement. Line decrements are very sensitive indicators of temperature.


4 High-energy processes
4.1 A general discussion of processes that emit light
A discussion of processes that emit and absorb light begins and ends with electrons. Electrons are important, firstly, because they have an electric charge, and photons and electric charges are closely connected concepts. Secondly, electrons have very small masses, thus they easily move about. The spectra already discussed, being atomic line spectra and blackbody spectra, are both produced when electrons are in motion. Spectral lines, both in emission and in absorption, are produced when electrons move between two orbitals. The cause of blackbody spectra was not discussed because it is a challenging concept, but suffice it to say that oscillating (swinging, or vibrating) electrons absorb and emit photons in such a way that a blackbody spectrum is the result.
A key similarity between the processes producing line spectra and blackbody spectra is that in both cases the electrons are confined to a small region of space. We say that the electrons are bound, that is, are not free to travel large distances. Each electron producing line radiation is trapped within its parent atom. The ensemble of electrons producing blackbody radiation are trapped within an assembly of atoms.
We turn our attention to free electrons. These electrons are unbound, thus are able to travel great distances. Electrons that are moving emit photons. This statement is true whether the electrons are moving along a straight line path or a curved path, and whether the electrons are moving at the same rate or at a changing rate. Any change of rate of travel or of direction of travel is called acceleration. The environment traversed by the electrons will determine the rate and acceleration of travel, which in turn determines the type of spectrum they emit. We will discuss three types of spectrum: bremsstrahlung, synchrotron, and curvature.
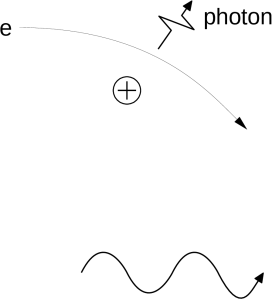
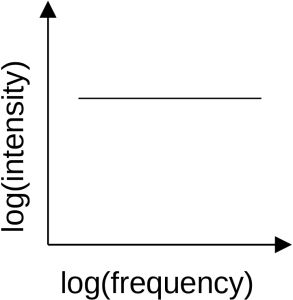
4.2 Bremsstrahlung
A plasma is a high-temperature gas consisting of freely traveling electrons and atomic nuclei. The electrons and nuclei frequently pass close to one another, and when they do so they accelerate due to the pull of attraction between them. During this acceleration the electrons emit photons. The photons collectively produce a continuous spectrum. This continuous spectrum has a flat shape, meaning that at every photon frequency the intensity of the spectrum has about the same value. This radiation (light) is called bremsstrahlung, or “braking radiation”. The name comes from its discovery in a lab experiment in which fast-moving electrons were brought to a halt very rapidly; the electrons emitted bursts of light. Bremsstrahlung is sometimes called free-free radiation because the electron is free before it encounters the nucleus and free after its encounter.
4.3 Synchrotron and curvature radiation
There can be complexities to a plasma. The first is that the electrons can be moving at very high speeds which results in an effect called beaming. The second is that the plasma can be threaded by a magnetic field. The electrons will orient their direction of travel in a way related to the direction of the magnetic field which results in an effect called polarization.
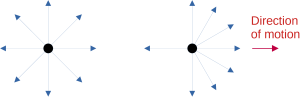
Beaming
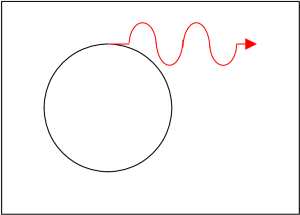
A stationary or non-moving electron radiates photons in all directions with equal intensity. A moving electron emits light preferentially towards the direction it travels. This direction of emission becomes quite pronounced when the electron is moving at speeds close to the speed of light. An electron moving close to the speed of light is called a relativistic electron. A relativistic electron emits photons in a direction confined to a narrow cone pointed in the direction of moving. The electron thus appears much brighter when this cone is pointed at the observer, i.e., when viewed from directly in front of it, an effect called relativistic beaming.
Magnetic fields and electron motion
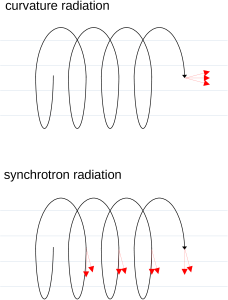
A magnetic field can push on an electron and thus cause the electron to accelerate, i.e., change its direction of motion. The path followed by an electron in a magnetic field is a helix, or a corkscrew. The path shape determines in which directions the electron emits light.
If the electron moves rapidly around in a circle and only slowly forward (forward is parallel to the magnetic field lines) then the electron emits most of its light tangent to the circle and thus perpendicular to the magnetic field lines. This light is called synchrotron radiation. An analogy would be riding a bicycle on wet pavement. The tires throw off water from their outer edge.
If, on the other hand, the electron’s motion is rapidly forward and only slowly circular then the electron emits most of its light in the forward direction and parallel to the magnetic field lines. This light is called curvature radiation.
Collectively, synchrotron radiation and curvature radiation are called non-thermal radiation, because their characteristics are not related to the temperature of the electrons.
Spectral index
Non-thermal radiation has a steep spectrum, meaning that the light emitted is fainter at higher frequency and brighter at lower frequency. The brightness, B, and frequency, f, are related by a quantity called the spectral index, a,

Polarization
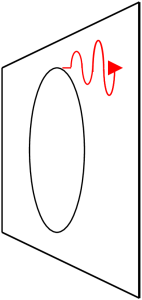
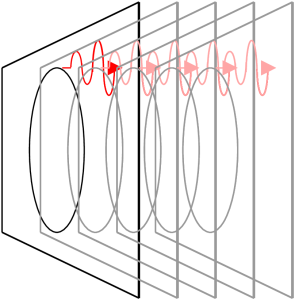
An electron swirling around in a circle will emit light waves with the amplitude directed preferentially up-and-down in the same orientation as the circle. Light with a preferred direction of amplitude is called polarized light. The polarization of light is a defining characteristic of non-thermal radiation.
4 Summary
| Type of light | Emitting particles | Can be used to measure temperature? | Polarized? |
| Blackbody | Bound electrons | yes | no |
| Spectral line | Bound electrons | yes | no |
| Bremsstrahlung | Free electrons | yes | no |
| Synchrotron | Free electrons | no | yes |
| Curvature | Free electrons | no | yes |